Enhancement of breakdown strength and energy density in BaTiO3/ferroelectric polymer nanocomposites via processing-induced matrix crystallinity and uniformity

Yunsang Kim ab, O'Neil L. Smith a, Mohanalingam Kathaperumal a, Lucas R. Johnstone a, Ming-Jen Pan c and Joseph W. Perry *a
aSchool of Chemistry and Biochemistry, and Center for Organic Photonics and Electronics Georgia Institute of Technology, Atlanta, GA 30332, USA. E-mail: joe.perry@gatech.edu
bSchool of Materials Science and Engineering, Georgia Institute of Technology, Atlanta, GA 30332, USA
cNaval Research Laboratory, 4555 Overlook Avenue, Washington, D.C. 20375, USA

Received 4th February 2014 , Accepted 14th April 2014

First published on 16th April 2014


Abstract

We have investigated the impact of the processing methodology on nanocomposite thin films formed via blade casting versus spin coating on the electric breakdown strength and energy storage properties of BaTiO3 nanoparticle/poly(vinylidene fluoride-co-hexafluoropropylene) nanocomposites. Nanocomposite films containing 50% volume loading of surface-modified BaTiO3 nanoparticles fabricated by the use of blade casting showed a denser and more uniform morphology, and larger polymer crystallite domains, relative to those obtained via spin coating. The improved morphology has resulted in an increase of up to 60% in the breakdown strength and in energy density by a factor of ∼2–3 and for blade-cast vs. spin coated nanocomposite films containing 50 or 120 nm BaTiO3 nanoparticles, yielding a maximum extractable energy density of 7 J cm−3. We attribute the increase in energy density and dielectric breakdown strength to the effects of the improved uniformity and the formation of polymer nanocrystalline domains in the matrix, as shown by cross-sectional SEM and topological AFM images, and X-ray diffraction results. These results stress the importance of controlling nanoscale morphology for optimizing energy storage capacity of solution-processed nanocomposite thin films for pulsed power, gate dielectrics, and other thin-film power applications.

1. Introduction

The surge in demand for electrical energy has prompted greater interest in high-performance energy storage materials and devices, such as capacitors, super- and pseudo-capacitors, batteries, and fuel cells.1–3 Among these devices, capacitors possess an inherent advantage of high power density because of their fast electrical charge and discharge capabilities. Polymeric thin films have long been the material of choice for capacitors because of their high dielectric strength and fast electrical charge–discharge speeds.4,5 However, the low relative permittivity of polymeric materials significantly compromises the energy density of capacitors, and more importantly, limits the potential of capacitors used for energy storage device applications. Among the many approaches to improving relative permittivity of polymeric materials, the nanocomposite approach wherein a high permittivity inorganic nanoparticle is added to the polymer is promising because it combines advantages of both inorganic nanoparticles with high permittivity and polymeric materials with high breakdown strength (EB), as well as facile processibility.6–8

Previously, we have reported on dielectric nanocomposites consisting of poly(vinylidene fluoride-co-hexafluoropropylene), P(VDF-co-HFP), as a ferroelectric host matrix and high-permittivity BaTiO3 nanoparticles as an inorganic filler, which exhibited an extractable energy density of 3.2 J cm−3 at a field strength of 164 V μm−1 with a nanoparticle volume fraction of 50%.9 Although the fabrication of reasonably uniform nanocomposite thin films was demonstrated via the surface modification of BaTiO3 nanoparticles with phosphonic acid ligands, the energy density of the nanocomposite films was compromised as a result of the decrease of EB, for nanoparticle loadings above 10–20%. The reduced EB has been generally attributed to an increase in porosity, the enhancement of the local electric field in host material, and aggregation of nanoparticles.

The effect of processing method on the physical properties of thin films and their associated device performance has been an extensively studied topic in solution-processed thin-film electronics such as transistors, photovoltaics, and dielectrics.10,11 In the fabrication of nanocomposite films bearing nano-size fillers dispersed in a polymeric matrix via solution casting, the ordering and the packing of nano-fillers are known to depend largely on the processing method and variables such as solvent, shear rate, evaporation rate, substrate temperature, and annealing conditions. In particular, Mittal et al. reported the orientation of titanium dioxide nanoparticles along the direction of the coating flow via a fixed blade.12 Bodnarchuk et al. also demonstrated enhanced ordering of magnetic nanocrystals from colloidal suspension via blade casting.13 In this work they found that the ordering in films made by blade casting was greatly improved compared to the films fabricated by inkjet or drop casting. Given the fact that nanocomposite films for capacitors have usually been fabricated by spin casting or for thick films, drop casting followed by hot pressing, it is of great importance to investigate the effect of processing method on the performance of thin film capacitors.

In this work, we report on the fabrication of nanocomposite thin films via two independent processing methods, spin and blade casting, and a detailed study of their morphological, electronic and dielectric properties that are critical to the energy storage characteristics. To investigate the effect of processing method on the energy storage characteristics of thin film capacitors, we have chosen a nanocomposite model system containing 50% volume loading of BaTiO3 nanoparticles surface modified with pentafluorobenzyl-phosphonic acid (PFBPA) in P(VDF-co-HFP) matrix, which exhibited the largest extractable energy density in our previous report.9 Additionally, to examine the effect of nanoparticle size on the extractable energy density and efficiency, nanocomposites consisting of PFBPA modified 50 or 120 nm BaTiO3 particles (PFBPA-BT) have been prepared and compared as to their processing via blade vs. spin coating methods. Dielectric characterization of all fabricated films included relative permittivity, loss tangent, electrical breakdown strength, Weibull statistics, extractable energy density and extraction efficiency. The extractable energy densities of blade-cast films show at least a two-fold increase compared to spin-cast films, establishing the significance of processing method as a means to improve the energy storage capability of thin film nanocomposite capacitors.

2. Results and discussion

2.1 Surface modification of BaTiO3 nanoparticles

Nanoparticles easily form aggregates because of their high surface energy and large surface area if they are not stabilized properly in a polymer matrix. Once formed, nanoparticle aggregates in a polymer matrix significantly compromise the quality of nanocomposite films. We have previously shown that PFBPA stabilized BT particles in a ferroelectric polymeric host, P(VDF-co-HFP), resulted in nanocomposite films that exhibited a homogeneous microstructure up to 50% of nanoparticle volume loading.9,14

Surface modification of BT by PFBPA was confirmed by the FT-IR spectrum (see Fig. S1 in the ESI). Both 50 nm and 120 nm of BT nanoparticles bearing PFBPA ligands show C–F stretching mode from PFBPA at around 1125 cm−1 and characteristic peaks of P–O–M (M stands for Ti or Ba) stretching modes at around 1045 and 1095 cm−1.9 The surface coverage of organic ligands on nanoparticles was determined by the weight loss of nanoparticles via thermogravimetric analysis. In this way, the surface coverage of PFBPA on 50 nm and 120 nm BT nanoparticles was determined to be 92% and 125% of theoretical monolayers, respectively (Fig. S2), assuming the footprint of each phosphonic acid head group as 24 Å2.15 The decomposition of PFBPA mainly occurred at temperatures ranging from 450 °C to 500 °C on both BT nanoparticles.

2.2 Dielectric properties of nanocomposite films

The frequency dependent permittivity and loss tangent of PFBPA-BT/P(VDF-co-HFP) nanocomposite films containing either 50 nm or 120 nm BT nanoparticles, prepared by spin and blade casting are compared in Fig. S3. Because of the large permittivity of 120 nm BT nanoparticles, nanocomposites containing 120 nm BT nanoparticles (shown in red) exhibit higher effective relative permittivity of 40 (at 1 kHz) than 50 nm BT nanocomposites (30 at 1 kHz). It was also observed that both the permittivity and loss tangent over the frequency range (100 to 1 MHz) were independent of processing method, i.e., blade or spin casting. Fig. S4 summarizes the permittivities and thicknesses of all four sets of nanocomposite films including their standard deviations (1σ). For convenience we denote the 50 nm BT nanocomposite film prepared by blade casting as BT50b (BT120s indicates 120 nm BT nanocomposite film prepared by spin coating). Thicknesses of all four sets of nanocomposite films were in the range of 3 ± 0.5 μm, in order to minimize the influence of thickness on the breakdown strength of dielectric films.16

The EB values of nanocomposite films were determined and analyzed by using Weibull analysis, which has been discussed in detail elsewhere.9,17 Briefly, the cumulative failure probability distribution (PF) is expressed by the equation below:

 
PF(E) = 1 − exp[−{(Eγ)/α}β](1)
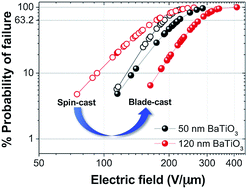
where, E is the applied electric field, α is the scale parameter, β is the shape parameter or Weibull modulus, which represents the dispersion of EB, and γ is the electric field below which no observable failure occurs. In this study, γ was set to zero. The cumulative probability of failure (% CDF) in nanocomposite films is shown in Fig. S5 as a function of electric field. The slope of % CDF is the Weibull modulus, β, and the characteristic breakdown strength, EB, is defined as the electric field at which the failure probability is 63.2%.

Fig. 1 summarizes the EB and β of the nanocomposite films, which were determined from the Weibull analysis as shown in Fig. S5. Blade-cast nanocomposite films with both 50 and 120 nm BT particles show an increase in EB compared to that of spin-cast films. The enhancement of EBvia blade casting is more dramatic in 120 nm BT nanocomposites, which showed an increase of 60%. This gain is attributed to the improved morphology, a more uniform distribution of nanoparticles, reduced surface roughness of thin films, and larger crystalline domains in blade-cast films as will be discussed below. Although the Weibull modulus of the nanocomposite films does not follow the same trend that was observed for EB, β of blade-cast 120 nm BT nanocomposites does exhibit a moderate increase.


image file: c4ra00987h-f1.tif
Fig. 1 Breakdown strength (EB) and Weibull modulus, β, of nanocomposite films containing 50 and 120 nm BT particles with a volume loading of 50%, fabricated by either blade or spin casting. The error bars of breakdown strength were obtained from measurements of at least 15 devices. The Weibull modulus β and its error bar were determined by Weibull analysis.

2.3 Morphology of nanocomposite films

In the nanocomposite approach to improving properties of materials such as permittivity, breakdown strength, and processibility, the interface between nanoparticles and a polymer matrix plays a pivotal role in determining the success of this approach.18–21 Interfaces in dielectric nanocomposites consisting of oxide nanoparticles and a polymeric matrix can be largely governed by the dispersion of the nanoparticles in a matrix. In our earlier reports, BT nanoparticles were successfully stabilized and homogeneously dispersed in P(VDF-co-HFP) matrix by employing PFBPA surface modifier.9,14 Not only the homogeneity but also the overall morphology of the nanocomposite was greatly improved by the treatment of interfaces between BT nanoparticles and P(VDF-co-HFP).

In addition to the improved interfaces via the surface treatment of BT nanoparticles, in this paper we investigate the distribution of BT nanoparticles in P(VDF-co-HFP) via different fabrication methods, i.e., blade vs. spin casting. Blade casting utilizes shear force exerted by a blade in motion, which is beneficial for the distribution of nanoparticles in a matrix. In addition, the lower rate of solvent evaporation in blade casting, as compared to spin coating, may allow sufficient time for evaporation without the formation of air voids in the film, which is a problem for highly filled nanocomposite films formed by spin coating. Previous experimental results also showed better ordering of particles in thin films via blade casting.12,13,22

The homogeneous distribution of surface-modified BT nanoparticles in the P(VDF-co-HFP) matrix is confirmed by the energy dispersive spectroscopy (EDS) data and the element maps of phosphorous, fluorine, Ba and Ti, which are shown in Fig. S6 and S7.Fig. 2 and S8 show the cross-sectional SEM images of nanocomposite films prepared via spin and blade casting. Nanocomposite films with the same size of BT particles were displayed next to each other to compare the effect of processing method on the distribution of nanoparticles and morphology of thin films. Compared to spin-coated films, blade-cast films show a denser microstructure, which is evidenced by a lower number density of voids. The reduction of porosity in blade-cast films can be correlated to the improved breakdown strength and its statistics because of the lower probability of porosity-induced breakdown events as the density of voids and percolation of nanoparticles are lowered.9 It is also notable that the enhancement of the crystalline morphology via blade casting is more pronounced in 120 nm BT nanocomposites.


image file: c4ra00987h-f2.tif
Fig. 2 High-magnification cross-sectional SEM images of BT/P(VDF-co-HFP) nanocomposite films containing 50 and 120 nm BT particles with a volume loading of 50%, fabricated via spin or blade casting: BT50s (top left), BT50b (top right), BT120s (bottom left), and BT120b (bottom right). (scale bar 1 μm).

The AFM images of the nanocomposite thin films are shown in Fig. S9 and their RMS roughness and standard deviation values are summarized in Table 1. Although nanocomposite films containing 50 nm BT nanoparticles only indicate marginal improvement in surface roughness, the surface of 120 nm BT nanocomposites is greatly planarized by blade casting, leading to the reduction of surface roughness from 340 to 63 nm. The improved uniformity of film surface can be ascribed to a more uniform distribution of nanoparticles under blade casting, consistent with the cross-sectional SEM images of the films. The smoother surface in blade-cast films could suppress the development of non-uniform electric fields induced by surface topography and associated premature electrical breakdown events, which likely contributes to the observed enhancement of breakdown strength in blade-cast films.

Table 1 Surface roughness and its standard deviation of BT/P(VDF-co-HFP) nanocomposite films from AFM images
  50 nm BT, spin-coated 50 nm BT, blade-cast 120 nm BT, spin-coated 120 nm BT, blade-cast
RMS roughness (nm) 62 ± 6 50 ± 3 340 ± 62 63 ± 17


X-ray diffractograms of nanocomposite films prepared by spin or blade casting are shown in Fig. 3a. The incorporation of BT nanoparticles in polymer matrix resulted in the suppression of peaks from PVDF crystals such as α and β phases, which actually appear at 18 to 20° in neat P(VDF-co-HFP) films in Fig. 3b.23–25 Instead, a broad peak appears at two theta of 5.2° only in blade-cast nanocomposite films for both BT50 and BT120 (sharp peaks denoted by stars are from BT crystals), which is not seen in neat polymer films. It should be noted that XRD pattern of neat polymer film by blade casting in Fig. 3b shows much stronger peaks of PVDF crystallites at 18 and 20° whereas spin-coated film exhibits only a trace of them (sharp peaks denoted by stars are from ITO substrate). We attribute this difference to the lower rate of solvent evaporation in blade casting that may provide sufficient time for nucleation and growth of crystallites, thus possibly facilitating the formation of large crystalline domains, in contrast to the effect of rapid solvent evaporation in the case of spin coating. In this context, although the d-spacing of the broad peak in the blade-cast nanocomposite films is assigned as 1.7 nm, which is different than that of ordinary PVDF crystallites, we speculate that blade-cast nanocomposite films have crystalline domains, which maintain long range order that is more uniform in terms of size and distribution, as compared to those of the spin-coated nanocomposite films. Further investigation of broad peaks at 5.2° using the Scherrer equation reveals that the sizes of crystallites in blade-cast films are bigger than in spin-coated films (summarized in Table S1). We believe that the increase of EB in the blade-cast films can be attributed to the larger crystallite size because the probability of breakdown events across the boundary of crystalline domains would be reduced.26–28 It is also expected that the larger crystallites would act as charge trapping and scattering centers that can impede the transport of charge carriers, thus mitigating premature dielectric breakdown of nanocomposite films.9,29


image file: c4ra00987h-f3.tif
Fig. 3 X-ray diffractogram of (a) BT/P(VDF-co-HFP) nanocomposite films, (b) neat P(VDF-co-HFP) films prepared by spin or blade casting methods (stars denote peaks from (a) BaTiO3 for (001) and (100) at 22°, (101) and (110) at 31.5°, and (111) at 39°; (b) from ITO for (211) at 21.5°, (222) at 30.5°, and (400) at 35.5°). Number in the legend of (a) denotes the size of BT particles used, followed by an alphabet indicating film preparation method (i.e. BT50b for 50 nm BT nanocomposite film prepared by blade casting).

2.4 Energy storage characteristics of nanocomposite films

To determine the maximum extractable energy density (Umax) of nanocomposite thin films, we have performed charge–discharge (C–D) and polarization–electric field (P–E) measurements, which were conducted under pulsed and ramped field conditions, respectively. As shown in Fig. 4, blade-cast nanocomposite films consisting of 50 nm BT give UCDmax and UPEmax (maximum extractable energy densities from C–D and P–E, respectively) values of ∼7 J cm−3, which are nearly twice larger than those of spin-cast films. The Umax for nanocomposite films bearing 120 nm BT is also increased from 2.5 to 4.5 J cm−3 and 1.5 to 5.5 J cm−3 from C–D and P–E methods, respectively. Although the field strength at which the maximum energy density, Umax, is obtained is different, Umax of nanocomposite films does not show a significant dependence on the measurement method (C–D or P–E) for the same batch of nanocomposite films, i.e., the same size of BT and the same processing method used. We attribute this difference to the longer charging time for C–D measurements, which is around a few hundred milliseconds. The lower breakdown strength of nanocomposite films in C–D can also be explained by larger electrical stress when the dielectric film is subjected to a pulsed electric field.
image file: c4ra00987h-f4.tif
Fig. 4 Extractable energy densities of BT/P(VDF-co-HFP) nanocomposite films determined from (a) charge–discharge (C–D) and (b) polarization–electric field (P–E) methods. The error bars represent the standard deviations (1σ) of extractable energy density.

The enhancement of Umax in blade-cast nanocomposite films (for both 50 and 120 nm BT particles) is primarily due to the increased breakdown strength, which was shown earlier in Fig. 1. It is interesting to note that Umax of nanocomposite films are limited mainly by the breakdown strength of the films in the C–D measurement. In P–E method, however, nanocomposite films containing 120 nm BT particles yielded higher UPEmax than the 50 nm BT nanocomposites throughout the range of electric fields investigated in this study (shown in Fig. 4b). It should be noted that the enhancement of UPEmax in nanocomposite films of 120 nm BT particles is only observed in blade-cast films and not in spin-coated films. We believe that the very large RMS roughness (340 nm) of spin-cast films with 120 nm BT negates any enhancement.

The effect of BT nanoparticle size on the energy density of nanocomposite films is further investigated by comparing P–E loops of blade-cast films. In general, the crystal structure of BT nanoparticles transforms from cubic to tetragonal when the size of BT increases, providing greater relative permittivity due to the spontaneous polarization from the displacement of Ti ions.30,31 In Fig. S10, the slope of P–E loops, which is proportional to the permittivity of a dielectric material,32 in nanocomposite films with 120 nm BT is steeper than films with 50 nm BT, suggesting an increased tetragonal phase content of the BT particles incorporated into the polymeric matrix. Although higher permittivity leads to larger UPEmax in nanocomposites with 120 nm BT, the lower breakdown strength limits UPEmax to 5.5 J cm−3 at 240 V μm−1, which is still 10% higher than nanocomposites with 50 nm BT at the same field strength. The P–E loop of neat P(VDF-co-HFP) film is also laid out to show the effect of BT incorporation on the ferroelectric response of nanocomposite films.

Additional P–E loops of nanocomposite films of both 50 nm and 120 nm BT particles are presented in Fig. S11. The overall shape of P–E loops is similar in that the loops become wider as electric field increases, which is also reflected in the reduced energy extraction efficiency shown in Fig. S12. The extraction efficiency decreases to 60% at ∼150 V μm−1, for both spin- and blade-cast films, and the blade-cast films consistently show extended performance to higher fields, while the extraction efficiency is reduced and the P–E loops widened. The widening of P–E loops, which is directly related to the reduction in extraction efficiency, is attributed to charge injection and/or conduction in these dielectric films.32 This trend discussed above suggests that blade-cast films are more resistant to injection/conduction-induced catastrophic breakdown, which we attribute to the reduced porosity, the more uniform distribution of nanoparticles, and larger crystalline domains in blade-cast films. Finally, it is worth noting that blade casting and related processing methods are quite scalable for the fabrication of large area nanocomposite dielectric thin films.

3. Conclusions

We have shown that the blade-cast thin films obtained from nanocomposite solutions consisting of surface-modified BT nanoparticles in P(VDF-co-HFP) yield an extractable energy density of ∼7 J cm−3, which is larger by a factor of two relative to spin-coated films. The improvement of extractable energy density is associated primarily with the increase of the dielectric breakdown strength, which is attributed to reduced porosity, a more uniform distribution of nanoparticles, and larger crystalline domains obtained via blade casting. Nanocomposite films with 120 nm BT nanoparticles lead to higher permittivity but the maximum energy density is compromised by the reduced breakdown strength of these films. The increased breakdown strength and extractable energy density in blade-cast thin film capacitors suggests the utility of blade casting of films for dielectric energy storage and pulsed power applications, as well as in solution processed thin-film electronics as a methodology of film fabrication.

4. Experimental

4.1 Surface modification and characterization of 50 and 120 nm BaTiO3 nanoparticles

Chemicals and raw materials used here were obtained from the following commercial sources and used as received: 2,3,4,5,6-pentafluorobenzylphosphonic acid (PFBPA, Sigma-Aldrich), BaTiO3 (BT, 50 nm average diameter nanopowder, Sigma-Aldrich; 120–150 nm, Cabot corp.), poly(vinylidene fluoride-co-hexafluoropropylene) (P(VDF-co-HFP), Sigma-Aldrich). All the solvents were reagent grade and used without further purification. Surface modification of BT was performed using a method reported previously.9 Fourier transform infrared (FT-IR, Perkin-Elmer Spectrum 1000) spectra of surface-modified BT nanoparticles were taken using the KBr pellet method with a resolution of 2 cm−1. Thermogravimetric analysis (Q50, TA Instruments) was conducted to determine the surface coverage of PFBPA on BT.

4.2 Processing and characterization of nanocomposite films

BT/P(VDF-co-HFP) nanocomposites were prepared by ball-milling of PFBPA-BT in N,N-dimethylformamide for two days followed by additional ball-milling with P(VDF-co-HFP) for ten days. Yttria-stabilized zirconia ceramic particles of different diameter were used as grinding media to break up agglomerates, as well as to prevent the aggregation of nanoparticles. Nanocomposite thin films were fabricated from the resultant solutions by either spin or blade casting on aluminum-coated glass substrates (Newport Thin Film Laboratory) that were used as the bottom electrode. Prior to the casting, all substrates were cleaned by ultrasonication with acetone followed by similar treatment with isopropyl alcohol and then treated with cold plasma at 750 W for 10 minutes. A spin coater (Laurell WS-400B-8NPP/Lite) and manual film applicator (Elcometer 3580) with a speed of ∼5 cm s−1 were used to fabricate spin- and blade-cast films, respectively. Fabricated thin films were soft-baked on a hot plate at 80 °C for a few minutes followed by overnight drying at 120 °C in vacuo. The thickness of the films after drying was determined by using a surface profilometer (Dektak 6M, Veeco). Top-surface and cross-sectional images as well as EDX analysis were obtained by field-emission scanning electron microscope (Zeiss Ultra60) on samples with a sputtered gold coating. To minimize the structural change in cross-sectional samples, all samples were freeze-fractured in liquid nitrogen. The surface morphology of the films was also measured by an atomic force microscope (Digital Instrument Nanoscope IIIa – Dimension 3000). Room temperature wide angle X-ray diffraction patterns were obtained on neat polymer and nanocomposite films using X-ray source with λ = 0.154 nm (PANalytical, X'Pert PRO Alpha-1).

4.3 Device fabrication and characterization of dielectric properties

Parallel-plate capacitors were produced by depositing circular Al top electrodes (480 nm thick and areas of 0.25 and 1.0 mm2) on top of nanocomposite thin films using a thermal evaporator (PVD75, Kurt J. Lesker) through a shadow mask at a deposition rate of 3 Å s−1. The frequency-dependent capacitance and loss tangent of capacitors were measured from 100 Hz to 1 MHz at 1 Vrms by using an LCR meter (Agilent 4284A). The dielectric breakdown strength was measured inside a glove box (Labmaster 130, M. Braun) using a probe station (H-100 Signatone) equipped with a micromanipulator, a microscope and a high-voltage power supply (Keithley 248). Breakdown testing was performed by ramping the applied voltage from 50 V (DC) at a rate of 10 V s−1 until a catastrophic breakdown occurred, which was indicated by a rapid increase in leakage current to over 20 μA. The electrode area of 0.25 mm2 was used for breakdown testing and at least 20 devices were tested to provide average and standard deviation of EB.

4.4 Measurement of extractable energy densities

Energy densities of the devices were measured by the pulsed charge–discharge (C–D) and electric field dependent polarization (P–E) methods. In the pulsed C–D method a voltage pulse with a rise time of ∼0.5 ms and an ∼1 s hold time under various electric fields were employed. The polarization–electric field (P–E) experiments were performed using a home-built modified Sawyer–Tower circuit controlled by LabVIEW. For both measurements, samples with the electrode area of 1 mm2 were subjected to voltages up to 2 kV provided by a high voltage amplifier (Trek 610-D). For the P–E method, a unipolar sine waveform with a period of 0.01 s was used, and induced charges on a sample were measured using a charge integrator circuit. Since all samples were tested under ambient conditions, special care was taken to maintain appropriate distances (>1 cm) between probes and cablings to avoid a flash-over.

Acknowledgements

This work was supported by the Office of Naval Research Capacitor Program (Grant no.: N000141110462). The authors thank Prof. Kippelen for use of a profilometer and dielectric spectroscopy instruments. O'Neil Smith and Yunsang Kim thank the Center for Organic Photonics and Electronics for a COPE Fellowship.

Notes and references

  1. J. B. Goodenough, H. D. Abruna and M. V. Buchanan, Basic Research Needs for Electrical Energy Storage. Report of the Basic Energy Sciences Workshop on Electrical Energy Storage, April 2–4, 2007, Report DOE/SC/BES-0702, U.S. Department of Energy (DOE) Office of Science (SC), 2007 Search PubMed.
  2. R. Kötz and M. Carlen, Electrochim. Acta, 2000, 45, 2483–2498 CrossRef.
  3. M. S. Whittingham, MRS Bull., 2008, 33, 411–419 CrossRef CAS.
  4. W. J. Sarjeant, J. Zirnheld and F. W. MacDougall, IEEE Trans. Plasma Sci., 1998, 26, 1368–1392 CrossRef CAS.
  5. B. Chu, X. Zhou, K. Ren, B. Neese, M. Lin, Q. Wang, F. Bauer and Q. M. Zhang, Science, 2006, 313, 334–336 CrossRef CAS PubMed.
  6. P. Barber, S. Balasubramanian, Y. Anguchamy, S. Gong, A. Wibowo, H. Gao, H. J. Ploehn and H.-C. zur Loye, Materials, 2009, 2, 1697–1733 CrossRef CAS PubMed.
  7. Q. Wang and L. Zhu, J. Polym. Sci., Part B: Polym. Phys., 2011, 49, 1421–1429 CrossRef CAS.
  8. Z.-M. Dang, J.-K. Yuan, J.-W. Zha, T. Zhou, S.-T. Li and G.-H. Hu, Prog. Mater. Sci., 2012, 57, 660–723 CrossRef CAS PubMed.
  9. P. Kim, N. M. Doss, J. P. Tillotson, P. J. Hotchkiss, M.-J. Pan, S. R. Marder, J. Li, J. P. Calame and J. W. Perry, ACS Nano, 2009, 3, 2581–2592 CrossRef CAS PubMed.
  10. F. C. Krebs, Sol. Energy Mater. Sol. Cells, 2009, 93, 394–412 CrossRef CAS PubMed.
  11. J. Peet, M. L. Senatore, A. J. Heeger and G. C. Bazan, Adv. Mater., 2009, 21, 1521–1527 CrossRef CAS.
  12. M. Mittal, R. K. Niles and E. M. Furst, Nanoscale, 2010, 2, 2237–2243 RSC.
  13. M. I. Bodnarchuk, M. V. Kovalenko, S. Pichler, G. Fritz-Popovski, G. n. Hesser and W. Heiss, ACS Nano, 2011, 4, 423–431 CrossRef PubMed.
  14. P. Kim, S. C. Jones, P. J. Hotchkiss, J. N. Haddock, B. Kippelen, S. R. Marder and J. W. Perry, Adv. Mater., 2007, 19, 1001–1005 CrossRef CAS.
  15. W. Gao, L. Dickinson, C. Grozinger, F. G. Morin and L. Reven, Langmuir, 1996, 12, 6429–6435 CrossRef CAS.
  16. H. K. Kim and F. G. Shi, IEEE Trans. Dielectr. Electr. Insul., 2001, 8, 248–252 CrossRef CAS.
  17. Y. Kim, M. Kathaperumal, O. N. L. Smith, M.-J. Pan, Y. Cai, K. H. Sandhage and J. W. Perry, ACS Appl. Mater. Interfaces, 2013, 5, 1544–1547 CAS.
  18. T. J. Lewis, IEEE Trans. Dielectr. Electr. Insul., 1994, 1, 812–825 CrossRef CAS.
  19. T. J. Lewis, J. Phys. D: Appl. Phys., 2005, 38, 202–212 CrossRef CAS.
  20. M. Roy, J. K. Nelson, R. K. MacCrone, L. S. Schadler, C. W. Reed, R. Keefe and W. Zenger, IEEE Trans. Dielectr. Electr. Insul., 2005, 12, 629–643 CrossRef CAS.
  21. T. Tanaka, M. Kozako, N. Fuse and Y. Ohki, IEEE Trans. Dielectr. Electr. Insul., 2005, 12, 669–681 CrossRef CAS.
  22. H. Watanabe, T. Kimura and T. Yamaguchi, J. Am. Ceram. Soc., 1989, 72, 289–293 CrossRef CAS PubMed.
  23. K. M. Kim, N.-G. Park, K. S. Ryu and S. H. Chang, Polymer, 2002, 43, 3951–3957 CrossRef CAS.
  24. J. Buckley, P. Cebe, D. Cherdack, J. Crawford, B. S. Ince, M. Jenkins, J. Pan, M. Reveley, N. Washington and N. Wolchover, Polymer, 2006, 47, 2411–2422 CrossRef CAS PubMed.
  25. W. Li, Q. Meng, Y. Zheng, Z. Zhang, W. Xia and Z. Xu, Appl. Phys. Lett., 2010, 96, 192905 CrossRef PubMed.
  26. K. Kitagawa, G. Sawa and M. Ieda, Jpn. J. Appl. Phys., 1980, 19, 389–390 CrossRef CAS.
  27. M. Ieda, IEEE Trans. Electr. Insul., 1980, EI-15, 206–224 CrossRef CAS.
  28. M. Ieda, IEEE Trans. Electr. Insul., 1984, EI-19, 162–178 CrossRef CAS.
  29. T. Tanaka, IEEE Trans. Dielectr. Electr. Insul., 2005, 12, 914–928 CrossRef CAS.
  30. M. Frey and D. Payne, Phys. Rev. B: Condens. Matter Mater. Phys., 1996, 54, 3158–3168 CrossRef CAS.
  31. M. B. Smith, K. Page, T. Siegrist, P. L. Redmond, E. C. Walter, R. Seshadri, L. E. Brus and M. L. Steigerwald, J. Am. Chem. Soc., 2008, 130, 6955–6963 CrossRef CAS PubMed.
  32. IEEE Standard Definitions of Primary Ferroelectric Terms 180-1986, IEEE, New York, 1986 Search PubMed.

Footnote

Electronic supplementary information (ESI) available. See DOI: 10.1039/c4ra00987h

This journal is © The Royal Society of Chemistry 2014
Click here to see how this site uses Cookies. View our privacy policy here.