Trap states in chemically derived graphene oxide revealed by anomalous temperature-dependent photoluminescence

Haiping He*, Hui Li, Tairan Zhang, Luwei Sun* and Zhizhen Ye
State Key Laboratory of Silicon Materials, Department of Materials Science and Engineering, Zhejiang University, Hangzhou, 310027, People's Republic of China. E-mail: hphe@zju.edu.cn; dasbrot@zju.edu.cn; Tel: +86-571-87953139

Received 29th January 2014 , Accepted 2nd April 2014

First published on 2nd April 2014


Abstract

We carry out a comprehensive temperature-dependent photoluminescence (PL) study on chemically derived graphene oxide (GO) sheets. According to the unusual temperature dependence, we introduce a trap state ∼114 meV beneath the LUMO, which implies an additional carrier decay process.
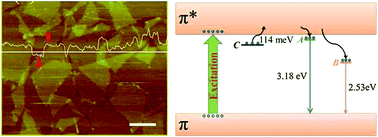

Graphene oxide (GO), as a chemical derivative of graphene, has raised intense interest from physics to chemistry.1 GO derives many excellent properties from graphene, and provides an alternative to flexible substrates,2 Langmuir–Blodgett films,3 chemical sensors,4 transparent electrodes,5 etc. Luminous carbon nanomaterials,6 considered as an alternative for conventional fluorescent quantum dots,7 have been highlighted due to their high bio-compatibility in favor of the applications in biology and medicine.8 GO, as a counterpart of carbon related materials, also has interesting photoluminescence (PL) features9 and has been employed in LED10 and lithography.11 Recently, PL from GO has been developed in ultraviolet (UV) and visible light range by several groups.12–15 A summary of PL from GO fabricated by various methods can be found in a recent review article.16 However, the origin of luminescence from GO is controversial so far.9,13,14,17–20 Chhowalla13 considers that sp2 clusters isolated by sp3 matrix in GO planes are likely responsible for the blue luminescence. Electron–hole recombination from the bottom of the conduction band and nearby localized states to wide-range valance band is suggested as origin of the PL in GO in the view of atomic structure.17 Galande et al.18 proposed that PL in GO arises from quasi-molecular fluorophores. Free zigzag sites with carbene-like triplet ground states are also theoretically anticipated19 and experimentally confirmed20 as a candidate for photon emission from chemically derived GO. The competition between both the defect state emission and intrinsic state emission is considered as the PL mechanism and intensively explored by Yang's group.21 Chien et al. suggested that disorder-induced localized states are the origin of PL.14 Chemical reduction is also thought to be responsible for the PL.22

Clarification of the luminescence mechanism is crucial to the understanding and facile modulation of GO's optoelectronic properties, and will significantly promote the application of graphene-based materials. Therefore, further studies should be carried out to elucidate detailed explanations of the mechanisms of such variable emissions. However, sometimes room temperature PL measurements are not adequate because of the marked influence of temperature-sensitive effects, e.g., electron–phonon coupling, which usually make the transition processes much more complicated. In semiconductors, it is well known that temperature-dependent PL may offer much useful information for the luminescence mechanism. The temperature evolution of the lineshape, peak energy, and intensity of PL bands will be helpful to understand the nature and kinetic of radiative transitions. However, temperature-dependent PL of GO is so far rather scarcely investigated23 compared with its counterparts, such as carbon nanotubes (CNT).24–26

In this communication, comprehensive temperature-dependent PL studies on chemically derived GO sheets were carried out. We found that the emissions of GO exhibit anomalous temperature dependence known as the negative thermal quenching (NTQ). Based on a multi-level model for NTQ, a trap state was introduced in to clarify the entire PL scenario of our GO sample. We attribute the PL bands at 3.18 and 2.53 eV to excitons in sp2 clusters and disorder-induced localized states, respectively. Our results provide a profound understanding for the origin of the GO PL, and are helpful to realize tunable photon emission for future optoelectronic applications.

GO was synthesized from natural graphite powder by a modified Hummers method followed by a series of purification treatments.27 Fig. 1a shows AFM image of the as-synthesized GO. The thickness is measured to be about 1.1 nm, indicating that they are single-layer GO sheets.28 Raman scattering spectra,29 as shown in Fig. 1b and c, exhibit significant structure changes during the oxidation processing from graphite powder (Fig. 1b) to GO (Fig. 1c). The graphite powder shows a prominent G peak at 1580 cm−1 in correspondence to the first-order scattering of the E2g mode and a weak D band at 1350 cm−1 attributed to the second order of zone-boundary phonons in defected graphite. Raman spectrum of GO sheets shows that the G band is broadened26 and the intensity of D band is significantly enhanced, indicating the decrease in size of the in-plane sp2 domains.


image file: c4ra00847b-f1.tif
Fig. 1 (a) AFM topologic image of as-prepared GO sheets. A typical sheet is used for thickness measurement as marked with a couple of red triangles. The scale bar is 500 nm. A thickness profile of a typical GO sheet is also shown. (b and c) Comparison of Raman spectra of graphite powder (b) and GO (c) sheets. (d) XPS C 1s core level spectrum from a solid GO sheet aggregate. Three peaks, representing C[double bond, length as m-dash]C (cyan), C–O (pink) and C[double bond, length as m-dash]O (khaki) bonds, are fitting with Gaussian-shape function. (e) FTIR spectra of GO sheets. (f) UV-vis spectrum of colloidal GO suspension.

XPS measurements were carried out to probe oxygen-containing functional groups in GO sheets. C1s core level spectrum of the as-synthesized GO (Fig. 1d) clearly shows the presence of three types of carbon-related bonds. The peaks at 284.6 eV, 286.7 eV and 288.1 eV are designated to C[double bond, length as m-dash]C, C–O and C[double bond, length as m-dash]O bonds, respectively. FTIR provides additional verification of oxygen-containing functional groups in GO sheets. Compared with pristine graphite, the FTIR spectrum (Fig. 1e) of the as-synthesized GO exhibits a pronounced peak at 1730 cm−1 for C[double bond, length as m-dash]O vibration mode in carboxyl groups, and C–O related modes at 1200 and 1055 cm−1. The presence of oxygen-containing functional groups is also indicated by thermal gravimetric (TG) analysis (Fig. S1). In the UV-vis spectrum (Fig. 1f), the peak around 240 nm was attributed to π–π* transitions of C[double bond, length as m-dash]C in as-synthesized GO, while the shoulder around 310 nm may be attributed to n–π* transition of C[double bond, length as m-dash]O.

Room temperature PL spectrum (Fig. S2) shows only a symmetric and broad band centered at about 2.5 eV. Li et al.30 proposed that the functional groups present in chemically derived GO sheets are responsible for the PL peaks. They suggested that three “fingerprinting” PL peaks (around 484 nm, 532 nm and 635 nm) originate from the σ*–n, π*–π and π*–n electronic transitions that are associated with the C–OH, the aromatic C[double bond, length as m-dash]C and the C[double bond, length as m-dash]O functional groups, respectively. From their point of view and according to the XPS and FTIR results, our PL seems to agree with the C[double bond, length as m-dash]C & C–O related emission. However, the 635 nm emission for C[double bond, length as m-dash]O is not observed in our samples. We also note that their suggestion is not so universal or versatile when comes to many other chemically derived GO. For example, in a recent literature,17 the XPS of chemically derived GO is dominated by C[double bond, length as m-dash]C&C–C and C–O. However, the PL emission around 500 nm was not observed. To obtain more information for the PL mechanism, temperature-dependent PL is carried out from 13 K to room temperature. Five typical PL spectra recorded at 13, 150, 200, 240 and 300 K, are shown in Fig. 2a–e, respectively. At 13 K (Fig. 2a), we observe two pronounced PL bands centered at 3.18 eV and 2.53 eV, respectively. For simplicity, we call the band centered at 3.18 eV as band A, and at 2.53 eV as band B. At higher temperatures, band A becomes gradually less pronounced while band B dominates ultimately the PL (Fig. 2f). The evolution of PL with temperature suggests the competition between the two bands.


image file: c4ra00847b-f2.tif
Fig. 2 PL spectra of as-prepared GO sheets. (a–e) Five typical PL spectra of GO deposited films at 13 K (a), 140 K (b), 180 K (c), 240 K (d) and 300 K (e), respectively. Two Gaussian lines (green) are employed to fit the PL spectra, as typically demonstrated in (a). The emission around 390 and 490 nm are denoted as A and B, respectively. (f) Histogram of temperature-dependent intensity weight of band A (green) and B (red) of GO sheets. (g) and (h) Detailed temperature-dependent evolution of PL intensity of GO sheets for band A (g) and B (h), respectively. Red curves are fitting results using eqn (1). The activation energies corresponding to each temperature range are marked out.

The integrated intensity of band A and B varying with temperature was also extracted and plotted in Fig. 2g. It shows a downward trend of the intensity of band A through the whole temperature range, except a slightly upward inclined plateau between 140 and 180 K. The peak energy of band A is red-shifted for ∼0.1 eV with temperature elevation (see Fig. S3). This behavior is reminiscent of the temperature-dependent bandgap shrinkage of semiconductors, suggesting the interband-like transition nature of band A. When amounts of defects strongly disturb the GO plane, electron hopping occurs among the sp2 clusters at lower temperatures regarding defect frozen effect. Based on the PL evolution and the pre-existing research results, we temporarily attribute band A to exciton hopping process among sp2 clusters.13

The emission from band A is pronounced below 140 K. With the temperature rising, stronger thermal vibration enhances exciton diffusion. The excitons localized at sp2 clusters may migrate toward sp3 defects just like that in CNT.31 The depopulation of electrons at sp2 clusters results in the PL quenching of band A. The intensity quenching above 180 K can be attributed to thermally activated nonradiative recombination which is common in semiconductors. However, these profiles cannot explain the slightly upward inclined plateau between 140 and 180 K.

Contrary to band A, band B is strongly suppressed at lower temperatures. We found that the intensity of band B remains almost constant below ∼150 K, and then a sharp rise is observed, the intensity reaches the peak at ∼240 K followed by a dramatic decrease (Fig. 2h). Noticeably, it exhibits a typical negative thermal quenching (NTQ), which is observed sometimes in the case of conventional semiconductors.32–34 The energy of band B remains almost constant within the whole temperature range. It implies that the band B emission comes from deeply localized states, which is very likely originated from sp3 defects within the π–π* gap. In ideal grapheme sheets, the sp2 bonds in polycyclic aromatic hydrocarbons (PAHs) graphite structure are composed of in-plane π–π* molecular orbits with an empty p orbit perpendicular to the PAHs basal plane. As to GO, the basal plane is attached by numerous oxygen-containing functional groups, which will bring great influence on the electron cloud and spatial geometrical configuration of the previously well-aligned carbon atoms, so except for the π–π* gaps created by the isolated sp2 clusters with different sizes, the disorder/distortion-induced localized states14 caused by the attachment of oxygen-containing functional groups are also critical to the optical properties of GO. The weight of band B is gradually going up until overwhelming the entire spectrum (Fig. 2f), indicating a transformation of the photon emission from sp2 clusters to defect states. With the temperature rising, stronger excitons diffusion from sp2 domains to sp3 sites leads to obvious decrease of the interband transition while enhancement of the defect emission. After 240 K, like the case of band A, thermally activated nonradiative recombination quenches the emission B.

Accordingly, we understand part of the PL process. However, the anomalous temperature dependence is yet unable to be well explained if state A and B are the only decay channels. We suggest that an extra state C is necessary to interpret the unusual temperature effect, and likely plays a critical role in thermally induced phonon scattering and carrier redistribution.

Generally, the nonradiative recombination rate increases rapidly with temperature due to the thermal activation of nonradiative centers, resulting in decreasing luminescence efficiency, known as thermal quenching. However, sometimes the opposite trend, i.e. NTQ, can be observed in a certain temperature range, which is due to the release of carriers from trap states. Such behavior has been reported in various semiconductors.32–34 Shibata32 has developed a multi-level model to describe the NTQ. According to this model, the temperature-dependent PL intensity can be expressed as

 
image file: c4ra00847b-t1.tif(1)
where I(T) and I(0) is the PL intensity at arbitrary temperature and absolute zero Kelvin, respectively. E is the activation energy, kB is the Boltzmann constant, and T is the temperature. In eqn (1), the Eq represents the activation energies for the processes that PL intensity increases with temperature, while the Ej describes the activation energies for the nonradiative channels. In such a model, the Eq denotes the energy level of state C. Accordingly, the activation energies, which are shown in Fig. 2g and h, are extracted in each corresponding temperature range. We focus on the energy of 114 meV for band A and 121 meV for band B at the temperature range corresponding to NTQ effect. The comparable energy indicates a transition of electrons from state C toward state A and B with close barrier. The slight difference of energies may be induced by the barrier for exciton diffusion from state A to state B. We then scale the state C with an energy about 114 meV beneath the LUMO. The other activation energies, 36 and 187 meV for band A and 295 meV for band B, are likely attributed to the nonradiative recombination channels.

One can find from above results and discussion that our results support the model proposed by Chien et al., namely, the PL bands at 3.18 and 2.53 eV originate from excitons in sp2 clusters and sp3 defect states, respectively. We now propose an improved model (Fig. 3) to schematically illustrate the entire PL processes including NTQ behavior. The excitation process with an energy of 5.39 eV corresponds to π–π* absorption bands. Two emission processes are responsible for band A (3.18 eV) and B (2.53 eV) in PL spectra. At lower temperatures, due to defect frozen effect, hopping mechanism among sp2 clusters dominates photon emission process, showing an interband PL transition (band A). Increasing the temperature aggravates an exciton migration from sp2 clusters to sp3 defect sites or disorder-induced localized states as we declare previously. A part of photo-excited electrons are trapped in state C at lower temperatures. With temperature increasing, the excitons within the sp2 clusters migrate towards the sp3 defect states and the severe nonradiative recombination at higher temperatures will decrease the PL intensity of band A, while the trapped electrons are thermally activated and can be scattered by phonons to LUMO then relax to state A, which will undoubtedly induces the PL enhancement of band A. The temporary overwhelming of the enhancing factor over the quenching factors results in the slightly upward inclined plateau between 140 and 180 K. As temperature being higher, the electrons relaxing from LUMO and scattered from state C have higher probability of migration to sp3 sites, which gives the emission at 2.53 eV. The noticeable NTQ of band B is caused by the dominant processes that the excitons diffuse from the sp2 clusters to the sp3 defect states and the trapped electrons in band C are thermally activated and eventually relax to state B. With the temperature rising, electrons populating in state B in combination with the activation of state C overwhelms the exciton density at state A, which leads to the dominant band B in the PL spectrum at higher temperatures. While above 240 K, nonradiative recombination channels govern the PL quenching both in band A and B, resulting in the PL intensity decrease of band B and even the completely vanishing of band A. Hence, anomalous temperature dependence of PL intensity can be well understood in terms of electron detrapping from state C and diffusion to state A and B by our model.


image file: c4ra00847b-f3.tif
Fig. 3 Schematic model proposed for the total PL behavior in our GO sheets. A trap state C with energy level of 114 meV below the LUMO, is introduced.

Conclusions

Comprehensive temperature-dependent PL is employed to probe luminescence properties of chemically derived GO. An emission band at 3.18 eV is found gradually pronounced with falling temperature. We attribute it to an interband transition among sp2 clusters by a hopping mechanism. The emission band at 2.53 eV is attributed to sp3 defect states, and its intensity undergoes a strong anomalous variation with temperature, i.e. NTQ. The introduction of an additional trap state ∼114 meV under the LUMO modulates the electron population at excited states. The improved model is applied to well explain the observed anomalous temperature dependence, which will help us understand the origin of PL in chemically derived GO and stimulate their applications in optoelectronic devices.

Acknowledgements

This work was supported by the Natural Science Foundation of China (no. 51372223), Program for Innovative Research Team in University of Ministry of Education of China (no. IRT13037), and the Science and Technology Department of Zhejiang Province (no. 2010R50020).

Notes and references

  1. K. S. Novoselov, V. I. Fal'ko, L. Colombo, P. R. Gellert, M. G. Schwab and K. Kim, Nature, 2012, 490, 192–200 CrossRef CAS PubMed.
  2. D. A. Dikin, S. Stankovich, E. J. Zimney, R. D. Piner, G. H. B. Dommett, G. Evmenenko, S. T. Nguyen and R. S. Ruoff, Nature, 2007, 448, 457–460 CrossRef CAS PubMed.
  3. L. J. Cote, F. Kim and J. Huang, J. Am. Chem. Soc., 2008, 131, 1043–1049 CrossRef PubMed.
  4. T. H. Han, Y. K. Huang, A. T. L. Tan, V. P. Dravid and J. Huang, J. Am. Chem. Soc., 2011, 133, 15264–15267 CrossRef CAS PubMed.
  5. G. Eda, G. Fanchini and M. Chhowalla, Nat. Nanotechnol., 2008, 3, 270–274 CrossRef CAS PubMed.
  6. S. N. Baker and G. A. Baker, Angew. Chem., Int. Ed., 2010, 49, 6726–6744 CrossRef CAS PubMed.
  7. F. M. Winnik and D. Maysinger, Acc. Chem. Res., 2012, 46, 672–680 CrossRef PubMed.
  8. (a) L. Cao, X. Wang, M. J. Meziani, F. Lu, H. Wang, P. G. Luo, Y. Lin, B. A. Harruff, L. M. Veca, D. Murray, S. Y. Xie and Y. P. Sun, J. Am. Chem. Soc., 2007, 129, 11318–11319 CrossRef CAS PubMed; (b) S. T. Yang, L. Cao, P. G. Luo, F. Lu, X. Wang, H. Wang, M. J. Meziani, Y. Liu, G. Qi and Y. P. Sun, J. Am. Chem. Soc., 2009, 131, 11308–11309 CrossRef CAS PubMed.
  9. K. P. Loh, Q. Bao, G. Eda and M. Chhowalla, Nat. Chem., 2010, 2, 1015–1024 CrossRef CAS PubMed.
  10. P. Kumar, L. S. Panchakarla, S. V. Bhat, U. Maitra, K. S. Subrahmanyam and C. N. R. Rao, Nanotechnology, 2010, 21, 385701 CrossRef PubMed.
  11. P. Kumar, K. S. Subrahmanyam and C. N. R. Rao, Mater. Express, 2011, 1, 252–256 CrossRef CAS PubMed.
  12. X. Sun, Z. Liu, K. Welsher, J. T. Robinson, A. Goodwin, S. Zaric and H. Dai, Nano Res., 2008, 1, 203–212 CrossRef CAS PubMed.
  13. G. Eda, Y. Y. Lin, C. Mattevi, H. Yamaguchi, H. A. Chen, I. S. Chen, C. W. Chen and M. Chhowalla, Adv. Mater., 2010, 22, 505–509 CrossRef CAS PubMed.
  14. C. T. Chien, S. S. Li, W. J. Lai, Y. C. Yeh, H. A. Chen, I. S. Chen, L. C. Chen, K. H. Chen, T. Nemoto, S. Isoda, M. Chen, T. Fujita, G. Eda, H. Yamaguchi, M. Chhowalla and C. W. Chen, Angew. Chem., Int. Ed., 2012, 51, 6662–6666 CrossRef CAS PubMed.
  15. L. Tang, R. Ji, X. Cao, J. Lin, H. Jiang, X. Li, K. S. Teng, C. M. Luk, S. Zeng, J. Hao and S. P. Lau, ACS Nano, 2012, 6, 5102–5110 CrossRef CAS PubMed.
  16. E. M. Narváez and A. Merkoçi, Adv. Mater., 2012, 24, 3298–3308 CrossRef PubMed.
  17. J. Shang, L. Ma, J. Li, W. Ai, T. Yu and G. G. Gurzadyan, Sci. Rep., 2012, 2, 792 Search PubMed.
  18. C. Galande, A. D. Mohite, A. V. Naumov, W. Gao, L. Ci, A. Ahayan, H. Gao, A. Srivastava, R. B. Weisman and P. M. Ajayan, Sci. Rep., 2011, 1, 85 Search PubMed.
  19. L. R. Radovic and B. Bockrath, J. Am. Chem. Soc., 2005, 127, 5917–5927 CrossRef CAS PubMed.
  20. D. Pan, J. Zhang, Z. Li and M. Wu, Adv. Mater., 2010, 22, 734–738 CrossRef CAS PubMed.
  21. S. Zhu, J. Zhang, S. Tang, C. Qiao, L. Wang, H. Wang, X. Liu, B. Li, Y. Li, W. Yu, X. Wang, H. Sun and B. Yang, Adv. Funct. Mater., 2012, 22, 4732–4740 CrossRef CAS.
  22. Z. Gan, S. Xiong, X. Wu, T. Xu, X. Zhu, X. Gan, J. Guo, J. Shen, L. Sun and P. K. Chu, Adv. Opt. Mater., 2013, 1, 926–932 CrossRef.
  23. T. V. Cuong, V. H. Pham, E. W. Shin, J. S. Chung, S. H. Hur, E. J. Kim, Q. T. Tran, H. H. Nguyen and P. A. Kohl, Appl. Phys. Lett., 2011, 99, 041905 CrossRef PubMed.
  24. J. Lefebvre, P. Finnie and Y. Homma, Phys. Rev. B: Condens. Matter Mater. Phys., 2004, 70, 045419 CrossRef.
  25. I. B. Mortimer and R. J. Nicholas, Phys. Rev. Lett., 2007, 98, 027404 CrossRef CAS.
  26. S. Berger, C. Voisin, G. Cassabois, C. Delalande, P. Roussignol and X. Marie, Nano Lett., 2007, 7, 398–402 CrossRef CAS PubMed.
  27. N. I. Kovtyukhova, P. J. Ollivier, B. R. Martin, T. E. Mallouk, S. A. Chizhik, E. V. Buzaneva and A. D. Gorchinskiy, Chem. Mater., 1999, 11, 771–778 CrossRef CAS.
  28. S. Stankovich, D. A. Dikin, R. D. Piner, K. A. Kohlhaas, A. Kleinhammes, Y. Jia, Y. Wu, S. T. Nguyen and R. S. Ruoff, Carbon, 2007, 45, 1558–1565 CrossRef CAS PubMed.
  29. A. C. Ferrari, J. C. Meyer, V. Scardaci, C. Casiraghi, M. Lazzeri, F. Mauri, S. Piscanec, D. Jiang, K. S. Novoselov and A. K. Geim, Phys. Rev. Lett., 2006, 97, 187401 CrossRef CAS.
  30. M. Li, S. K. Cushing, X. Zhou, S. Guo and N. Wu, J. Mater. Chem., 2012, 22, 23374–23379 RSC.
  31. (a) L. Cognet, D. A. Tsyboulski, J.-D. R. Rocha, C. D. Doyle, J. M. Tour and R. B. Weisman, Science, 2007, 16, 1465–1468 CrossRef PubMed; (b) L. Lüer, S. Hoseinkhani, D. Polli, J. Crochet, T. Hertel and G. Lanzani, Nat. Phys., 2009, 5, 54–58 CrossRef.
  32. H. Shibata, Jpn. J. Appl. Phys., 1998, 37, 550–553 CrossRef CAS.
  33. V. A. Fonoberov, K. A. Alim, A. A. Balandin, F. Xiu and J. Liu, Phys. Rev. B: Condens. Matter Mater. Phys., 2006, 73, 165317 CrossRef.
  34. H. P. He, Y. J. Wang, J. R. Wang and Z. Z. Ye, Phys. Chem. Chem. Phys., 2011, 13, 14902–14905 RSC.

Footnote

Electronic supplementary information (ESI) available: Preparation and characterization, TG, room temperature PL spectra and PL energy of band A varies with temperature. See DOI: 10.1039/c4ra00847b

This journal is © The Royal Society of Chemistry 2014
Click here to see how this site uses Cookies. View our privacy policy here.