Structure and dynamics of lysozyme in DMSO–water binary mixture: fluorescence correlation spectroscopy†
Shirsendu Ghosh,
Shyamtanu Chattoraj,
Rajdeep Chowdhury and
Kankan Bhattacharyya*
Department of Physical Chemistry, Indian Association for the Cultivation of Science, Jadavpur, Kolkata-700032, India. E-mail: pckb@iacs.res.in; Fax: +91-33-2473-2805
First published on 11th March 2014
Abstract
Proteins' structural stability and activity in aqueous–organic solvent mixtures is a fascinating topic of research in biochemistry. Here, the effect of dimethyl sulfoxide (DMSO) on the structure and conformational dynamics of lysozyme (labeled with alexa 488) is studied by fluorescence correlation spectroscopy (FCS). Circular dichroism and tryptophan emission indicate that DMSO molecules are accumulated around the tryptophan residues of lysozyme. According to the FCS data, the hydrodynamic radius (rH) of the protein increases steeply from 18 Å at 0 mol% DMSO to 33 Å at 5 mol% DMSO. This suggests unfolding of the protein on addition of DMSO. On addition of DMSO beyond 5 mol%, size of lysozyme gradually decreases until 30 mol% of DMSO, and increases thereafter. The rate constants (k+ and k−) of fast folding and unfolding dynamics (contact between alexa 488 and amino containing residues e.g. tryptophan) show a chevron like plot on increasing DMSO concentration which indicates a two state pathway of folding dynamics.
1. Introduction
Water is universally believed to be the most favorable solvent for biological systems and biological activity. However, in recent years, non-aqueous solvents particularly, binary mixtures have been explored as biological solvents in many experiments, theory and simulations.1–32 Among them the DMSO–water binary mixture has drawn major attention. Addition of DMSO to an aqueous solution of polymers and bio-molecules leads to interesting structural transitions. At low DMSO concentration, there is unfolding of protein which is followed by hydrophobic collapse (formation of a more compact structure because of interaction of hydrophobic residues with methyl groups) at higher concentration of DMSO.10–12 The methyl groups of DMSO participate in hydrophobic aggregation while the S![[double bond, length as m-dash]](https://www.rsc.org/images/entities/char_e001.gif) O can accept hydrogen-bond. Interaction of DMSO and water leads to several anomalies such as viscosity maximum at an intermediate concentration of DMSO.33,34 The actual experimental data indicates that viscosity maximum is at ∼35 mol% of DMSO.34 This is ascribed to the formation of a 2
O can accept hydrogen-bond. Interaction of DMSO and water leads to several anomalies such as viscosity maximum at an intermediate concentration of DMSO.33,34 The actual experimental data indicates that viscosity maximum is at ∼35 mol% of DMSO.34 This is ascribed to the formation of a 2![[thin space (1/6-em)]](https://www.rsc.org/images/entities/char_2009.gif) :1 (water:DMSO) association complex.33,34
:1 (water:DMSO) association complex.33,34
In this work, we study structure and dynamics of a small protein, lysozyme, in DMSO–water mixtures. The 129 residues of lysozyme are arranged in 4 helices – A (5–15), B (25–36), C (88–101), and D (109–115) (Scheme 1A). Klibanov and co-workers showed that the refolding activity of lysozyme in DMSO–water mixture is maximum at ∼6 mol% DMSO (i.e. 20% v/v) in water.1–3 Torreggiani et al. showed that thermally denatured lysozyme shows maximum enzyme activity at 10% (w/w) (2.5 mol%) of DMSO.17 Addition of DMSO to an aqueous solution of a protein reduces thermal stability of many proteins (e.g. NAD+ synthetase,4 RNAase,5 and lysozyme6,7). NMR and Raman spectra indicate that addition of DMSO to an aqueous solution of lysozyme reduces the contribution of the hydrated turn, α-helix and the β-sheet.8 Bhattacharjya and Balaram, found that addition of 20% (v/v) (6 mol%) DMSO causes a broad structural transition of lysozyme to a partially unfolded state while at ∼20 mol% (i.e. 50% (v/v)) DMSO a partially folded state is formed with considerable modification of the tertiary structure.28,29
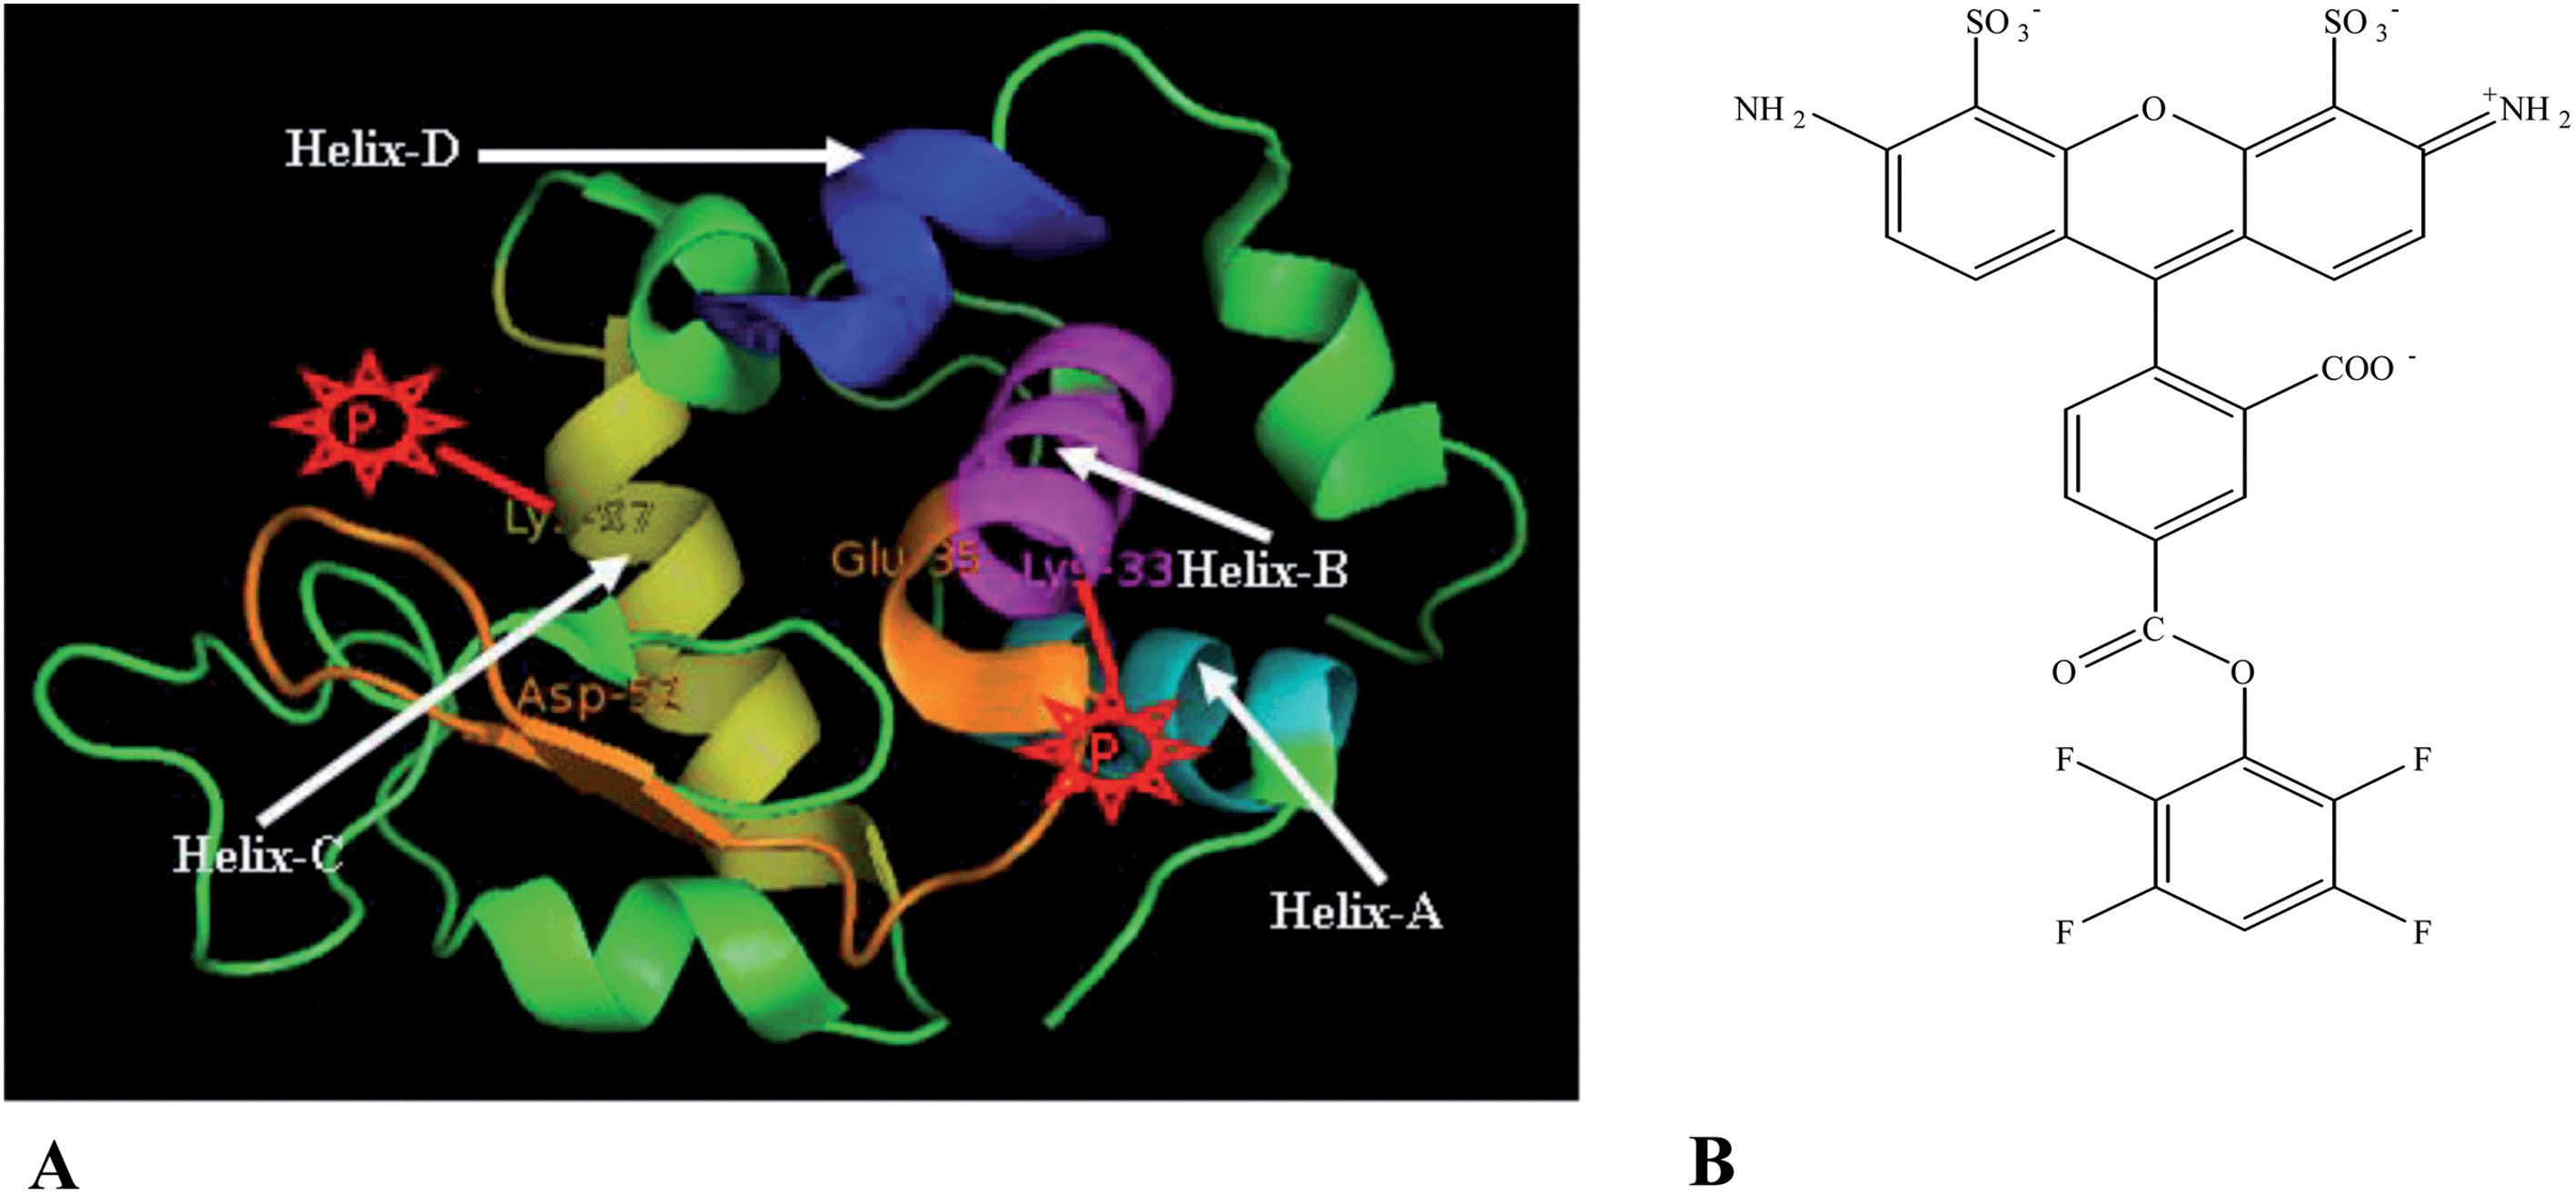 | ||
| Scheme 1 (A) Lysozyme (PDB ID-3ZEK). (B) Alexa Fluor 488 carboxylic acid, TFP ester. | ||
A large scale computer simulation carried out by Bagchi and co-workers12 reveal unfolding of Chicken Villin Headpiece (HP-36) as indicated by increase in size and root mean square displacement (RMSD) of Cα atoms from 0 to 10 mol% DMSO.12 For the larger 129-residue protein, lysozyme, they simulated only the active site.10 RMSD of Cα atoms and SASA (solvent accessible surface area) of lysozyme undergoes a slight decrease up to 5 mol% DMSO, followed by a sharp increase from 5 to 15 mol% DMSO.10 Further, addition of DMSO up to 15 mol% causes an increase in loss of native like contact at the active site which is signature of partial unfolding.10
While the simulation10 considered only the effect of DMSO on the active site, other regions of the protein (lysozyme) may also be affected by DMSO. This may affect the size (rH) and the conformational dynamics of lysozyme. In the present work, we have applied fluorescence correlation spectroscopy (FCS) to probe size (rH) and the conformational dynamics of the protein lysozyme in DMSO–water mixture. FCS has recently been applied to study protein,14,35,36 lipid,37,38 vesicles39 and biological cell.40–42 For the FCS study, lysozyme (Scheme 1A) is covalently labeled by a fluorescent probe alexa fluor 488 TFP ester (Scheme 1B). For alexa 488 labeling, the major modification sites are Lys-33 (helix B) and Lys-97 (helix C).43–46 The active site of lysozyme is the deep cleft between Glu-35 and Asp-52 (shown in orange, Scheme 1A). As shown in Scheme 1A, one of the locations of alexa probe (at Lys-33, shown in red cartoon, Scheme 1A) is close to the active site and the other (Lys-97, shown in red cartoon, Scheme 1A) is far from the active site.
2. Experimental section
2.1 Materials
Alexa fluor-488 carboxylic acid TFP ester and hen egg white lysozyme were purchased from Invitrogen and Fluka respectively. Both of them were used without further purification. Bio grade DMSO was used as the solvent. pH of DMSO–water mixtures was measured using Systronics Digital pH meter (model 335).2.2 Methods
In the FCS experiment, Tween-20 (0.005%, w/w) was used as a solvent additive to suppress attachment of the protein to the glass surface. The CD spectrum of the protein is found to be unchanged on addition of Tween 20 (ESI, Fig. S1†). This rule outs the possibility of structural change of the protein in the presence of Tween 20. FCS experiments were carried out at 20 °C, and laser power was kept at ∼50 μW. All experiments were repeated at least thrice.
The autocorrelation function G(τ) of fluorescence intensity is defined as
 | (1) |
We have fitted the FCS traces to two models. The quality of fit (residuals) to a free diffusion model and to a model involving single component diffusion and one component relaxation are given in ESI, Fig. S2.† The best fit is obtained for the model involving single component diffusion and one component relaxation. For this model, the autocorrelation function is given by,48
 | (2) |
In order to ascertain the contribution of blinking of the dye, the relaxation times were determined as a function of laser power (ESI, Fig. S3†). The lack of a systematic dependence of relaxation time on laser power conclusively rule outs the possibility of blinking.
The diffusion coefficient (Dt) is related to the diffusion time (τD) and transverse radius (ωxy) as,
 | (3) |
Assuming the spherical shape of lysozyme molecule, the hydrodynamic radius (rH) can be obtained from diffusion coefficient (Dt) using the Stokes–Einstein relation,
 | (4) |
The viscosity (η) of DMSO is 2.2 times higher than that of water and the refractive index of DMSO (1.479) is about 10% higher than that of water (1.33). For these systems, refractive index mismatch and viscosity effect have been corrected following the method discussed by Chattopadhyay et al.48 and Sherman et al.50 In order to account for the changes in refractive index and viscosity we used R6G as a diffusion standard (Table S1 and Fig. S4, ESI†) and the following equation.48
 | (5) |
3. Results
3.1 Circular dichroism (CD) spectra of lysozyme
Fig. 1 shows the effect of DMSO on the CD spectra of lysozyme in the tryptophan region. On addition of DMSO, there is a perceptible blue shift of the 287 nm band (ESI, Fig. S5†). This indicates decrease of local polarity presumably because of accumulation of DMSO around the tryptophan(s). As shown in Fig. 4, at pH ∼ 7 the ellipticity at 293 nm (due to the tryptophan residues) increases with increase in DMSO concentration up to 30 mol% DMSO. This suggests that the random coil structure around tryptophan region of lysozyme increases up to 30 mol% DMSO and decreases at higher DMSO concentration. | ||
| Fig. 1 Variation of ellipticity of CD spectra of lysozyme with mol% of DMSO. | ||
The effect of addition of DMSO to the CD band at 208 nm (due to the helical structure) could not be monitored because of intense absorption of DMSO below 250 nm.
3.2 Blue shift of tryptophan emission on addition of DMSO
Fig. 2 shows the effect of DMSO on the tryptophan emission maximum of lysozyme in DMSO–water mixtures. It is readily seen that addition of DMSO causes a blue shift in the position of the emission maximum of the tryptophan residues from 339 nm in water (pH ∼ 7 phosphate buffers) to 332 nm in 5 mol% and to 327 nm in 30 mol% DMSO. This once again indicates that the methyl groups of DMSO molecules preferentially localize in the vicinity of the tryptophan residues causing a reduction of polarity of the environment around the tryptophan residues.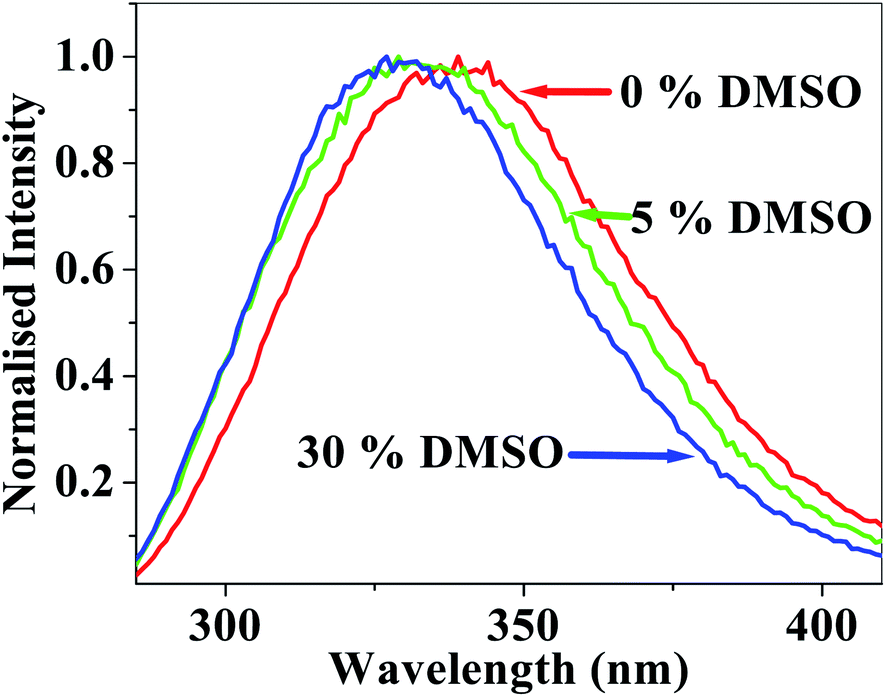 | ||
| Fig. 2 Emission spectra of unlabelled lysozyme (λex = 280 nm) in water as a function of mol% of DMSO. | ||
3.3 FCS data: size of alexa 488 labeled lysozyme in DMSO–water mixture
Fig. 3 shows the normalized FCS traces of alexa-488 labeled hen egg white lysozyme in DMSO–water binary mixture at different mol% of DMSO (χDMSO). Table 1 summarizes the pH and viscosity of the mixtures, conformational relaxation time of lysozyme (τr) and hydrodynamic radius (rH) of lysozyme in DMSO–phosphate buffer mixtures. Diffusion time of lysozyme (τD), amplitude of the relaxation time (F) and diffusion time of R6G (τR6GD) are given in ESI, Table S1.† | ||
| Fig. 3 Normalized FCS traces of alexa-488 labeled lysozyme in 0 mol% (black), 5 mol% (red), 20 mol% (green) and 40 mol% (blue) in DMSO–water mixture. | ||
| Mol% DMSO | pHa | ηbulk (at 293 K) in cP34 | τrb (μs) | rHc (Å) | k+ (m s−1) | k− (m s−1) | Kfolding | ΔGunfolding (kJ mol−1) |
|---|---|---|---|---|---|---|---|---|
| a ±0.1.b ±10 μs.c ±2 Å. | ||||||||
| 0 | 7.0 | 1.002 | 65 | 18 | 2.92 | 12.46 | 0.23 | −3590.77 |
| 1.31 | 7.1 | — | 85 | 22 | 2.82 | 8.94 | 0.32 | −2854.47 |
| 2.74 | 7.2 | — | 105 | 27 | 3.24 | 6.29 | 0.52 | −1642.57 |
| 5 | 7.2 | — | 150 | 33 | 2.27 | 4.4 | 0.52 | −1642.57 |
| 10 | 7.4 | 2.152 | 125 | 25 | 2.56 | 5.44 | 0.47 | −1866.63 |
| 15 | 7.4 | — | 105 | 21 | 1.9 | 7.62 | 0.25 | −3432.99 |
| 20 | 7.4 | 3.455 | 60 | 20 | 3.25 | 13.42 | 0.24 | −3511.12 |
| 30 | 7.7 | 4.310 | 40 | 18 | 4 | 21 | 0.19 | −4106.40 |
| 40 | 8.0 | 4.267 | 60 | 20 | 3.17 | 13.5 | 0.23 | −3590.77 |
Fig. 4 describes the variation of rH of lysozyme in DMSO–water mixtures. On addition of DMSO, size of lysozyme increase from 18 Å in 0% DMSO to 33 Å in 5 mol% DMSO followed by a decrease to 18 Å in 30 mol% DMSO. The increase in size at lower concentration of DMSO indicates unfolding of lysozyme.
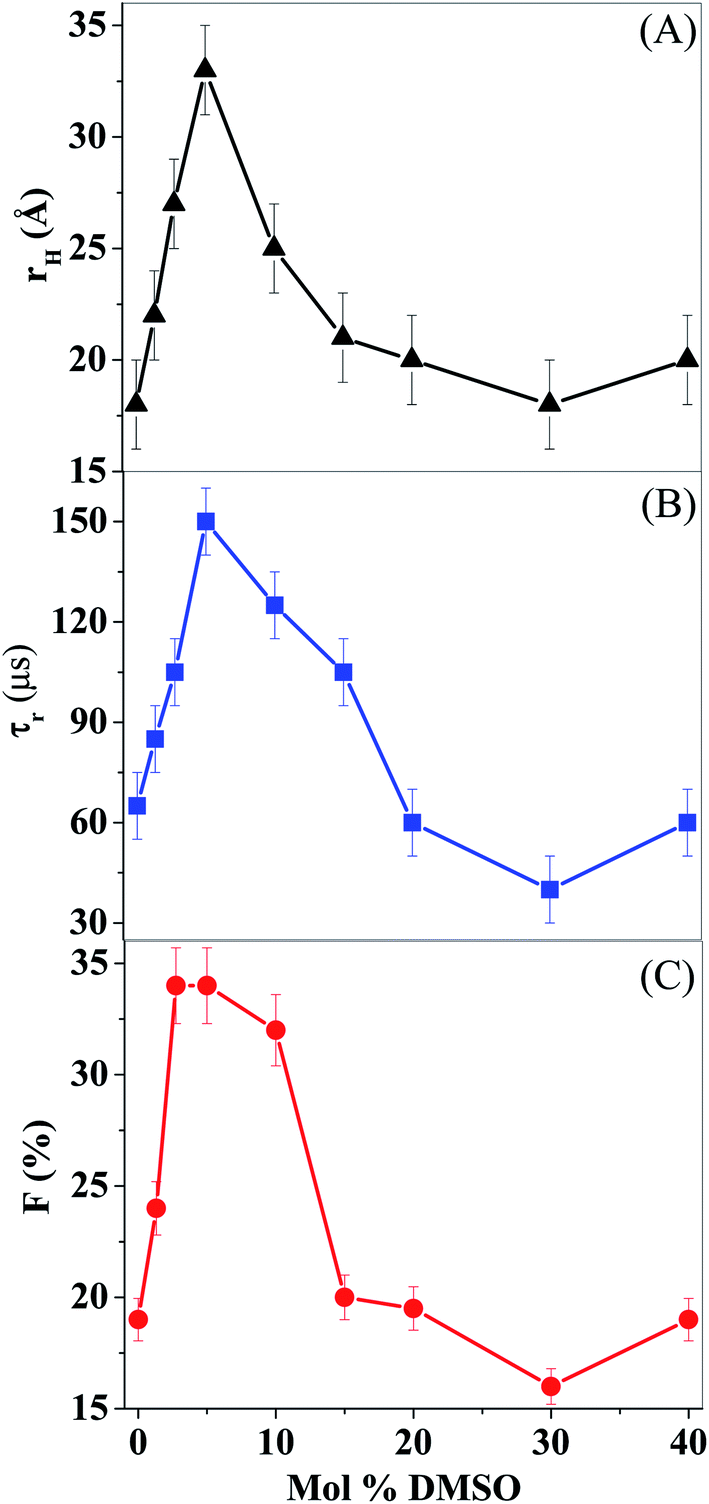 | ||
| Fig. 4 Lysozyme in DMSO–water mixture: variations of (A) hydrodynamic radius (rH); (B) relaxation time (τR); and (C) amplitude of the non-fluorescent state (F). | ||
3.4 Conformational dynamics of alexa 488 labeled lysozyme in DMSO–water mixture
In this section, we will discuss the effect of DMSO on the conformational dynamics of lysozyme. The relaxation time of conformational dynamics (τR) was obtained by fitting the FCS data to eqn (2). The time constant (τR) for lysozyme in DMSO–water mixture are listed in Table 1.In the native state, lysozyme displays a relaxation time of 65 μs. This is similar to the 55 μs component detected by Majima and co-workers for Cyt C.51 Chattopadhyay and co-workers found a single relaxation component of 20–50 μs for Cyt C.51–53 The variation of the relaxation component for alexa labeled lysozyme with mol% of DMSO is shown in Fig. 4 and is listed in Table 1. It is evident that the time component exhibits an initial rise from 65 μs at 0 mol% DMSO to 150 μs at ∼5 mol% DMSO and then decrease to 40 μs at 30 mol% DMSO (Fig. 4 and Table 1). F (contribution of non-fluorescent state) increases from 19% at 0 mol% DMSO to 34% at 5 mol% DMSO followed by a decrease to 16% at 30 mol% DMSO (Fig. 4).
4. Discussion
Before discussing the effect of DMSO on alexa labeled lysozyme, it may be emphasized that neither alexa-labeling nor slight change in pH due to addition of DMSO affects the structure of the protein. Melo et al.44 has previously reported that labeling of lysozyme with alexa 488 keeps the CD spectra intact (Fig. S3 of ESI of ref. 42) and hence, does not affect the structure of the protein. Addition of DMSO causes slight increase in pH because of changes in pKa of the buffer and the protein. The pH of DMSO–water mixtures increase from 7 at 0 mol% DMSO to 8 at 40 mol% DMSO (Table 1). Calorimetric studies indicate that the slight change in pH on addition of DMSO does not affect the thermodynamics of preferential solvation of lysozyme.6Lysozyme contains six tryptophan residues (Trp-28, Trp-62, Trp-63, Trp-108, Trp-111 and Trp-123). Of these only two tryptophan residues (Trp-62 and 108) contribute to tryptophan emission.54 Among the emitting tryptophan residues Trp-62 is near the active site of lysozyme while Trp-108 is not at the active site. The blue shift of tryptophan emission indicates that DMSO invades both the active site and other regions of the lysozyme. Note, clustering of the hydrophobic DMSO molecule at the active site of lysozyme at 5 mol% DMSO has also been detected in recent computer simulation and has been shown to give rise to a decrease in the solvent accessible surface area (SASA).10
In a small angle neutron scattering (SANS) study, Voets et al. found size (radius of gyration) of lysozyme remains unchanged up to ∼37 mol% (i.e. 70% (v/v)) DMSO.13 Voets et al. however, did not study any points between 0 mol% and 10 mol% (30% v/v) DMSO. We detected substantial fluctuation in size of lysozyme in this region (0–10 mol% DMSO).
Addition of 5 miol% DMSO causes a ∼1.7-fold increase in the size (rH) of the protein (lysozyme) from 18 Å to 33 Å (Table 1). This indicates substantial amount of unfolding. According to Wilkins et al.55 rH of a protein is 4.75N0.29 in the native state and 2.21N0.57 in the fully denatured state. For lysozyme, N = 129. Thus, for lysozyme from Wilkins formula, rH ≈ 19 Å, in the native state. For lysozyme in the native state (i.e. 0% DMSO), rH is determined from the FCS data (Table 1 and Fig. 4), to be 18 Å. This is in very good agreement with the rH obtained from the Wilkins formula, crystallography56 and size exclusion chromatography.57 On addition of DMSO up to 5 mol%, rH of lysozyme increases steeply to 33 Å. According to Wilkins formula rH of lysozyme in its fully denatured state should be 35 Å. Thus the protein is almost fully unfolded in 5 mol% DMSO. This is quite surprising because of the fact that lysozyme contain four di-sulfide bonds.19 Note, a recent MD simulation study10 shows that up to 15 mol% DMSO concentration there is a loss of native contact of lysozyme, which is a signature of unfolding. They also found that up to 15 mol% DMSO concentration, the methyl group of DMSO preferentially solvate the hydrophobic residue of enzyme.10 Using near UV-circular dichroism, Balaram and coworkers also indicated a broad structural transition of lysozyme to a partially unfolded state at 6 mol% (i.e. 20% v/v) DMSO concentration.28,29 It seems that the favorable interaction of the hydrophobic residues (tryptophan) with DMSO is the driving force for the incorporation of the DMSO near the tryptophan residues. This causes unfolding of the protein and reduction in local polarity (i.e. blue shift of tryptophan emission).
Above 5 mol% DMSO, the size of lysozyme decreases and assumes native like size (rH ∼ 18 Å) at 30 mol% DMSO. Thus the overall structure of lysozyme becomes smaller and hence, more compact above 5 mol% DMSO. The CD spectra also support this. However, presence of large number of DMSO at the active site (as evidenced by blue shift of CD and emission spectra) may impair the enzyme activity. On further addition of DMSO, rH of lysozyme gradually increases again. Note, the variation of size of lysozyme on addition of DMSO is very different from that of the protein bovine serum albumin which exhibits a monotonic increase in hydrodynamic radius from 3.7 nm in 0% DMSO to 7 nm in 40 mol% DMSO.9 In another study, we have found that hydrodynamic radius of lysozyme shows non-monotonic and oscillating variation in ethanol–water binary mixture.58
According to Bryngelson and Wolynes, protein folding affects two parameters – fraction of native contacts (η) and radius.59,60 Using large scale MD simulation, Bagchi and co-workers10 showed that at the active site of lysozyme, there is an increase in the loss of native contact and total contact on addition of DMSO up to 15 mol%. In 15–20 mol% DMSO concentration, native contacts are regenerated and the overall structure suddenly collapsed due to the solvent effect.10 In this concentration region, the hydrophobic residues of lysozyme are sequestered in core structure due to “hydrophobic zipping”.10 It is obvious that addition of DMSO at low concentration disrupts native like contact which is indicated in increase in size up to 5 mol% DMSO. But at high concentration of DMSO size decreases because of collapse. The small size of lysozyme in 15–30 mol% DMSO concentration regions is due to collapse not refolding. This is manifested in differences in relaxation time and folding rate constants.
Finally, we discuss the effect of DMSO on the time constant for the fast folding dynamics of the protein chain from relaxation time (τR) given in eqn (2). The fluctuation in the fluorescence intensity (and hence FCS data) arises from quenching of the fluorescence of the probe (alexa 488) by amino groups of tryptophan and other residues.47–53,61 As shown in Scheme 2, in the open conformation of the protein, the fluorescence probe (P) and the quenching groups (amino groups of tryptophan and other residues) are far apart and hence the open form is fluorescent. The closed form is non-fluorescent because of rapid electron transfer quenching. If k+ and k− denote the rate constants of the formation of non-fluorescent state (open-to-closed inter-conversion) and fluorescent state (closed-to-open inter-conversion), respectively, in the case of two-states at equilibrium (open ↔ closed) one can write,61

where Kfolding is the equilibrium constant and F is the average fraction of molecules in the non-fluorescent state. Evidently,


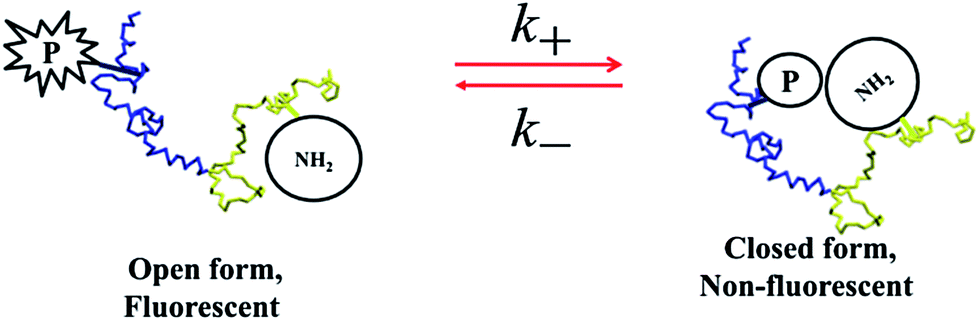 | ||
| Scheme 2 | ||
From the equilibrium constant, we can find out the free energy of unfolding (closed to open transition) using the equation, ΔGunfolding = −RTln(1/Kfolding).
We have previously showed that τR and F vary non-monotonically over the entire DMSO concentration. Interestingly we observed that (1/τR), the folding rate (inter-conversion rate, k+) and unfolding rate constant (inter-conversion rate, k−) show chevron like plot with increasing DMSO concentration (Fig. 5). This chevron plot indicates that transition between open-to-close state does not involve any intermediate (i.e. it undergo a two state pathway).
 | ||
| Fig. 5 Lysozyme in DMSO–water mixture: variations of inverse of relaxation time (1/τR), rate of formation of closed form (k+), rate of formation of open form (k−) and free energy of unfolding (ΔGunfolding). Solid lines represent the B-splined line joining the data points. | ||
We have also calculated the unfolding free energy (ΔGunfolding). Contrary to our expectation, ΔGunfolding shows a maximum around 5 mol% DMSO concentration. The maximum value of ΔGunfolding indicates that unfolding is least favorable at 5 mol% DMSO. At 5 mol% DMSO the size of the protein is largest. At the large size of protein, already most of the native like contacts are ruptured.10 As a result the free energy difference of the closed and open form will be lower at 5 mol% DMSO.
5. Conclusion
This study demonstrates that the FCS probe the overall structure of the protein lysozyme and monitors the DMSO-induced change both at the active site and at other regions of the protein. Circular dichroism and emission spectra indicates that DMSO resides near the hydrophobic tryptophan residues (at the active site and away from it) presumably because of interaction of hydrophobic residues with methyl groups of DMSO. Large scale invasion of DMSO into lysozyme causes unfolding (change in size) of lysozyme resulting in a 1.7 fold increase in rH from 18 Å at 0% to 33 Å at 5 mol% DMSO. Beyond 5 mol% DMSO the size of the protein decreases because of hydrophobic collapse as result of interaction of the methyl groups of DMSO with the hydrophobic residues. The folding rate (inter-conversion from open to closed i.e. contact of probe and amino group) and unfolding rate (inter-conversion from closed to open) constant show a chevron like plot as a function of DMSO concentration. This indicates a two state pathway of folding dynamics.Acknowledgements
Thanks are due to Department of Science and Technology, India (Centre for Ultrafast Spectroscopy and Microscopy Project and J. C. Bose Fellowship) and the Council of Scientific and Industrial Research (CSIR) for generous research support. S.G., S.C. and R.C. thank CSIR for awarding fellowships.References
- A. M. Klibanov, Nature, 2001, 409, 241–246 CrossRef CAS PubMed.
- T. Knubovets, J. J. Osterhout, P. J. Connolly and A. M. Klibanov, Proc. Natl. Acad. Sci. U. S. A., 1999, 96, 1262–1267 CrossRef CAS.
- R. V. Rariy and A. M. Klibanov, Proc. Natl. Acad. Sci. U. S. A., 1997, 94, 13520–13523 CrossRef CAS.
- Z. W. Yang, S. W. Tendian, W. M. Carson, W. J. Brouillette, L. J. Delucas and C. G. Brouillette, Protein Sci., 2004, 13, 830 CrossRef CAS PubMed.
- A. L. Jacobson and C. L. Turner, Biochemistry, 1980, 19, 4534 CrossRef CAS.
- E. L. Kovrigin and S. A. Potekhin, Biochemistry, 1997, 36, 9195 CrossRef CAS PubMed.
- A. Giugliarelli, M. Paolantoni, A. Morresi and P. Sassi, J. Phys. Chem. B, 2012, 116, 13361–13367 CrossRef CAS PubMed.
- E. P. G. Areas, J. A. G. Areas, J. Hamburger, W. L. Peticolas and P. S. Santos, J. Colloid Interface Sci., 1996, 180, 578–589 CrossRef CAS.
- A. Pabbathi, S. Patra and A. Samanta, ChemPhysChem, 2013, 14, 2441–2449 CrossRef CAS PubMed.
- S. Roy, B. Jana and B. Bagchi, J. Chem. Phys., 2012, 136, 115103 CrossRef PubMed.
- S. Banerjee, S. Roy and B. Bagchi, J. Phys. Chem. B, 2010, 114, 12875–12882 CrossRef CAS PubMed.
- S. Roy and B. Bagchi, J. Phys. Chem. B, 2013, 117, 4488–4502 CrossRef CAS PubMed.
- I. K. Voets, W. A. Cruz, C. Moitzi, P. Lindner, E. P. G. Areas and P. Schurtenberger, J. Phys. Chem. B, 2010, 114, 11875–11883 CrossRef CAS PubMed.
- H. P. Lu, Phys. Chem. Chem. Phys., 2011, 13, 6734–6749 RSC.
- C. Gögelein, D. Wagner, F. Cardinaux, G. Nägele and S. U. Egelhaaf, J. Chem. Phys., 2012, 136, 015102 CrossRef PubMed.
- M. Jackon and H. H. Mantsch, Biochim. Biophys. Acta, 1991, 1078, 231–235 CrossRef.
- A. Torreggiani, M. Di Foggia, I. Manco, A. De Maio, S. A. Markarian and S. Bonora, J. Mol. Struct., 2008, 891, 115–122 CrossRef CAS PubMed.
- S. Roy and B. Bagchi, J. Chem. Phys., 2013, 139, 034308 CrossRef PubMed.
- L. R. Nemzer, B. N. Flanders, J. D. Schmit, A. Chakrabarti and C. M. Sorensen, Soft Matter, 2013, 9, 2187–2196 RSC.
- Y. L. Khmelnitskyl, A. B. Belova, A. V. Levashov and V. V. Mozhaev, FEBS Lett., 1991, 284, 267–269 CrossRef.
- N. Byrne and C. A. Angell, J. Mol. Biol., 2008, 378, 707–714 CrossRef CAS PubMed.
- R. M. Parodi, E. Bianchi and A. Ciferri, J. Biol. Chem., 1973, 248, 4047–4051 CAS.
- T. A. Page, N. D. Kraut, P. M. Page, G. A. Baker and F. V. Bright, J. Phys. Chem. B, 2009, 113, 12825–12830 CrossRef CAS PubMed.
- W. Dzwolak, J. Kalinowski, C. Johannessen, V. Babenko, G. Zhang and T. A. Keiderling, J. Phys. Chem. B, 2012, 116, 11863–11871 CrossRef CAS PubMed.
- V. Vagenende, M. G. S. Yap and B. L. Trout, Biochemistry, 2009, 48, 11084–11096 CrossRef CAS PubMed.
- S. Singh, S. K. Srivastava and D. K. Singh, RSC Adv., 2013, 3, 4381–4390 RSC.
- I. T. S. Li and G. C. Walker, J. Am. Chem. Soc., 2010, 132, 6530–6540 CrossRef CAS PubMed.
- S. Bhattacharjya and P. Balaram, Proteins: Struct., Funct., Genet., 1997, 29, 492–507 CrossRef CAS.
- K. A. Satish, S. C. Shankaramma, S. Raghothama and P. Balaram, Biopolymers, 2001, 58, 465–476 CrossRef.
- D. Hu, J. Yu, K. Wong, B. Bagchi, P. J. Rossky and P. F. Barbara, Nature, 2000, 405, 1030–1033 CrossRef CAS PubMed.
- V. Nikolakis, S. H. Mushrif, B. Herbert, K. S. Booksh and D. G. Vlachos, J. Phys. Chem. B, 2012, 116, 11274–11283 CrossRef CAS PubMed.
- M. Wang and K. Warncke, J. Am. Chem. Soc., 2008, 130, 4846–4858 CrossRef CAS PubMed.
- C. Nieto-Draghi, J. B. Ávalos and B. Rousseau, J. Chem. Phys., 2003, 119, 4782–4789 CrossRef CAS PubMed.
- S. A. Schichman and R. L. Amey, J. Phys. Chem., 1972, 76, 98–102 Search PubMed and the references there in.
- A. Hoffmann, K. Neupane and M. T. Woodside, Phys. Chem. Chem. Phys., 2013, 15, 7934–7948 RSC.
- R. Chowdhury, S. Chattoraj, S. Sen Mojumdar and K. Bhattacharyya, Phys. Chem. Chem. Phys., 2013, 15, 16286–16293 RSC.
- T. Motegi, H. Nabika and K. Murakoshi, Phys. Chem. Chem. Phys., 2013, 15, 12895–12902 RSC.
- S. Sen Mojumdar, S. Ghosh, T. Mondal and K. Bhattacharyya, Langmuir, 2012, 28, 10230–10237 CrossRef CAS PubMed.
- S. Ghosh, A. K. Mandal, A. K. Das, T. Mondal and K. Bhattacharyya, Phys. Chem. Chem. Phys., 2012, 14, 9749–9757 RSC.
- D. K. Sasmal, S. Ghosh, A. K. Das and K. Bhattacharyya, Langmuir, 2013, 29, 2289–2298 CrossRef CAS PubMed.
- S. Ghosh, S. Chattoraj, T. Mondal and K. Bhattacharyya, Langmuir, 2013, 29, 7975–7982 CrossRef CAS PubMed.
- S. Ghosh, S. Chattoraj and K. Bhattacharyya, J. Phys. Chem. B, 2014 DOI:10.1021/jp412631d.
- A. Coutinho, L. M. S. Loura, A. Fedorov and M. Prieto, Biophys. J., 2008, 95, 4726–4736 CrossRef CAS PubMed.
- A. M. Melo, M. Prieto and A. Coutinho, Biochim. Biophys. Acta, 2011, 1808, 2559–2568 CrossRef CAS PubMed.
- D. Suckau, M. Mak and M. Przybylski, Proc. Natl. Acad. Sci. U. S. A., 1992, 89, 5630–5634 CrossRef CAS.
- D. C. Philllips, Proc. Natl. Acad. Sci. U. S. A., 1967, 57, 484–495 CrossRef.
- S. Sen Mojumdar, R. Chowdhury, S. Chattoraj and K. Bhattacharyya, J. Phys. Chem. B, 2012, 116, 12189–12198 CrossRef CAS PubMed.
- K. Chattopadhyay, S. Saffarian, E. L. Elson and C. Frieden, Biophys. J., 2005, 88, 1413–1422 CrossRef CAS PubMed.
- Z. Petrasek and P. Schwille, Biophys. J., 2008, 94, 1437–1448 CrossRef CAS PubMed.
- E. Sherman, A. Itkin, Y. Y. Kuttner, E. Rhoades, D. Amir, E. Haas and G. Haran, Biophys. J., 2008, 94, 4819–4827 CrossRef CAS PubMed.
- J. Choi, S. Kim, T. Tachikawa, M. Fujitsuka and T. Majima, Phys. Chem. Chem. Phys., 2011, 13, 5651–5658 RSC.
- S. Haldar, S. Mitra and K. Chattopadhyay, J. Biol. Chem., 2010, 285, 25314–25323 CrossRef CAS PubMed.
- S. Haldar and K. Chattopadhyay, J. Biol. Chem., 2012, 287, 11546–11555 CrossRef CAS PubMed.
- T. Imoto, L. S. Forster, J. A. Rupley and F. Tanaka, Proc. Natl. Acad. Sci. U. S. A., 1971, 69, 1151–1155 CrossRef.
- D. K. Wilkins, S. B. Grimshaw, V. Receveur, C. M. Dobson, J. A. Jones and L. J. Smith, Biochemistry, 1999, 38, 16424–16431 CrossRef CAS PubMed.
- P. Prinsen and T. Odijk, J. Chem. Phys., 2006, 125, 074903 CrossRef PubMed.
- V. N. Uversky, Biochemistry, 1993, 32, 13288–13298 CrossRef CAS.
- S. Chattoraj, A. K. Mandal and K. Bhattacharyya, J. Chem. Phys., 2014 Search PubMed , in press.
- J. D. Bryngelson and P. G. Wolynes, J. Phys. Chem., 1989, 93, 6902–6915 CrossRef CAS.
- J. D. Bryngelson, J. N. Onuchic, N. D. Socci and P. G. Wolynes, Proteins: Struct., Funct., Genet., 1995, 21, 167–195 CrossRef CAS PubMed.
- H. Neuweiler, M. Lollmann, S. Doose and M. Sauer, J. Mol. Biol., 2007, 365, 856–869 CrossRef CAS PubMed.
Footnote |
| † Electronic supplementary information (ESI) available. See DOI: 10.1039/c4ra00719k |
| This journal is © The Royal Society of Chemistry 2014 |