Novel functional hybrid silica sol–gel coating for copper protection via in situ thiol–ene click reaction
Shusen Peng,
Zhixiang Zeng,
Wenjie Zhao,
He Li,
Jianmin Chen,
Jin Han* and
Xuedong Wu*
Laboratory of Marine New Materials and Related Technology, Zhejiang Key Laboratory of Marine Materials and Protection Technology, Ningbo Key Laboratory of Marine Protection Materials, Ningbo Institute of Material Technology & Engineering, Chinese Academy of Sciences, Ningbo, 315201, P.R. China. E-mail: hj@nimte.ac.cn; xdwu@nimte.ac.cn; Fax: +86 574 86685159
First published on 17th March 2014
Abstract
A novel anticorrosion coating, which crosslinks with inorganic bonds (Si–O–Si) and organic bonds (C–S–C), is prepared on copper through an in situ sol–gel method and thiol–ene click reaction. The hybrid sol solution containing mercapto and vinyl groups (MVFS) is prepared from hydrolysis and condensation of vinyltriethoxysilane (VTES), tetraethoxysilane (TEOS) and 3-mercaptopropyltrimethoxysilane (MPMS). The thiol–ene click reaction was initiated with a thermal initiator after the sol solution was applied on the copper surface. Various corresponding methods are carried out to investigate this novel coating's properties. Experimental results demonstrate that the formation of organic crosslinking bonds deriving from thiol–ene click reaction can enhance the protection performance of the MVFS material for copper.
1. Introduction
Due to its favorable thermal, electric and mechanical properties, copper has been widely used in industry, building and daily use.1 However, the corrosion of copper materials is unavoidable in practical applications. If corrosion happens, copper would lose its thermal, electric and mechanical properties.2 Therefore surface protection is required to extend the service life of copper.3Hybrid silica sol–gel coatings have seen a lot of interest in the past few years due to these materials combining the properties of organic and inorganic compounds,4–6 and have been intensively investigated as anticorrosion materials for various metal materials.7–10 An important advantage of this coating is that it can form Si–O–metal bond on metal surface leading to good adhesion.7 However, previous reports have revealed that it is difficult to form Cu–O–Si bond resulting a poor protection for copper.11,12
An alternative method is introducing mercapto group as that this group can form Cu–S bond with copper.13–15 However, mercapto group is susceptible to oxidation,16 which may cause coating degradation. Click reaction is are modular, high yielding, simple to perform, tolerant to various solvent and air.17 Thiol–ene click reaction is an addition reaction between a thiol and an ene. This reaction has been intensively studied to prepare novel materials.18–20 In this report, a novel anticorrosion coating, which crosslinks with inorganic bond (Si–O–Si) and organic bond (C–S–C), is formed on copper through in situ sol–gel method and thiol–ene click reaction. Our consideration is basing on that thioether bond provides better stability than mercapto group, and this in situ method can improve coating crosslinking density and remain the ability of formatting Cu–S bond on copper surface.
Specifically, a hybrid sol solution containing mercapto and vinyl groups (MVFS) is prepared from hydrolysis and condensation of vinyltriethoxysilane (VTES), tetraethoxysilane (TEOS) and 3-mercaptopropyltrimethoxysilane (MPMS). The thiol–ene click reaction is initiated with a thermal initiator after sol solution has applied on copper surface. The properties of this coating are investigated by various corresponding methods. The addition reaction between a thiol and an ene is characterized by IR and XPS. Scanning electron microscope (SEM) is used to observe the surface and cross section topology of this coating on copper. Thermal and corrosion resistance properties are evaluated by thermal gravimetric analysis and electrochemical methods, respectively. Also, the pencil hardness, hydrophobicity and adhesion of coating are measured.
2. Experimental
2.1. Materials
Copper substrates are polished with fine emery paper. They are then degreased ultrasonically in acetone, cleaned with distilled water. (3-Mercaptopropyl)trimethoxysilane (MPMS), vinyltriethoxysilane (VTES) and tetraethoxysilane (TEOS) are used as precursors for sol–gel condensation without further purification. The thiol–ene reaction is initiated by 1,1-di-(tert-butylperoxy)-3,3,5-trimethylcyclohexane (TMCH).2.2. Sol/coating preparation
9.8 ml MPMS, 9.5 ml VTES, 10.4 ml TEOS and 13.5 ml 0.01 mol l−1 dilute solution of formic acid are stirred at room temperature for 24 h. The molar ratio of n(MPMS)![[thin space (1/6-em)]](https://www.rsc.org/images/entities/char_2009.gif) :
:![[thin space (1/6-em)]](https://www.rsc.org/images/entities/char_2009.gif) n(TEOS)
n(TEOS)![[thin space (1/6-em)]](https://www.rsc.org/images/entities/char_2009.gif) :
:![[thin space (1/6-em)]](https://www.rsc.org/images/entities/char_2009.gif) n(VTES) is equal to 1
n(VTES) is equal to 1![[thin space (1/6-em)]](https://www.rsc.org/images/entities/char_2009.gif) :
:![[thin space (1/6-em)]](https://www.rsc.org/images/entities/char_2009.gif) 1
1![[thin space (1/6-em)]](https://www.rsc.org/images/entities/char_2009.gif) :
:![[thin space (1/6-em)]](https://www.rsc.org/images/entities/char_2009.gif) 1, and the molar ratio of water to hydrolysable groups of MPMS, TEOS and VTMS is 1.5. Finally, sol solution is diluted with 115 ml ethanol to 10 wt% solid content and is marked as MVFS-1. Subsequently, a thermal initiator (TMCH) in an amount of 1% of the thiol group in MVFS-1 is added to the dilute sol solution, and is marked as MVFS-2.
1, and the molar ratio of water to hydrolysable groups of MPMS, TEOS and VTMS is 1.5. Finally, sol solution is diluted with 115 ml ethanol to 10 wt% solid content and is marked as MVFS-1. Subsequently, a thermal initiator (TMCH) in an amount of 1% of the thiol group in MVFS-1 is added to the dilute sol solution, and is marked as MVFS-2.
Copper samples are immersed in MVFS-1 and MVFS-2 solution for 5 min, and then are dried at 70 °C for 1 h and 120 °C for 1 h. A simple scheme shown in Fig. 1 is used to describe the reaction of preparation of MVFS solution and coating formation on copper.
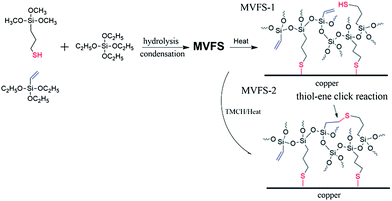 | ||
| Fig. 1 Reaction scheme of preparation of MVFS solution and coating formation on copper without and with an initiator. | ||
2.3. Methods
Surface and cross section morphology of coatings on copper surface are observed by scanning electron microscopy (Quanta FEG 250, FEI). Thermal behaviour is studied using thermogravimetric analysis (Pyris Diamond TG/DTA, Perkin-Elmer) at a heating rate of 10 °C min−1 under nitrogen and air atmosphere.Infrared spectra are recorded on a Nicolet 6700 FTIR. MPMS, VTMS and TEOS are dropped on KBr tablets for IR measurements. Dried MVFS-1 and MVFS-2 coatings are ground into powder, and then mixed with KBr uniformly to press into tablets (1 mg samples into 100 mg KBr) for IR measurements. Pencil hardness test is carried out according to GB/T6739-2006. The peel strength between MFS coating and copper is measured using Pull-Off adhesion tester (PosiTest) and the value is an average of at least three parallel samples. The aqueous contact angle analysis carries out using a Dataphysics OCA20 with sessile drop method. The value of water contact angle is an average of at least three readings at different locations on the surface of each sample.
Polarization curve is carried out using a commercial PGSTAT302 electrochemical workstation (Autolab) in a naturally 3.5 wt% NaCl. A three electrodes system is used, which was composed of a saturated calomel electrode (SCE) as the reference electrode, a platinum foil as a counter electrode and an exposed sample (0.78 cm2) as a working electrode. The scan rate of polarization curves is 0.001 V s−1. For electrochemical impedance spectroscopy (EIS), the test frequency range was 105 to 10−2 Hz and excitation amplitude was 10 mV.
3. Results and discussion
3.1. IR measurement
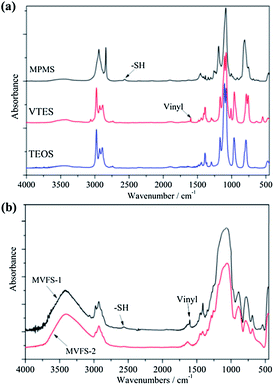
Fig. 2 presents the IR spectra of precursors of MVFS (MPMS, VTES and TEOS) and dried MVFS-1 and MVFS-2. The most interest peak in IR spectra MPMS is related to –SH group,11 which is a weak band around 2568 cm−1. For VTES, the peak at 1615 cm−1, is related to vinyl group. As shown in Fig. 1b, the peaks at 2568 and 1615 cm−1 still exist in the IR spectra of the dried MVFS-1, but disappear in the IR spectra of MVFS-2. The disappearance of those two peaks indicates that thiol–ene reaction might have occurred in MVFS-2.XPS spectra are also conducted to investigate the thiol–ene reaction. Deconvolution of the XPS for C 1s electron of MVFS-1 (Fig. 3a) presents carbon in three different chemical states. The resolved weak component at 285.3 eV in Fig. 3a is attributed to the C bonded directly to sulphur atom.15 The resolved weak component at 283.9 eV is related to the C atom of vinyl group.21 The dominant component at 284.7 eV in Fig. 3a is contributed to the methylene carbon of MPMS and the vacuum chamber contaminant CO2.22 As shown in Fig. 3d, peaks at 285.3 and 284.7 eV present in XPS spectra of MVFS-2. However, the peak related to C atom in vinyl group disappears. In addition, the concentration of C bonded directly to sulphur atom has an increment. These results indicate the occurrence of addition reaction between a thiol and an ene. Deconvolution of the XPS for S 2p electron of MVFS-1 (Fig. 3c) presents the appearance of sulphur in three different chemical states. The peaks, observed at 163.4 and 164.6 eV in Fig. 3c correspond to free mercapto group (–SH) which is split into the 2p3/2 and 2p1/2 components.22 The peak at 168.2 eV can be assigned to the oxidation product of –SH group. As shown in Fig. 3d, there are also three peaks in XPS spectra of MVFS-2. It is found that the bonding energy of S atom in thioether is close to that in –SH. Moreover, a slight increment of peak area at 168.2 eV indicates that –SH groups are oxidized in the process of MVFS-2 formation. This may be caused by the TMCH initiator. Fig. 1 simply describes the formation of MVFS-1 and MVFS-2 coatings on copper surface.
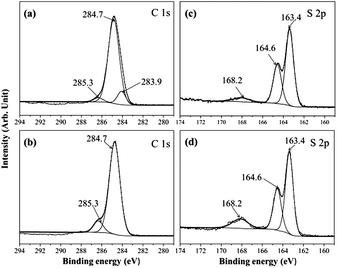 | ||
| Fig. 3 Deconvolution XPS spectra: (a) C 1s of MVFS-1, (a) C 1s of MVFS-2, (c) S 2p of MVFS-1 and (d) S 2p of MVFS-2. | ||
3.2. Morphology, wetting, hardness and adhesion
The surface and cross section morphologies of MVFS-1 and MVFS-2 coatings on copper are presented in Fig. 4. As shown in Fig. 4, the MVFS-1 and MVFS-2 coatings are uniform, crack-free and tightly attached on copper surface. This means that the morphology difference between MVFS-1 and MVFS-2 cannot differentiate by SEM micrographics. Moreover, the thickness of MVFS-1 and MVFS-2 is 5.9 and 5.6 μm, respectively.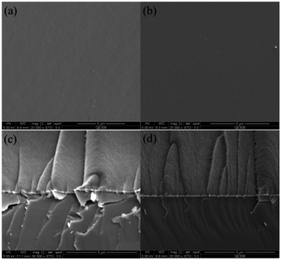 | ||
| Fig. 4 Surface and cross section morphologies of MVFS coatings on copper: (a and c) MVFS-1; (d and b) MVFS-2. | ||
The contact angle of water on MVFS-1 is equal to 89 ± 0.5° while the value of MVFS-2 is 94 ± 0.3°. The slight increase is due to the C–S–C unit is more hydrophobic than –SH group. The pencil hardness test is carried out to determine the scratch resistance of coating, which is evaluated using a calibrated set of drawing pencil ranging from 6 B, the softest, to 6 H, the hardest. The first pencil that scratches the surface is reported as the hardness, according to the Standard GB/T6739-2006. The test gives 6 H for MVFS-1 and MVFS-2. The adhesion test gives a 13.1 ± 0.6 and 12.8 ± 0.3 MPa for MVFS-1 and MVFS-2, respectively, demonstrating that MVFS coating has good adhesion to copper surface.
3.3. Thermogravimetric analysis
In order to determine the effect of thiol–ene reaction on the thermal stability of the MVFS coating, thermal gravimetric analysis of the dried sols are performed at a heating rate of 10 °C min−1 under nitrogen and air. Fig. 5 presents the weight-loss curves (TG) and the differential weight loss curves (DTG). The 5% weight-loss temperature (T5), the temperature of the maximum rate of weight loss (Tm) and SiO2 yield (YSiO2) at 900 °C, obtained from DTG and TGA traces, respectively, are listed in Table 1. Comparing the T5 and Tm of the MVFS-1 with those of the MVFS-2 under nitrogen, it is found that the value of T5 for MVFS-2 slightly decreases while the value of Tm is nearly constant (above 391 °C). The DTG curve of MVFS-1 and MVFS under nitrogen clearly indicates three main reaction stages. For DTG curve of MVFS-1, the weight loss at the interval of 200–350 °C is ascribed to the volatilization of the absorbent water and ethanol and evaporation of small molecular oligomers;23 the second step (350–450 °C) can be assigned to the decomposition of the vinylidene end and mercaptopropyl units;24 and the third steps (450–650 °C) is attributed to the dehydration of silanol groups in Si–O–Si network.25 The peak at the interval of 200–350 °C of MVFS-2 DTG curve is stronger than that of MFVS-1 and its peak center shifts to a low temperature. While the peaks at the interval of 350–450 °C and 450–650 °C are coincident with those peaks of MVFS-1. This result indicates that the thiol–ene reaction has little influence on the thermal stability of MVFS material. The reason that MVFS-2 has a lower T5 than MVFS-1 is because that thiol–ene reaction can improve the crosslinking density of coating and then remains more incorporated residuals. This result is supported by that the char yield (YSiO2) of MVFS-2 (69.4%) is lower than that of MVFS-1 (71.9%) and the weight of MVFS-1 at the T5 of MVFS-1 (360.6 °C) is equal to 94.2%. The TG and DTG curves under air at the interval of 200–350 °C are same with that under nitrogen for MVFS-1 and MVFS-2, respectively. However, at a high temperature (>350 °C), those curves have a huge difference under air and nitrogen atmosphere. This is because that organic group is completely oxidized at the interval of 350–450 °C under air.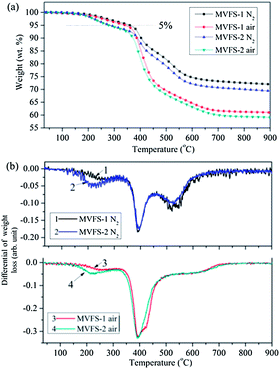 | ||
| Fig. 5 TG (a) and DTG (b) curves of MVFS-1 and MVFS-2, obtained at a heating rate of 10 °C min−1 under nitrogen and air. | ||
| Samples | Atmosphere | T5 (°C) | Tm (°C) | YSiO2 (wt%) |
|---|---|---|---|---|
| MVFS-1 | N2 | 360.6 | 392.7 | 71.9 |
| Air | 343.5 | 391.9 | 61.0 | |
| MVFS-2 | N2 | 284.1 | 392.9 | 69.4 |
| Air | 279.3 | 391.8 | 59.1 |
3.4. Electrochemical test
The corrosion resistance of the treated copper sample is evaluated using a multichannel workstation in a 3.5 wt% NaCl solution, and compared with that of an untreated control sample. The polarization curves of the treated and untreated samples are shown in Fig. 6, and their corresponding parameters Ecorr and Icorr are presented in Table 2. By comparing the polarization curves of bare and coated copper electrodes, it is found that MVFS coatings suppress the anodic and cathodic processes in the potential window. Yet, a significantly change in Ecorr is not detected by all coatings. Moreover, the Icorr value of bare copper is 6.9 × 10⁻⁶ A cm−2, while the Icorr value of the coated samples are substantially low, demonstrating a significantly improved corrosion resistance. The Icorr value of MVFS-2 with 9.8 × 10⁻⁹ A cm−2 is lower than that of MVFS-1 with 6.1 × 10⁻⁸ A cm−2, indicating that the thiol–ene click reaction can enhance the corrosion resistance of MVFS coating. This may be because that the reaction can improve coating's barrier effect through forming organic crosslinking structure (C–S–C).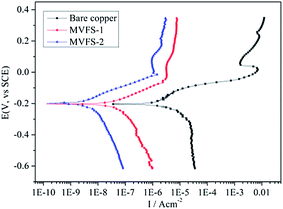 | ||
| Fig. 6 Polarization curves of copper electrodes in 3.5 wt% NaCl aqueous solution: bare and covered with MVFS-1 and MVFS-2. | ||
| Electrode | Ecorr/mV (vs. SCE) | Icorr/A cm−2 |
|---|---|---|
| Bare | −204 | 6.9 × 10⁻⁶ |
| MVFS-1 | −203 | 6.1 × 10⁻⁸ |
| MVFS-2 | −201 | 9.8 × 10⁻⁹ |
Fig. 7 presents the EIS results of bare and MVFS-1 and MVFS-2 covered copper. Bare copper electrode is measured immediately after it is immersed in 3.5 wt% NaCl solution, and the coated electrodes are measured after 30 min of immersion in the solution. The Bode representation of EIS results are shown in Fig. 7b and it provides a good comparison of total impedance values for coated samples and bare one. According to the fact that corrosion rate is inversely proportional to the value of impedance modulus at low frequency,26 it can be concluded that coated samples show lower corrosion rate than the bare one and MVFS-2 has a better anticorrosion ability than MVFS-1. Nyquist plots are analyzed graphically using ZSimpWin software to further interpret EIS results. As shown in Fig. 7a, the Nyquist plots of bare copper consist of a capacitance arc in the high frequency region and a Warburg impedance line in the low frequency region. This result is very similar to research work by other author.2 Thus it is reasonable to use the equivalent circuit R(Q(RW)) in Fig. 8a to analyze the EIS result of bare copper. The impedance spectra of coated samples are significantly different from bare one. For MVFS-1 and MVFS-2, the Warburg impedance disappears in the low frequency region, instead, a large depressed semicircle containing two indistinct capacitive loops can be observed from high to low frequency region in Nyquist plots. Therefore, it is reasonable to use the circuit R(Q(R(RQ))) (Fig. 8b) to analyze the EIS result of MVFS-1 and MVFS-2. The value of each element in the equivalent circuits which is calculated by the ZSimp-Win software are listed in Table 3. The fitting result clearly demonstrates that Rfilm and Rct of MVFS-2 are greater than that of MVFS-1. The EIS result is in accordance with the result of polarization curve. The reason that MVFS-2 has a better protection performance than MVFS-1 can be attributed to that the in situ thiol–ene reaction improves coating crosslinking density and then results a better barrier effect.
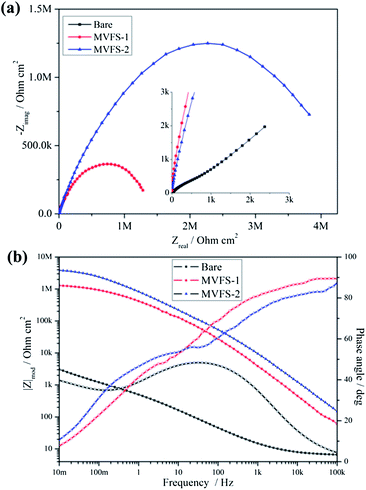 | ||
| Fig. 7 EIS plots of MVFS-1 and MVFS-2 covered and bare copper immersed in 3.5 wt% NaCl aqueous solution: (a) Nyquist plots and (b) Bode plots. | ||
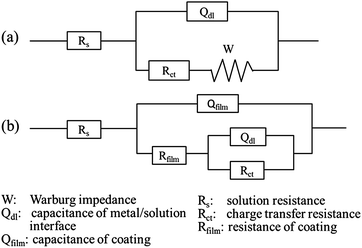 | ||
| Fig. 8 Equivalent circuits used to analyze the EIS plots: (a) R(Q(RW)), for bare copper and (b) R(Q(R(RQ))), for MVFS-1 and MVFS-2 covered samples. | ||
| Sample | Bare | MVFS-1 | MVFS-2 |
|---|---|---|---|
| a The values in brackets correspond to the error (%) of each parameter. | |||
| Qdl (Ssn cm−2) | 4.5 × 10⁻⁴ (0.2)a | 6.2 × 10⁻⁷ (7.1) | 3.1 × 10⁻⁷ (4.1) |
| ndl | 0.81 (0.1) | 0.94 (0.7) | 0.92 (0.4) |
| Rct (Ω cm2) | 1.1 × 10³ (0.4) | 1.5 × 10⁶ (3.2) | 4.8 × 10⁶ (1.4) |
| Qfilm (Ssn cm−2) | — | 6.4 × 10⁻⁷ (3.7) | 3.3 × 10⁻⁷ (1.2) |
| nfilm | — | 0.53 (2.5) | 0.58 (0.7) |
| Rfilm (Ω cm2) | — | 4.2 × 10⁴ (9.8) | 4.7 × 10⁴ (7.3) |
| W (Ss0.5 cm−2) | 0.12 (0.2) | — | — |
| Circuit | R(Q(RW)) | R(Q(R(RQ))) | R(Q(R(RQ))) |
4. Conclusions
This investigation has demonstrated the novel functional hybrid silica sol–gel coating crosslinking with inorganic bond (Si–O–Si) and organic bond (C–S–C) has good scratch resistance, adhesion and protection performance. The reason can be attributed to that the in situ thiol–ene click reaction can improve hybrid sol–gel coating's crosslinking density and remain the ability of forming Cu–S bond. Of course, further investigation should be performed to evaluate the influence of thiol–ene click reaction on coating's structure and properties.Acknowledgements
The authors gratefully acknowledge the financial support of the Ningbo Nature Science Foundation (grant no. 2013A610018), the National Nature Science Foundation (grant no. 51303192 and 51202263), the State Key Program of National Natural Science of China (grant no. 51335010) and the National Basic Research Program of China (grant no. 2014CB643302).References
- F. Caprioli, A. Martinelli, D. Gazzoli, V. Di Castro and F. Decker, J. Phys. Chem. C, 2012, 116, 4628–4636 CAS.
- G. Kear, B. D. Barker and F. C. Walsh, Corros. Sci., 2004, 46, 109–135 CrossRef CAS.
- P. A. Sorensen, S. Kiil, K. Dam-Johansen and C. E. Weinell, J. Coat. Technol. Res., 2009, 6, 135–176 CrossRef CAS.
- C. Sanchez, P. Belleville, M. Popall and L. Nicole, Chem. Soc. Rev., 2011, 40, 696–753 RSC.
- U. Schubert, N. Husing and A. Lorenz, Chem. Mater., 1995, 7, 2010–2027 CrossRef CAS.
- G. Schottner, Chem. Mater., 2001, 13, 3422–3435 CrossRef CAS.
- M. L. Zheludkevich, I. M. Salvado and M. G. S. Ferreira, J. Mater. Chem., 2005, 15, 5099–5111 RSC.
- A. Duran, Y. Castro, M. Aparicio, A. Conde and J. J. de Damborenea, Int. Mater. Rev., 2007, 52, 175–192 CrossRef CAS.
- D. Wang and G. R. Bierwagen, Prog. Org. Coat., 2009, 64, 327–338 CrossRef CAS.
- S. X. Zheng and J. H. Li, J. Sol–Gel Sci. Technol., 2010, 54, 174–187 CrossRef CAS.
- F. Zucchi, V. Grassi, A. Frignani and G. Trabanelli, Corros. Sci., 2004, 46, 2853–2865 CrossRef CAS.
- S. S. Peng, W. J. Zhao, H. Li, Z. X. Zeng, Q. J. Xue and X. D. Wu, Appl. Surf. Sci., 2013, 276, 284–290 CrossRef CAS.
- H. Q. Fan, S. Y. Li, Z. C. Zhao, H. Wang, Z. C. Shi and L. Zhang, Corros. Sci., 2011, 53, 4273–4281 CrossRef CAS.
- F. Zucchi, A. Frignani, V. Grassi, G. Trabanelli and M. DalColle, Corros. Sci., 2007, 49, 1570–1583 CrossRef CAS.
- Z. Mekhalif, F. Sinapi, S. Julien, D. Auguste, L. Hevesi and J. Delhalle, Electrochim. Acta, 2008, 53, 4228–4238 CrossRef.
- G. Bagiyan, I. Koroleva, N. Soroka and A. Ufimtsev, Russ. Chem. Bull., 2003, 52, 1135–1141 CrossRef CAS.
- C. E. Hoyle and C. N. Bowman, Angew. Chem., Int. Ed., 2010, 49, 1540–1573 CrossRef CAS PubMed.
- J.-S. Kim, S. Yang, H. Park and B.-S. Bae, Chem. Commun., 2011, 47, 6051–6053 RSC.
- K. Rozga-Wijas and J. Chojnowski, J. Inorg. Organomet. Polym. Mater., 2012, 22, 588–594 CrossRef CAS.
- H.-K. Yang, A. E. Ozcam, K. Efimenko and J. Genzer, Soft Matter, 2011, 7, 3766–3774 RSC.
- R. Bailey and J. E. Castle, J. Mater. Sci., 1977, 12, 2049–2055 CrossRef CAS.
- Y.-S. Li, W. Lu, Y. Wang and T. Tran, Spectrochim. Acta, Part A, 2009, 73, 922–928 CrossRef PubMed.
- X. Zhang, Y. Y. Wu, S. Y. He and D. Z. Yang, Surf. Coat. Technol., 2007, 201, 6051–6058 CrossRef CAS.
- K. H. Wu, C. M. Chao, C. J. Yang and T. C. Chang, Polym. Degrad. Stab., 2006, 91, 2917–2923 CrossRef CAS.
- T. C. Chang, Y. T. Wang, Y. S. Hong and Y. S. Chiu, J. Polym. Sci., Part A: Polym. Chem., 2000, 38, 1972–1980 CrossRef CAS.
- E. Barsoukov and J. R. Macdonald, Impedance spectroscopy: theory, experiment, and applications, John Wiley & Sons, Inc., New Jersey, 2005 Search PubMed.
| This journal is © The Royal Society of Chemistry 2014 |

