Modeling of chemical–mechanical couplings in anode-supported solid oxide fuel cells and reliability analysis

Xinfang Jin and Xingjian Xue*
Department of Mechanical Engineering, University of South Carolina, Columbia, SC 29208, USA. E-mail: Xue@cec.sc.edu; Fax: +1-803-777-0106; Tel: +1-803-576-5598

Received 8th January 2014 , Accepted 13th March 2014

First published on 17th March 2014


Abstract

Oxygen ionic transport in conducting ceramics is an important mechanism enabling solid oxide fuel cell (SOFC) technology. The multi-physicochemical processes lead to the fact that the distribution of oxygen vacancy site fraction is not uniform in a positive-electrode electrolyte negative-electrode (PEN) assembly. Different oxygen vacancy concentrations induce different volumetric expansion of ceramics, resulting in complicated chemical–mechanical coupling phenomena and chemical stress in SOFCs. In this research, a mathematical model is developed to study oxygen ionic transport induced chemical stress in an SOFC. The model is validated using experimental polarization curves. Comprehensive simulations are performed to investigate chemical stress distribution in the PEN assembly under different operating conditions and design parameters as well as mechanical constraints. Principal stress analysis is employed to identify the weakest zones in the cell. The Weibull approach is utilized to analyze the failure probability of each component and the elastic energy stored in the cathode layer is employed to evaluate potential delamination failure at the cathode/electrolyte interface. The paper for the first time builds a chemical–mechanical coupling model at a cell level and is an important module complementary to the state-of-the-art electrochemical–thermal–mechanical model of SOFCs.

1. Introduction

Solid oxide fuel cells (SOFCs) have been well demonstrated as a promising clean energy conversion technology that converts the chemical energy of fuels into electricity directly.1 To commercially utilize this technology, the SOFC material system should have not only very good electrochemical performance for high energy conversion efficiency but also long term stability. It is well known that the SOFCs are operated under very aggressive conditions, e.g., high temperatures (600–800 °C) and extremely low oxygen partial pressures (anode electrode). These operating conditions could lead to a variety of degradations, which impose great challenges on meeting the lifetime requirement of SOFCs. There have been significant efforts toward the investigations of SOFC degradation mechanisms, including interface stability,2 redox stability,3–5 material phase stability under different temperatures and gas environment,6,7 microstructure/micro-morphology stability,8,9 and mechanical stability.10–14 Among these degradation mechanisms, the mechanical instability is a major degradation mechanism limiting the industrial development of SOFCs.15,16

The basic structure of SOFCs is the positive-electrode/electrolyte/negative-electrode (PEN) tri-layer assembly. Because the materials are different from one layer to another, the thermal stress occurs at elevated temperatures due to thermal expansion mismatch. In open literature, the thermal stress issues in SOFCs have been studied extensively using modeling approach. Kim et al. studied thermal stress of functionally graded SOFCs with assumed temperature distributions.17 Liu et al. investigated the thermal stress at electrode/electrolyte interface, upon which lifetime of SOFCs was predicted under assumed thermal cycling conditions.12 Since the thermal stress is dependent on the temperature distribution across SOFC structure, the multi-physics electrochemical model is usually needed to determine the temperature distribution, upon which thermal stress is calculated. Clague et al. analyzed thermal stress of anode-supported SOFC under duty cycles using the temperature distribution predicted by computational fluid dynamics model.18 Peksen et al. performed the transient thermal–mechanical analysis for an SOFC short stack using the similar approach.19 Khaleel et al. carried out stack thermal stress analysis using the temperature profile calculated from the coupled electrochemistry, thermal and flow analysis.20 All of these represent significant progress toward thermal stress analysis of SOFC structures.

The materials of SOFCs have the capability to take and/or release oxygen depending on the equilibrium state between the bulk ceramics and the surrounding atmosphere, which in turn leads to the volumetric change of bulk ceramics, termed chemical expansion. In this respect, extensive experiments have been carried out to elucidate the relations between oxygen deficit in ceramics and surrounding oxygen partial pressure and temperature as well as chemical expansion, such as Adler et al.21 and Wachsman group.22,23 These studies only considered chemical expansion of bulk ceramics under non-stoichiometric conditions. The materials of SOFCs also have the ability to transport oxygen ions through vacancy defects. The complicated multi-physicochemical processes in SOFCs could lead to the fact that the distribution of oxygen vacancy concentration is not uniform within the bulk materials of electrolyte and electrodes. The non-uniform oxygen vacancy concentration distribution would cause different volumetric expansions in different locations within bulk materials, resulting in a complicated chemical–mechanical coupling phenomenon and chemical stress. Compared to the study of thermal stress in SOFCs, the chemical stress study is still at very early stages. Atkinson studied the chemically-induced stresses in gadolinium doped ceria (GDC) electrolyte through measuring the deformation of electrolyte.24 Krishnamurthy and Sheldon developed a model to study the chemical stress occurred in the 1-D electrolyte of GDC subjected to oxygen potential gradient.25 Swaminathan et al. developed a model framework to study the chemical stress of a GDC planar electrolyte with different oxygen partial pressures on both sides.26,27 Yakabe et al. modeled the chemical stress in a plate of doped lanthanum chromite with either surface of the plate exposed to the fuel and air respectively.28 Terada et al. developed a 1-D model to study electro–chemical–mechanical coupling behavior of PEN structure without considering complicated multi-physics transport processes in SOFCs.29 We recently developed a micro-model to study the chemical and thermal stresses at cathode/electrolyte interface.30 These results represent significant progresses toward the understanding of chemical–mechanical coupling phenomenon in a component of SOFCs. However, practical SOFCs involve very complicated multi-physicochemical processes particularly in porous electrodes. This could generate complicated oxygen potential gradients and electrical field. In addition, the individual component is mechanically constrained by PEN structure assembly in SOFCs. Accordingly the chemical stress in an SOFC setting would be very complicated and the corresponding chemical–mechanical coupling is not well understood.

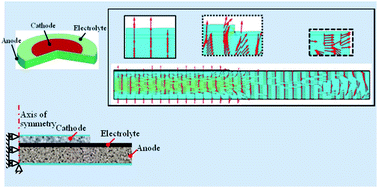
The objective of this research is to develop an innovative model to study chemical–mechanical coupling phenomenon in an SOFC. The model considers the chemical stress in PEN structure of a button cell induced by complicated multi-physicochemical processes. Based upon chemical stress calculation, the reliability of PEN structure is evaluated and correlated to different operating conditions and design parameters as well as mechanical constraints. To our best knowledge, this is the first model of chemical–mechanical coupling under multi-physicochemical processes at a cell level and is an important module complementary to the state-of-the-art electrochemical–thermal–mechanical modeling for SOFCs.

2. Description of mathematical model

SOFCs involve very complicated multi-physicochemical processes, such as reactant/product gas diffusion in porous electrodes, electrical oxidation of fuel in the anode, oxygen reduction reaction in the cathode, oxygen exchange at electrode surface, and ion transport through oxygen vacancies in solid matrix of PEN structure, as well as ionic transport induced chemical expansion of PEN structure. In the following sections, the corresponding mathematical equations will be described in details.

2.1. Charge transport process in conducting ceramic solid phases

The driving force for charge transport in a solid solution is the gradient of electrochemical potential. The electrochemical potential of a defect species in an ideal solid solution is represented by,26,27,31
 
μj = μ0,j + RT[thin space (1/6-em)]ln[thin space (1/6-em)]xj + zj + τj (1)
where μj is the electrochemical potential of species j; R the gas constant; T the temperature; xj the molar fraction of species j; zj the effective charge of species j; F the Faraday's constant; ϕ the electrical field due to externally applied potential and/or non-uniform distribution of charged species; and τj is the stress-dependent part of the electrochemical potential. For isotropic elastic solids, the τj is given by,31
 
image file: c4ra00188e-t1.tif(2)
where βj is the chemical expansion coefficient due to species j; σij is the stress tensor; image file: c4ra00188e-t2.tif

The chemical expansion coefficient due to species j is defined as,22

 
image file: c4ra00188e-t3.tif(3)
where Vm is the molar volume of species j in the stress-free solid with concentration of cj; V0m is the molar volume of species j in the stress-free solid with stoichiometric defect concentration of c0j.

According to non-equilibrium thermodynamics, the current density of a charged species in a solid solution driven by an electrochemical potential can be expressed as,26

 
image file: c4ra00188e-t4.tif(4)
where Dj = RTmj is the diffusion coefficient of species j; mj is the mobility of species j; cj is the concentration of diffusion component, e.g., oxygen vacancy, electron, or hole.

Substitution of eqn (1) into (4) gives,

 
image file: c4ra00188e-t5.tif(5)

Clearly, the diffusion of mobile defects in a solid solution is driven by the gradients of mobile species concentration and stress as well as electrical field.

Under steady state conditions, ∇·Jj = Qj, substituting eqn (5), we have,

 
image file: c4ra00188e-t6.tif(6)
where Qj is the source term of species j.

The eqn (6) is applied for the transport of both oxygen vacancy and electron or hole. Since electron or hole is much smaller than oxygen vacancy, the flux of electron or hole induced by stress gradient is generally neglected. Accordingly the second term in the left side of eqn (6) is neglected for electron or hole transport process. One essential requirement is that the charge neutrality should be maintained for bulk solid solution, i.e.,

 
image file: c4ra00188e-t7.tif(7)

The equations of (6) and (7) are used to describe the transport process of charged species in a solid solution.

2.2. Surface electrochemical reactions

The electrochemical reactions in the electrodes are strongly dependent on the electrode materials. Without loss of generality, we assume that the cathode material is a mixed ionic and electronic conducting (MIEC) ceramics while the anode material is the composite of nickel and electrolyte material.
2.2.1. Electrochemical reactions in MIEC cathode. With MIEC ceramic as the cathode material, the active sites for oxygen reduction reaction are extended to the entire MIEC/gas interface. The oxygen molecule first is adsorbed onto the material surface. The adsorbed oxygen then is incorporated into an oxygen vacancy in MIEC material matrix. Using the Kroger–Vink notation, these two steps can be represented as,
 
image file: c4ra00188e-t8.tif(8)
 
image file: c4ra00188e-t9.tif(9)
where image file: c4ra00188e-t10.tif is an oxygen vacancy, image file: c4ra00188e-t23.tif is an adsorbed oxygen, h˙ is an electron hole, and s is an empty adsorption site on the surface of the MIEC. When the surface polarization is taken into account, the rate equations for these reactions can be represented as:32,33
 
image file: c4ra00188e-t11.tif(10)
 
image file: c4ra00188e-t12.tif(11)
where cv and ch are the concentrations of oxygen vacancies and holes, respectively, taken at the MIEC surface; the r0 terms are exchange rate constants; the θ is the site fraction of absorbates; the α terms are transfer coefficients; and Δχs is the difference between the electrostatic potential drop across the surface and its equilibrium value. The subscript 0 denotes the equilibrium value. It is generally recognized that the oxygen incorporation step is a rate-limiting step;34 therefore the surface adsorption reaction of (8) can be treated as in equilibrium. In this situation, there is no need to find the accurate value for r0c1; further the concentration of adsorbates on the MIEC surface should be close to equilibrium, i.e., Δχs ≈ 0. Accordingly the eqn (11) can be simplified. The calculated reaction rate rc2 determines the magnitude of source term in eqn (6).
2.2.2. Electrochemical reaction at the cathode/electrolyte interface. At the cathode/electrolyte interface, two different materials are bonded together through sintering process. It is recognized that the vacancy transport from the electrolyte to the cathode is an electrochemical reaction.33 The reaction rate can be represented as,
 
image file: c4ra00188e-t13.tif(12)
where the cv is the oxygen vacancy concentration at the interface; ηc is the change of electrostatic potential across the electrolyte/cathode interface. Compared to the oxygen incorporation step on the MIEC surface, the vacancy transport process across the cathode/electrolyte interface is not rate-limiting.
2.2.3. Electrochemical reactions in the anode. The widely used anode material is nickel–electrolyte composite. In nickel cermet composite, the electrochemical reaction takes place at the triple phase boundaries, where the gas phase (hydrogen) and electronic conducting phase (Ni) as well as ionic conducting phase (electrolyte material) meet together. The reaction rate related current density is represented using Butler–Volmer equation,
 
image file: c4ra00188e-t14.tif(13)
where, i0,a is the exchange current density of the anode at equilibrium; xH2O and xH2O are the molar fraction of steam and hydrogen respectively; ct the total concentration of species; andcH2O,ref, cH2,ref are the reference concentration of steam and hydrogen respectively; and η the overvoltage. The overvoltage is defined as, ηa = ϕeϕi − Δϕeq, here Δϕeq is the equilibrium potential difference.

Although the ionic transport is dominant in electrolyte materials, the electronic transport could also be involved especially for intermediate temperature electrolyte materials e.g., doped ceria. As a result, the electrochemical oxidation of hydrogen could also take place on the surface of electrolyte material in porous anode. The reaction can be represented as,

 
image file: c4ra00188e-t15.tif(14)

Similar to the surface reaction of MIECs, the reaction rate can be calculated as,

 
image file: c4ra00188e-t16.tif(15)
here similar to MIECs, the surface overpotential Δχs is assumed to be 0.

2.3. Gas species transport in porous electrodes

The electrochemical reactions are closely related to fuel/gas diffusions in the anode and cathode electrodes. Since multi-species transports are involved in porous electrodes, multi-species Maxwell–Stefan's equation is employed to calculate gas species concentrations,
 
image file: c4ra00188e-t17.tif(16)
where ρ is the density of gas; ωi/j the mass fraction of gas species i/j; Mj the molecular weight of gas species j; image file: c4ra00188e-t18.tif the average molecular weight; xj the molar fraction of gas species j; Ri is the reaction source term for gas species i and is related to the electrochemical current density and reaction rates in eqn (10), (11), (13), and (15); Deffij is the effective binary diffusion coefficients. To avoid the violation of gas species conservation, the average Bosanquet diffusion coefficient is employed,35
 
image file: c4ra00188e-t19.tif(17)
here, ε and τ are porosity and tortuosity of electrode respectively; Dij is the binary diffusion coefficient for a pair of gas species i and j;36 DKn,i is the Knudsen diffusion coefficient for gas species i.36

2.4. Solid mechanics

The governing equations of transport processes described above are used to determine oxygen vacancy concentration distributions in the PEN structure. To further determine chemical stress induced by non-uniform distribution of oxygen vacancy concentration, the coupling between oxygen vacancy concentration and solid mechanics is needed. It is assumed that the bulk volume of ionic conducting materials changes linearly with volumetric insertion and extraction of oxygen ions. Specifically the strain due to chemical expansion effect is represented as,
 
εcij = βΔij (18)
where Δc is the variation of oxygen vacancy concentration, β is the chemical expansion coefficient. image file: c4ra00188e-t20.tif

Since this research is focused on the chemical stress in a button cell, thermal stress is neglected. Therefore, the total strain is composed of mechanical strain and chemical strain. Under the assumption that the total strain is the superposition of mechanical strain and chemical strain, we have,

 
image file: c4ra00188e-t21.tif(19)
where εij represents the total strain components with i and j indicating the axis of the Cartesian coordinate system, σij is the corresponding stress components; E is Young's Modulus; ν is Poisson's ratio of the material; and σkk = σ1 + σ2 + σ3.

Rearranging eqn (19), we may obtain the expression for stress components as,

 
σij = 2μ*εij + (λεkkβ′Δc)δij (20)
where, image file: c4ra00188e-t22.tif β′ = β(3λ + 2μ*), and εkk = ε1 + ε2 + ε3.

In elasticity, the strain tensor is related to the displacement u by,37

 
image file: c4ra00188e-t24.tif(21)

By neglecting the body forces, the equilibrium equation can be represented as,

 
σij,i = 0, (j = 1, 2, 3) (22)

Substituting eqn (20) and (21) into eqn (22), the displacement equation can be expressed as,38

 
μ*∇2ui + (λ + μ*)uk,kiβ′Δc = 0, (i, k = 1, 2, 3) (23)

Combining eqn (6), (7), (16), and (23), the chemical stress in a SOFC under multi-physicochemical processes can be determined.

3. Model setup, boundary conditions, and mechanical properties

The basic structure of SOFCs is a tri-layer assembly of PEN structure composed of anode electrode, electrolyte, and cathode electrode. The PEN structure should be strong enough to support mechanical loadings. This is usually achieved by using the thickest layer as the supporting layer. In the early stage of SOFC development, both cathode electrode layer and electrolyte layer have been employed as the supporting layer respectively.39 To reduce ohmic loss and polarization loss, the anode-supported SOFCs have been widely used since then.40 Without loss of generality, we consider an anode-supported button cell (Fig. 1a) with La0.6Sr0.4Co0.2Fe0.8O3−δ (LSCF) cathode, Ce0.9Gd0.1O1.95−δ (GDC) electrolyte, and nickel/GDC composite anode. Due to the symmetrical feature, a 2-D axial-symmetrical domain is employed as the computational domain for 3-D button cell. The detailed dimensions are shown in Fig. 1b. Since the considered button cell is relatively small, the isothermal condition is considered. Also because the chemical stress is the major concern in this research, the thermal stress is neglected.
image file: c4ra00188e-f1.tif
Fig. 1 (a) Illustration of SOFC button cell; (b) FEM model of SOFC button cell (dimension unit: μm).

3.1. Concentration boundary conditions

The defect concentration of conducting ceramic materials is determined at the stage when the materials are synthesized. The factors influencing defect concentration may include crystal structure and compositions. Once the material is applied for the device component, the defect concentration is also affected by operating conditions. In particular, the anode electrode is exposed to the atmosphere with extremely low oxygen partial pressure, which in turn significantly affects oxygen vacancy concentration on the anode surface. According to the Nernst equation,41 the reversible voltage Er of an SOFC can be represented as,
 
image file: c4ra00188e-t25.tif(24)

Solving for PO2,a from eqn (24), one may obtain,

 
image file: c4ra00188e-t26.tif(25)
where image file: c4ra00188e-t27.tif is the equilibrium constant. Given the hydrogen and steam partial pressures in the anode, the corresponding oxygen partial pressure can be determined using eqn (25). Then the oxygen deficit at the anode surface can be determined using such an oxygen partial pressure. Accordingly the boundary condition of oxygen vacancy/electron concentration on the anode surface can be obtained.

The oxygen partial pressure in the cathode is in the order of 0.21 atm. In this condition, the nonstoichiometric defect reaction is less likely to happen. Therefore the electrolyte material GDC is treated as a perfect electrolyte material at electrolyte/cathode interface. The corresponding boundary condition of oxygen vacancy/electron concentration is determined by doping level only.

3.2. Other boundary conditions

The ionic flux at the cathode/electrolyte interface is determined by eqn (12). The electronic current leakage at the cathode/electrolyte interface is calculated by integrating surface reaction rate (eqn (15)) over the surface of GDC phase in the anode. The humidified hydrogen is used as the fuel with the composition of H2[thin space (1/6-em)]:[thin space (1/6-em)]H2O[thin space (1/6-em)]:[thin space (1/6-em)]N2 = 0.96[thin space (1/6-em)]:[thin space (1/6-em)]0.03[thin space (1/6-em)]:[thin space (1/6-em)]0.01. The cathode is exposed to ambient air with composition of O2[thin space (1/6-em)]:[thin space (1/6-em)]H2O[thin space (1/6-em)]:[thin space (1/6-em)]N2 = 0.21[thin space (1/6-em)]:[thin space (1/6-em)]0.03[thin space (1/6-em)]:[thin space (1/6-em)]0.76. The equilibrium potential difference of the cathode and anode are determined from experiments, i.e., Δϕeq,c = 0.82 V and Δϕeq,a = 0 V. The boundary conditions for the solid mechanics are illustrated in Fig. 1b. The surface center of the anode is point-fixed so that the chemical stress distribution in the cell will not be affected by mechanical constraints. The boundary conditions are concisely summarized in Table 1.
Table 1 Boundary conditionsa
Boundary Cc/cathode interface Cathode/electrolyte interface Anode/electrolyte interface Cc/anode interface Symmetric axis/other boundaries
a Cc represents current collector.
Ionic flux in LSCF Insulation Eqn (12) Symmetry/insulation
Electronic flux in LSCF 0.82 V Leakage current from GDC Symmetry/insulation
Electronic flux in GDC Specified by GDC doping level Continuum Specified by PO2 of feeding fuel Symmetry/insulation
Ionic flux in GDC Eqn (12) Continuum Insulation Symmetry/insulation
Electronic flux in Ni Insulation 0 V Symmetry/insulation
Mass fraction Air composition Insulation Insulation Fuel composition Symmetry/insulation
Mechanics Free Continuum Continuum Point fixed as shown in Fig. 1b Symmetry/free


3.3. Mechanical property of materials

The anode electrode is a composite porous structure composed of nickel and GDC as well as void phase. The mechanical property of the composite of nickel and GDC is first determined; then the void phase effect is taken into account. Using the composite sphere method42 and treating the inclusion material as the phase 1, the bulk moduli of a composite material can be represented as,
 
image file: c4ra00188e-t28.tif(26)
where the K is the bulk modulus of the material; V is the volume fraction of a material phase in the composite; the subscripts “1” and “2” refer to the two material phases. By switching the role of phase 1 and phase 2 in eqn (26) and treating the phase 2 as the inclusion material, we may obtain another bulk moduli image file: c4ra00188e-t34.tif The practical bulk moduli of the composite will be between image file: c4ra00188e-t35.tif and image file: c4ra00188e-t36.tif In this research, the average bulk modulus is utilized.

The corresponding Young's Modulus of the composite can be represented as,

 
E = 3Kcomp(1 − 2ν) (27)

When the void phase is taken into account, the effective elastic moduli of porous anode can be expressed as,42,43

 
image file: c4ra00188e-t29.tif(28)
here ε is the porosity of the composite; subscript 0 stands for the properties of the dense composite.

The oxygen partial pressure affects oxygen deficits of electrolyte GDC. The oxygen non-stoichiometry in turn strongly influences the mechanical property of GDC. To take this effect into account, the elastic modulus of GDC is expressed as the function of oxygen partial pressure,43

 
EGDC = 255.9 × 10⁹ + 3.31 × 10⁻⁵(−log10[thin space (1/6-em)]pO2)11.11 (29)
here the unit of oxygen partial pressure pO2 is Pa. Other mechanical properties of involved materials are listed in Table 2.

Table 2 Solid mechanical parameters used in the model
Parameters Values
Young's modulus E, Ni/GDC/LSCF43 219/217/161 (GPa)
Poisson's ratio ν, cathode/electrolyte/anode43 0.32/0.334/0.326
Density ρ, Ni/GDC/LSCF43 8900/7150/6820 (kg m−3)
Chemical expansion coefficient β, GDC/LSCF44 1.92 × 10⁻⁶/4.95 × 10−6 (m3 mol−1)
Uniaxial tensile strength σf, GDC/LSCF45–47 250/180 (MPa)


4. Numerical solution and model validation

Combining eqn (6), (7), (16), and (23), we may solve for defect concentration cj, electrical potential ϕ, mass fraction of gas species ωj, and displacement u, as well as their derivatives. Then the chemical stress distribution in the PEN structure can be calculated. The mathematical model is solved using commercial software package of COMSOL Multiphysics 4.1a. The model parameters are listed in Table 3. The boundary conditions are summarized in Table 1. The computational domain was discretized and refined until the mesh-independent solution was obtained. This mesh then was used to obtain the numerical solution. The COMSOL solver (UMFPACK) was utilized to solve the discretized equations. The general coefficient form PDEs were used to implement the charge transport in the electrodes and electrolyte, and the mass transport in porous electrodes. The solid mechanics module was employed to calculate the displacements and their derivatives.
Table 3 Physical parameters used in the modela
Parameters Values
a Note: the parameters with * are adjustable to validate the model with the experimental results.
Atmospheric pressure, P0 1 [atm]
Temperature, T0 700 [°C]
Inlet molar fraction of H2, xref,H2 0.97
Inlet molar fraction of O2, xref,O2 0.21
Tortuosity, anode/cathode, τ* 8.5
Porosity, anode/cathode, ε 0.35
Electronic conductivity, anode, σa 2 × 10⁶ [S m−1]
Exchange current, anode/cathode, i*0 2 × 10³/1.5 × 104 [A m−2]
Specific surface area, anode/cathode, A*v 1 × 10⁵/1.5 × 107 [m−1]
Reaction rate, LSCF/GDC, r (ref. 33, 48 and 49) 6 × 10⁻⁴/1.0 × 10−7 [mol m−2 s−1]
Diameter of spherical particle, anode/cathode, dp 0.35 (μm)
Ionic mobility in GDC, mv (ref. 50) 1.2 × 10⁻¹³ (mol m2 J−1 s−1)
Electronic mobility in GDC, me (ref. 50) 7.26 × 10⁻¹³ (mol m2 J−1 s−1)
Ionic mobility in LSCF, mv (ref. 33) 2.6 × 10⁻¹⁴ (mol m2 J−1 s−1)
Electronic mobility in LSCF, me (ref. 33) 1.4 × 10⁻¹² (mol m2 J−1 s−1)


Model validation is an important step towards further high fidelity numerical analysis. In principle, the model predictions should be able to match experimental results under identical operating conditions, including a variety of parameter distributions, polarization performance. However, it is very difficult for present techniques to measure reactants/products distribution, oxygen vacancy distribution, and stress distribution within an SOFC. Therefore, the measurable polarization performance was used to validate the model. The purpose of this validation is to examine the numerical code and determine the unknown model parameters as indicated in Table 3. For a specified cell voltage at the cathode electrode boundary, the corresponding species distributions and average cell current density were calculated. The cell polarization curve then was obtained by specifying a series of cell voltages and calculating the corresponding average cell current densities. The parameters denoted with “*” in Table 3 were adjusted so that the polarization curves predicted by the model can match with experimental results under identical operating conditions. As shown in Fig. 2, the model predictions match the experimental data reasonably well. The validated model is utilized for further numerical simulations.


image file: c4ra00188e-f2.tif
Fig. 2 Validation of VI curves.

5. Results and discussion

In the following sections, the chemical stress induced by chemical–mechanical coupling in the considered button cell is systematically studied. Upon the chemical stress calculation, the failure probability is analyzed using Weibull theory and elastic energy.

5.1. Distributions of oxygen vacancy site fraction and chemical stress in the cell

In this section, the distribution of oxygen vacancy site fraction in the PEN structure is studied. The operating voltage of the cell is set at 0.4 V as an example, the rest of the operating conditions are listed in Table 3. As shown in Fig. 3a, the oxygen vacancy site fraction decreases from the anode surface towards the anode/electrolyte interface. The regime with high oxygen vacancy site fraction shows relatively large area towards the circumference of the button cell. Since humidified hydrogen is supplied to the anode, the anode is surrounded by the atmosphere with low oxygen partial pressure. Therefore the lattice oxygen would release from GDC to maintain an equilibrium and oxygen vacancy site fraction increases. On the other hand, the oxygen ions transported from the cathode side would fill in some vacancy sites in the anode. Simulation results indicate that the ionic current density in the central area of the button cell is stronger than that in the circumference area. The combinational effects of low oxygen partial pressure and ionic current density lead to non-uniform distribution of oxygen vacancy site fraction.
image file: c4ra00188e-f3.tif
Fig. 3 (a) Oxygen vacancy site fraction in GDC; (b) oxygen vacancy site fraction in LSCF.

The profile of oxygen vacancy site fraction in LSCF phase is shown in Fig. 3b. The two regions are obtained by enlarging the locations at the center and edge of the cathode respectively because the cathode is very thin. Obviously, the oxygen vacancy site fraction shows relatively uniform distribution from the cathode surface towards the cathode/electrolyte interface and maintains at a low fraction of about 0.01. Approaching the cathode/electrolyte interface, the oxygen vacancy site fraction shows a significant increase, and reaches the maximum value of 0.049 or equivalently 1485.5 mol m−3 at the cathode/electrolyte interface adjacent to the circumference of the cathode electrode. It is approximately six times higher than the vacancy site fraction (0.0066) on the surface of the cathode. The abrupt change might be attributed to the combinational effect of two factors. One is that the continuum condition of ionic hopping process has to be maintained at the cathode/electrolyte interface, i.e., the oxygen released from the LSCF should be equal to the oxygen gained by the GDC at the interface. However, the conductivity and the initial oxygen vacancy concentration of LSCF cathode are different from those of GDC. In order to maintain the continuum, the oxygen vacancy site fraction near the cathode/electrolyte interface has to be different from the rest regime within the cathode.

Under the mechanical constraint of point-fixed at the anode surface center (Fig. 1b), the corresponding chemical stress distribution is shown in Fig. 4. Here the magnitude of chemical stress is represented with different colours while the direction is indicated by arrows. The first principal stress is shown in Fig. 4a and the third principal stress is shown in Fig. 4b. Since the thickness of the cathode and electrolyte is very thin compared to the anode substrate, the stress distributions at the center and the circumference of the cathode as well as the circumference of the electrolyte are enlarged in order to clearly observe the details of the stress distributions. As can be seen from Fig. 4a, the first principal stress is relatively uniform. There is a stress concentration area near the intersection point between the cathode circumference and the electrolyte. The maximum first principal stress in the cathode is about 106 MPa while that in the electrolyte is around 142 MPa, which is less than the uniaxial tensile strength of the LSCF (180 MPa) and GDC (250 MPa) respectively. The maximum first principal stress in the anode domain is about 15 MPa.


image file: c4ra00188e-f4.tif
Fig. 4 Principal stress distribution in the cell, (MPa): (a) first principal stress; (b) third principal stress.

The distribution of third principal stress is shown in Fig. 4b. Relatively uniform distribution can be observed except for the cathode/electrolyte interface, where high compressive stress takes place. The maximum third principal stress is −671 MPa in the cathode domain, −530 MPa in the electrolyte domain, and −16 MPa in the anode domain.

The profile of oxygen vacancy site fraction in Fig. 3 clearly shows that oxygen vacancy concentration of LSCF phase at the cathode/electrolyte interface is relatively high, the GDC phase in the bottom part of the anode also shows relatively high oxygen vacancy concentration. The high oxygen vacancy concentration would lead to large volume expansion of bulk materials. However, the large volume expansions in these two locations are constrained by PEN structure assembly, resulting in complicated chemical stress distribution in Fig. 4.

5.2. Deformation and chemical stress of the cell under different mechanical constraints

The non-uniform distribution of oxygen vacancy fraction leads to different chemical expansions in different locations. Depending on specific mechanical constraints, the cell may have different deformations. In this section, the cell deformations are studied under the cell voltage of 0.4 V and three different mechanical constraints (Fig. 5).
image file: c4ra00188e-f5.tif
Fig. 5 Schematic diagram showing different mechanical constraints: (a) point fixed; (b) fixed; (c) roller (CC represent current collector).

The three typical mechanical constraints are schematically illustrated in Fig. 5, which is originated from Atkinson.24 The mechanical constraint in Fig. 5a could occur in a single cell test, in which the sealing material around the edge of supporting anode or current collector has little effect on the deformation of the cell. This mechanical constraint is denoted as point-fixed at the anode surface center. The mechanical constraint in Fig. 5b could take place when a single cell is assembled into a stack. In this situation, the deformation of the cell is almost fully restricted. We denote this mechanical constraint as the fixed. The mechanical constraint in Fig. 5c could be the case, where a single cell is embedded into a stack but the friction force at the anode surface is not strong enough to restrict the deformation of the cell in radial direction. This mechanical constraint is called as roller-supported.

Fig. 6 shows the chemical strain distribution and deformation of the cell. For the mechanical constraint of (a), the regime near the anode circumference and surface has relatively large chemical strain, which cause the cell to bend upwards (Fig. 6a). When the anode surface is mechanically fixed (b), the deformation is shown in Fig. 6b. Obviously the volume of the cell is expanded towards the z-direction and circumference. The regime of circumference shows very high chemical strains. With the mechanical constraint of (c), the volume of the cell expands in r-direction. One may see the fact that the stronger mechanical constraint leads to smaller chemical strains.


image file: c4ra00188e-f6.tif
Fig. 6 Deformation under different mechanical constraints (μm): (a) point fixed; (b) fixed; (c) roller.

The corresponding chemical stress distributions are shown in Fig. 7. Here the horizontal-axis is defined from the center of the anode surface towards the center of the cathode surface along z-direction, in which 0–700 μm is the anode domain, 700–710 μm is the electrolyte domain, and the cathode domain is beyond 710 μm. The vertical-axis is the first principal stress (Fig. 7a) and the third principal stress (Fig. 7b) respectively. With the mechanical constraint of (a), the maximum first principal stress reaches 15 MPa in the anode domain, the maximum third principal stress reaches −177 MPa at the electrolyte/cathode interface. When the anode surface is fully fixed (constraint (b)), the first principal stress is relatively low and reaches the maximum value of 10 MPa in the anode domain. The third principal stress shows significant variations along the axial-symmetrical line. Near the anode surface, the third principal stress reaches −118 MPa and decreases towards the electrolyte. At the electrolyte/cathode interface, it shows an abruptly increases and reaches −174 MPa and then rapidly decreases to a relatively low value in the cathode domain. Under the mechanical constraint of (c), the first principal stress gradually increases from the middle point of the anode towards the electrolyte, and has an abrupt increase from 46 MPa to 139 MPa at the anode/electrolyte interface. At the electrolyte/cathode interface, the first principal stress shows an abrupt decrease from 139 MPa to −11 MPa. Beyond the electrolyte/cathode interface, the first principal stress increases and reaches to 35 MPa in the cathode. The corresponding third principal stress shows a large compressive value of −71 MPa near the anode surface and gradually decreases to 0 MPa in the rest of the anode domain and the electrolyte. The third principal stress suddenly increases to −160 MPa at the electrolyte/cathode interface and then gradually reduces to 0 MPa in the cathode. Obviously the mechanical constraints have significant effects on chemical stress distribution. In above three cases, the electrolyte/cathode interface shows an abrupt change of the third principal stress with relatively high magnitude.


image file: c4ra00188e-f7.tif
Fig. 7 Parameter profiles along the axis of symmetry under different mechanical constrains: (a) first principal stress, (MPa); (b) third principal stress, (MPa).

The stress extremes in each domain under three mechanical constraints are summarized in Table 4. For the point-fixed case (a), the maximum tensile stress (106.5 MPa) occurs in the cathode and the maximum compressive stress (−671 MPa) also occurs in the cathode. For the roller constraint case, the maximum tensile stress (310.7 MPa) takes place in the electrolyte while the maximum compressive stress (−364.2 MPa) takes place in the cathode. When the anode surface is fixed, the maximum tensile stress (154.4 MPa) is generated in the electrolyte while the maximum compressive stress (−1372.5 MPa) is generated in the anode. Obviously the fully relaxed mechanical boundary condition may facilitate to reduce the maximum chemical stress generated in the cell.

Table 4 Stress extremes for mechanical constraints
Stress extreme, (MPa) Point fixed Roller Fixed
Max_cathode 106.5 153.4 111.33
Max_electrolyte 142 310.7 154.4
Max_anode 16.5 73.8 61.1
Min_cathode −671 −364.2 −639.5
Min_electrolyte −530.5 −145.7 −491.65
Min_anode −16.6 −72.8 −1372.5


According to above numerical results, one can see that the chemical stress in a single cell is attributed to two factors. One is the volumetric expansions of bulk materials induced by non-uniform oxygen vacancy concentration distribution; another one is mechanical constraint applied on the cell. To highlight the chemical stress induced by non-uniform oxygen vacancy concentration distribution while minimizing the effect of mechanical constraints, the point-fixed constraint (Fig. 5a) is employed throughout the paper unless otherwise indicated.

5.3. Chemical stress under different operating conditions

The oxygen vacancy concentration distribution in SOFCs is determined by operating conditions and involved multi-physicochemical processes. Accordingly the chemical stress occurred in the PEN structure is also significantly affected by these conditions. In this section, the chemical stress under different operating conditions is systematically studied.
5.3.1. Cell potential effect on chemical stress. Shown in Fig. 8a and b are the oxygen vacancy site fraction distributions along the axial-symmetrical line of the cell. Obviously the oxygen vacancy site fraction decreases from the anode surface towards the electrolyte. Similar trend can be observed from the electrolyte/cathode interface towards the cathode surface. It is known that oxygen is incorporated into the LSCF matrix at the cathode electrode and transported towards the anode electrode through the electrolyte. At the anode electrode, the mobile oxygen ions in the vacancies at the GDC surface are released through electrochemical reactions; the lattice oxygen in the GDC anode could also get lost due to low oxygen partial pressure in the anode. Combining these factors together, it is not difficult to understand that the oxygen vacancy site fraction increases from the cathode towards the anode. It is interesting to note that the overall oxygen vacancy site fraction distribution in the anode–electrolyte regime increases with increasing the applied cell voltage, however, that in the cathode domain shows an opposite trend. When the applied cell voltage is high, the corresponding cell current is low. Accordingly the oxygen ionic current from the cathode to the anode is reduced. In other words, the number of mobile oxygen vacancies transported from the anode to the cathode is decreased. Therefore the oxygen vacancy site fraction increases in the anode but decreases in the cathode when the applied cell potential is increased.
image file: c4ra00188e-f8.tif
Fig. 8 Parameter profiles along the axis of symmetry under different operating potentials: (a) oxygen vacancy site fraction in GDC, (b) oxygen vacancy site fraction in LSCF; (c) first principal stress, (MPa); (d) third principal stress, (MPa).

The non-uniform oxygen vacancy site fraction distribution leads to the fact that different locations in PEN assembly have different volumetric chemical expansions. The strains induced by chemical expansion are also confined with one another within PEN structure assembly, resulting in complicated chemical stress distribution. As shown in Fig. 8c, the first principal chemical stress shows two peak values, which are located within the anode electrode and at the cathode/electrolyte interface respectively. The third principal chemical stress shows a peak value at the electrolyte/cathode interface (Fig. 8d). Both the first and third principal stress increases with decreasing the applied cell voltage from 0.6 V to 0.2 V.

To systematically study the applied cell voltage effects, the maximum first and third principal stress in each layer of PEN assembly are plotted in Fig. 9. The solid line represents the maximum first principal stress while the dashed line denotes the maximum third principal stress. With increasing the applied cell voltage, the maximum first and third principal stresses in the electrolyte and cathode domains decrease, however, those in the anode domain shows negligible variations. It is interesting to note that the maximum first principal stress (tensile) in the electrolyte domain is greater than that in the cathode domain, while the maximum third principal stress (compressive stress) in the cathode domain is higher than that in the electrolyte domain. These observations indicate that the electrolyte tends to fail under tensile stress while the cathode tends to fail under compressive stress.


image file: c4ra00188e-f9.tif
Fig. 9 Stress extremes in each domain, (MPa).
5.3.2. Effect of fuel composition. The fuel composition in the anode affects oxygen partial pressure, which in turn affects the oxygen vacancy boundary condition in the anode and oxygen vacancy site fraction distribution in the PEN assembly. Therefore the fuel composition would influence chemical stress occurred in SOFC. In this section, the fuel composition effect is studied. The applied cell voltage is set at 0.4 V as an example. The hydrogen is used as the fuel with nitrogen as the balance gas in the anode. As shown in Fig. 10, with increasing the molar fraction of hydrogen from 0.76 to 0.96, the oxygen vacancy site fraction shows a slight increase in both the anode and cathode domains. Because of these slight variations, it is anticipated that the chemical stress variation will not be obvious. As shown in Fig. 11, with increasing molar fraction of hydrogen, the maximum first principal stress demonstrates a slight increase (solid lines), e.g., from 15 MPa to 16 MPa in the anode domain, from 133 MPa to 142 MPa in the electrolyte domain, and from 99 MPa to 106 MPa in the cathode domain. The maximum third principal stress also shows a slight increase (dashed lines), e.g., from −15 MPa to −16 MPa in the anode, from −499 MPa to −530 MPa in the electrolyte, and from −631 MPa to −671 MPa in the cathode respectively.
image file: c4ra00188e-f10.tif
Fig. 10 Parameter profiles along the axis of symmetry with different fuel compositions: (a) oxygen vacancy site fraction in GDC, (b) oxygen vacancy site fraction in LSCF.

image file: c4ra00188e-f11.tif
Fig. 11 Stress extremes in each domain, (MPa).

5.4. Porous electrode effects on chemical stress

Porous electrodes are composed of solid phase and void phase. The void phase in the electrodes affects not only reactant/product gas diffusion but also mechanical property, e.g., Young's modulus, effective chemical expansion coefficient. In this section, the effects of porosity and tortuosity of electrodes on chemical stress will be studied. The applied cell voltage is still set at 0.4 V as an example.
5.4.1. Porosity effects. To simplify numerical analysis, the porosity of anode electrode is assumed to be the same as that of cathode electrode. With increasing the porosity from 0.2 to 0.5, the oxygen vacancy site fraction shows a slight increase within the anode (150–650 μm, Fig. 12a) and an obvious increase within the regime of 710–715 μm in the cathode (Fig. 12b). This observation indicates that more mobile oxygen ions are transported from the cathode side to the anode side, generating more oxygen vacancy site fraction. The high porosity renders the fuel/gas diffusion easy and improves electrochemical reactions. The enhanced electrochemical reactions consume more oxygen ions in the anode electrode. Therefore more oxygen ions are transported from the cathode side to the anode, which is consistent with above observation.
image file: c4ra00188e-f12.tif
Fig. 12 Parameter profiles along the axis of symmetry with different porosities of the electrodes: (a) oxygen vacancy site fraction in GDC, (b) oxygen vacancy site fraction in LSCF; (c) first principal stress, (MPa); (d) third principal stress, (MPa).

The corresponding chemical (first and third principal) stress distributions are shown in Fig. 12c and d. With relative high porosity of 0.5, the first principal stress is pretty low. When the porosity is decreased from 0.5 to 0.2, the first principal stress in the anode domain shows the maximum value of −30 MPa in the range of 0–150 μm and then becomes a tensile state with the maximum value of 30 MPa in the range of 160–600 μm. Near the electrolyte/cathode interface, the first principal stress rapidly increases and reaches a peak value at the interface, and then gradually decreases to zero towards the cathode surface. The third principal stress (Fig. 12d) shows relatively low values in the PEN assembly except for those at the electrolyte/cathode interface, where extremely high compressive stress occurs. With decreasing the porosity from 0.5 to 0.2, the peak value of the third principal stress increases from −100 MPa to −225 MPa at the interface. The high porosity could reduce the effective expansion coefficient and Young's modulus of electrodes. Therefore the stress in the PEN assembly can be mitigated by the high porosity. It is worth mentioning that the anode electrode is much thicker than the electrolyte and cathode in the anode-supported button cell. The anode plays a dominant role on affecting chemical stress distribution in the PEN assembly.

The more systematic results are shown in Fig. 13, where the left and right vertical axis represent the first and third principal stress extremes respectively in the anode, electrolyte, and cathode domains. With increasing the porosity from 0.2 to 0.5, the first principal stress extreme (solid line) decreases from 201 MPa to 78 MPa in the electrolyte, from 173 MPa to 50 MPa in the cathode, and from 38 MPa to 5 MPa in the anode. The third principal stress extreme reduces from −848 MPa to −258 MPa in the electrolyte, from −1068 MPa to −331 MPa in the cathode, and from −48 MPa to −5 MPa in the anode respectively. It is easy to observe that the maximum first principal stress extreme takes place in the electrolyte while the maximum third principal stress extreme occurs in the cathode.


image file: c4ra00188e-f13.tif
Fig. 13 Stress extremes in each domain, (MPa).
5.4.2. Tortuosity effects. The tortuosity is an important parameter characterizing the porous electrode property for gas diffusion. Fig. 14 shows the tortuosity effects on principal stress extremes in the PEN assembly. With increasing the tortuosity from 7 to 10, the first principal stress extreme decreases from 146 MPa to 137 MPa in the electrolyte, from 107 MPa to 105 MPa in the cathode, and the stress in the anode exhibits a slight increase from 15 MPa to 17 MPa. Similarly the maximum third principal stress reduces from −540 MPa to −521 MPa in the electrolyte, from −680 MPa to −662 MPa in the cathode, and the stress in the anode slightly increases from −16.7 MPa to −17.9 MPa. Compared to the porosity effect, the tortuosity effect is negligible.
image file: c4ra00188e-f14.tif
Fig. 14 Stress extremes in each domain, (MPa).

5.5. Anode thickness effect on chemical stress

In anode-supported SOFC designs, the anode electrode is relatively thick. Therefore the anode plays an important role on determining the deformation and chemical stress in the concerned button cells. In this section, the anode thickness is varied while the corresponding chemical stress is examined. The results are shown in Fig. 15. Since the thickness of anode is different in each case, the horizontal-axis is normalized in order to obtain convenient comparisons, e.g., anode domain: 0–1, electrolyte domain: 1–2, and cathode domain: 2–3. With increasing the thickness of anode, the oxygen vacancy site fraction shows a slight decrease in the PEN assembly along the axial-symmetrical line (Fig. 15a and b). The corresponding first principal stress demonstrates two peak values, which are located at the middle of anode and cathode/electrolyte interface respectively. The peak value increases with increasing the thickness of the anode (Fig. 15c). The third principal stress in the electrolyte domain increases with increasing the anode thickness (Fig. 15d). Interestingly, the third principal stress decreases at the electrolyte/cathode interface when the anode thickness is increased (Fig. 15d).
image file: c4ra00188e-f15.tif
Fig. 15 Parameter profiles along the normalized axis of symmetry with different anode thicknesses: (a) oxygen vacancy site fraction in GDC, (b) oxygen vacancy site fraction in LSCF; (c) first principal stress, (MPa); (d) third principal stress, (MPa).

The more systematic results are shown in Fig. 16. With increasing the anode thickness from 500 μm to 1000 μm, the first principal stress extreme (solid line) decreases from 160 MPa to 123 MPa in the electrolyte domain and from 116 MPa to 96 MPa in the cathode domain, but increases from 12 MPa to 19 MPa in the anode domain. The third principal stress extreme (dashed line) decreases from −553 MPa to −505 MPa in the electrolyte domain and from −709 MPa to −630 MPa in the cathode domain, but increases from −15 MPa to −21 MPa in the anode domain. Therefore high anode thickness in the anode-supported SOFCs favors decreasing the chemical stress in electrolyte and cathode domain.


image file: c4ra00188e-f16.tif
Fig. 16 Stress extremes in each domain, (MPa).

5.6. Failure probability analysis with tensile chemical stress

Ceramics especially porous ceramics are brittle materials in nature and exhibit a statistical strength scatter due to preexisting cracks in bulk materials. To obtain high fidelity analysis under complicated chemical stress conditions, we need to consider both average material strength and the degree of strength scatter. This can be achieved by using Weibull failure analysis approach.51 For a bulk material subject to a uniaxial tensile stress σ, the survival probability can be calculated as,
 
image file: c4ra00188e-t30.tif(30)
where V represents the volume of concerned bulk ceramics; the characteristic strength σ0 denotes the stress level at which the survival probability is 36.8%; the m is the Weibull modulus controlling the degree of strength scatter, a large value of m indicates a small scatter while a low value of m corresponds to a large degree of scatter; the term V0 is a reference volume linked to the characteristic strength σ0.

As demonstrated above, each of component layers in the button cell is subjected to multi-axial chemical stresses. If we assume that the three principal stresses play independent role on fractural failure of the cell, the total survival probability for each layer of PEN structure assembly can be calculated as the product of the survival probability determined from each of the three principal stresses,

 
image file: c4ra00188e-t31.tif(31)
where j denotes the anode, electrolyte, or cathode layer; i = 1, 2, 3 represents three principal stresses. The failure probability then can be determined by subtracting the survival probability from 1.

With the Weibull approach, the failure probability of the button cell will be studied under different operating conditions based on chemical stress calculations in previous sections. The properties of SOFC materials associated with Weibull analysis are listed in Table 5. Fig. 17 shows the logarithm of failure probability of anode, electrolyte, and cathode layers under different cell voltages and hydrogen molar fractions in the fuel. With increasing the cell voltage from 0.2 V to 0.7 V, the failure probability decreases from 10−4.2 to 10−8.3 for the electrolyte layer, from 10−4 to 10−8 for the anode layer, and 10−4.4 to 10−7.7 for the cathode layer (Fig. 17a). While increasing the hydrogen molar fraction in the fuel from 0.76 to 0.96, the failure probability increases from 10−5.6 to 10−5.3 for the electrolyte layer, from 10−5 to 10−4.7 for the anode layer, and from 10−5.4 to 10−5.3 for the cathode layer (Fig. 17b). Therefore high cell operating voltage and low hydrogen content in the fuel may improve the reliability of button cell. However these may in turn decrease energy conversion efficiency of the cell.

Table 5 Weibull parameters of SOFC materials considered
Domain Weibull modulus, m Characteristic strength, σ0, (MPa) Reference volume, V0, (mm3)
GDC 5.7 (ref. 47) 183.0 (ref. 47) 0.575 (ref. 47)
LSCF 4.1 (ref. 47) 120 (ref. 47) 1.00 (ref. 52)


image file: c4ra00188e-f17.tif
Fig. 17 Logarithm of failure probability in each domain as a function of: (a) operating voltage of the cell (V); (b) molar fraction of hydrogen.

Fig. 18 shows the effect of porous electrode property on failure probability. With increasing the porosity of electrodes from 0.2 to 0.5, the failure probability decreases approximately from 10−4.5 to 10−6.8 for the electrolyte and cathode, and from 10−2.6 to 10−7.7 for the anode (Fig. 18a). Below the porosity of 0.4, the anode is a vulnerable component; while above the porosity of 0.4, the electrolyte and cathode become vulnerable components. When the tortuosity of electrode is increased from 7 to 10, the failure probability decreases from 10−5.3 to 10−5.5 for the electrolyte and from 10−5.2 to 10−5.3 for the cathode, however, that of the anode increases from 10−5 to 10−4.6.


image file: c4ra00188e-f18.tif
Fig. 18 Logarithm of failure probability in each domain as a function of: (a) porosity; (b) tortuosity.

The thickness effect of each layer in PEN structure assembly on failure probability is shown in Fig. 19. Here the failure probability is calculated by varying the thickness of one layer while keeping the thickness of other two layers unchanged. With increasing the anode thickness from 500 μm to 900 μm (Fig. 19a), the failure probability decreases from 10−5 to 10−5.8 for the electrolyte and from 10−5 to 10−5.4 for the cathode; however this causes the increase of the anode failure probability from 10−5.6 to 10−4.2. When the cathode increases from 10 μm to 30 μm, the failure probability of the anode, electrolyte, cathode layers shows negligible variation (Fig. 19b). Similarly the failure probability of each layer in the PEN structure assembly is not sensitive to the variation of the electrolyte thickness (Fig. 19c). Therefore, the anode thickness plays an important role on determining the failure probability in the anode-supported button cell.


image file: c4ra00188e-f19.tif
Fig. 19 Logarithm of Failure probability in each domain as a function of: (a) anode thickness (μm); (b) cathode thickness, (μm); (c) electrolyte thickness, (μm).

5.7. Delamination failure analysis with elastic energy

The Weibull approach can only take the tensile stress into account and is not able to handle the compressive stress. In the anode-supported SOFCs, the electrolyte layer and cathode layer are very thin. The delamination failure at the cathode/electrolyte interface is one of the typical failure modes for SOFCs.24 According to previous analysis, the cathode layer is subjected to compressive stress (the third principal stress) with significant magnitude. The compressive stress could contribute significantly to the elastic energy stored in the cathode layer, which in turn may have significant effect on delamination failure of the cathode/electrolyte interface. In this section, elastic energy stored in the thin cathode layer due to stress/strain is determined to analyze the delamination failure. Given the stress/strain generated in the cathode layer, the overall stored elastic energy can be calculated by,
 
image file: c4ra00188e-t33.tif(32)
here the σ and ε represent stress and strain respectively.

Since the cathode/electrolyte interface is the only boundary confining the deformation of the cathode, the total stored elastic energy in the cathode layer will play an important role on the delamination failure of the cathode/electrolyte interface. If the elastic energy is greater than the critical energy, the delamination would occur. Fig. 20 shows the variations of elastic energy stored in the cathode layer under different operating conditions. As shown in Fig. 20a, the operating voltage demonstrates significant effect on elastic energy of cathode layer: decreasing from 0.21 J m−2 to 0.01 J m−2 with increasing the voltage from 0.2 V to 0.7 V; the effect of hydrogen molar fraction is negligible. Fig. 20b clearly indicates that the elastic energy is reduced from 0.36 J m−2 to 0.02 J m−2 when the porosity of electrodes increases from 0.2 to 0.5; the variation of electrode tortuosity doesn't lead to obvious change of elastic energy. Fig. 20c shows the thickness effect of each layer. With increasing the anode thickness from 500 μm to 1000 μm, the elastic energy increases from 0.07 J m−2 to 0.15 J m−2. When the cathode thickness increases from 10 μm to 35 μm, the elastic energy is increased from 0.1 J m−2 to 0.14 J m−2. However, increasing the electrolyte thickness leads to the decrease of elastic energy from 0.12 J m−2 to 0.07 J m−2. Therefore, relatively thinner anode and cathode, and thicker electrolyte can mitigate probability of delamination failure at the cathode/electrolyte interface in anode-supported SOFCs. Given the critical bonding energy of 4 J m−2 at the cathode/electrolyte interface,24 none of above cases can lead to the delamination failure at the cathode/electrolyte interface.


image file: c4ra00188e-f20.tif
Fig. 20 Elastic energy in cathode, (J m−2), as a function of: (a) operating conditions; (b) property of the porous electrodes; (c) thickness of each domain.

6. Conclusions

A comprehensive model is developed to study chemical–mechanical coupling phenomenon in an anode-supported SOFC. The model for the first time links oxygen ionic transport process with chemical stress generated in the PEN structure assembly of a button cell under multi-physicochemical operating conditions. This is an important module complementary to the state-of-the-art electrochemical–thermal–mechanical modeling of SOFCs. The model is partially validated using the measured polarization performance, upon which systematic simulations are carried out. Results show that multi-physicochemical operating conditions lead to non-uniform distribution of oxygen vacancy site fraction in the PEN assembly. Different oxygen vacancy concentration causes different volumetric expansion of bulk material. Therefore chemical stress occurs in PEN assembly. The chemical stress distribution is also strongly dependent on mechanical constraints applied on the cell. Without mechanical constraint, the peak value of the first principal stress occurs within the anode electrode and at the cathode/electrolyte interface; the third principal stress shows a peak value at the cathode/electrolyte interface. The chemical stress particularly the peak values of the first and third principal stress can be mitigated by increasing the cell operating voltage (i.e. decreasing cell current). The hydrogen molar fraction in the fuel shows slight effect on chemical stress. The porosity of electrodes shows significant effects on chemical stress. Bigger porosity can significantly decrease the extremes of first and second principal stresses in PEN assembly. The effect of electrode tortuosity is negligible on chemical stress. Larger anode thickness in the anode-supported SOFCs increases the chemical stress in the anode electrode but favors decreasing the chemical stress in electrolyte and cathode domain. The Weibull analysis shows that high cell operating voltage and low hydrogen content in the fuel may mitigate failure probability of PEN assembly. With relatively low electrode porosity, the anode electrode is a vulnerable component in the anode-supported button cell; with relatively high electrode porosity, the electrolyte and cathode layer become vulnerable components. Large anode thickness can mitigate failure probability of electrolyte and cathode layer but increase anode failure probability. The failure probability is not sensitive to the thickness variations of electrolyte and cathode layers. Relatively thinner anode and cathode, and thicker electrolyte as well as high operating cell voltage can reduce the elastic energy stored in the cathode layer and therefore mitigate the probability of delamination failure at the cathode/electrolyte interface in anode-supported SOFCs.

Acknowledgements

The authors gratefully acknowledge the National Science Foundation for financial support under grant no. CMMI-1100085.

Notes and references

  1. R. M. Ormerod, Chem. Soc. Rev., 2003, 32, 17–28 RSC.
  2. S. P. S. Badwal, Solid State Ionics, 2001, 143, 39–46 CrossRef CAS.
  3. T. Klemenso, C. C. Appel and M. Mogensen, Electrochem. Solid-State Lett., 2006, 9, A403–A407 CrossRef.
  4. T. Klemenso, C. Chung, P. H. Larsen and M. Mogensen, J. Electrochem. Soc., 2005, 152, A2186–A2192 CrossRef.
  5. J. Malzbender, E. Wessel and R. W. Steinbrech, Solid State Ionics, 2005, 176, 2201–2203 CrossRef CAS.
  6. I. M. Hung, H. W. Peng, S. L. Zheng, C. P. Lin and J. S. Wu, J. Power Sources, 2009, 193, 155–159 CrossRef CAS.
  7. H. S. Song, J. H. Min, J. Kim and J. Moon, J. Power Sources, 2009, 191, 269–274 CrossRef CAS.
  8. H. Yokokawa, H. Y. Tu, B. Iwanschitz and A. Mai, J. Power Sources, 2008, 182, 400–412 CrossRef CAS.
  9. H. Y. Chen, H. C. Yu, J. S. Cronin, J. R. Wilson, S. A. Barnett and K. Thornton, J. Power Sources, 2011, 196, 1333–1337 CrossRef CAS.
  10. O. Razbani, I. Waernhus and M. Assadi, Appl. Energy, 2013, 105, 155–160 CrossRef CAS.
  11. T. L. Jiang and M. H. Chen, Int. J. Hydrogen Energy, 2009, 34, 8223–8234 CrossRef CAS.
  12. L. Liu, G. Y. Kim and A. Chandra, J. Power Sources, 2010, 195, 2310–2318 CrossRef CAS.
  13. A. Nakajo, Z. Wuillemin, J. Van Herle and D. Favrat, J. Power Sources, 2009, 193, 203–215 CrossRef CAS.
  14. A. Selimovic, M. Kemm, T. Torisson and M. Assadi, J. Power Sources, 2005, 145, 463–469 CrossRef CAS.
  15. M. Peksen, Int. J. Hydrogen Energy, 2013, 38, 13408–13418 CrossRef CAS.
  16. F. L. Lowrie and R. D. Rawlings, J. Eur. Ceram. Soc., 2000, 20, 751–760 CrossRef CAS.
  17. S. Vaidya and J. H. Kim, J. Power Sources, 2013, 225, 269–276 CrossRef CAS.
  18. R. Clague, A. J. Marquis and N. P. Brandon, J. Power Sources, 2012, 210, 224–232 CrossRef CAS.
  19. M. Peksen, A. Al-Masri, L. Blum and D. Stolten, Int. J. Hydrogen Energy, 2013, 38, 4099–4107 CrossRef CAS.
  20. M. A. Khaleel, Z. Lin, P. Singh, W. Surdoval and D. Collin, J. Power Sources, 2004, 130, 136–148 CrossRef CAS.
  21. S. B. Adler, J. Am. Ceram. Soc., 2001, 84, 2117–2119 CrossRef CAS.
  22. K. L. Duncan, Y. L. Wang, S. R. Bishop, F. Ebrahimi and E. D. Wachsman, J. Am. Ceram. Soc., 2006, 89, 3162–3166 CrossRef CAS.
  23. K. L. Duncan, Y. L. Wang, S. R. Bishop, F. Ebrahimi and E. D. Wachsman, J. Appl. Phys., 2007, 101, 044906 CrossRef.
  24. A. Atkinson, Solid State Ionics, 1997, 95, 249–258 CrossRef CAS.
  25. R. Krishnamurthy and B. W. Sheldon, Acta Mater., 2004, 52, 1807–1822 CrossRef CAS.
  26. N. Swaminathan, J. Qu and Y. Sun, Philos. Mag., 2007, 87, 1705–1721 CrossRef CAS.
  27. N. Swaminathan, J. Qu and Y. Sun, Philos. Mag., 2007, 87, 1723–1742 CrossRef CAS.
  28. H. Yakabe, M. Hishinuma and I. Yasuda, J. Electrochem. Soc., 2000, 147, 4071–4077 CrossRef CAS.
  29. K. Terada, T. Kawada, K. Sato, F. Iguchi, K. Yashiro, K. Amezawa, M. Kubo, H. Yugami, T. Hashida, J. Mizusaki, H. Watanabe, T. Sasagawa and H. Aoyagi, ECS Trans., 2011, 35, 923–933 CAS.
  30. X. Jin and X. Xue, J. Electrochem. Soc., 2013, 160, F815–F823 CrossRef CAS.
  31. N. Swaminathan and J. Qu, Fuel Cells, 2007, 7, 453–462 CrossRef CAS.
  32. D. S. Mebane and M. L. Liu, J. Solid State Electrochem., 2006, 10, 575–580 CrossRef CAS.
  33. D. S. Mebane, Y. J. Liu and M. L. Liu, J. Electrochem. Soc., 2007, 154, A421–A426 CrossRef CAS.
  34. J. A. Kilner, R. A. DeSouza and I. C. Fullarton, Solid State Ionics, 1996, 86–88, 703–709 CrossRef CAS.
  35. W. G. Bessler, S. Gewies and M. Vogler, Electrochim. Acta, 2007, 53, 1782–1800 CrossRef CAS.
  36. W. D. He, J. Zou, B. Wang, S. Vilayurganapathy, M. Zhou, X. Lin, K. H. L. Zhang, J. H. Lin, P. Xu and J. H. Dickerson, J. Power Sources, 2013, 237, 64–73 CrossRef CAS.
  37. S. P. Timoshenko and J. N. Goodier, Theory of Elasticity, McGraw-Hill, New York, 1970 Search PubMed.
  38. N. Noda, R. B. Hetnarski and Y. Tanigawa, Thermal Stresses, Taylor & Francis, New York, 2003 Search PubMed.
  39. N. Q. Minh, Solid State Ionics, 2004, 174, 271–277 CrossRef CAS.
  40. H. P. Buchkremer, U. Diekmann, L. G. J. de Haart, H. Kabs, U. Stimming and D. Stover, in Electrochemical Proceedings, The Electrochemical Society, Inc., 1997, pp. 160–170 Search PubMed.
  41. G. A. Prentice, Electrochemical Engineering Principles, Prentice Hall, Upper Saddle River, New Jersey, 1991 Search PubMed.
  42. Z. Hashin and S. Shtrikman, J. Mech. Phys. Solids, 1963, 11, 127–140 CrossRef.
  43. M. F. Serincan, U. Pasaogullari and N. M. Sammes, J. Power Sources, 2010, 195, 4905–4914 CrossRef CAS.
  44. S. R. Bishop, K. Duncan and E. D. Wachsman, ECS Trans., 2006, 1, 13–21 CAS.
  45. A. Atkinson and A. Selcuk, Solid State Ionics, 2000, 134, 59–66 CrossRef CAS.
  46. Y. H. Du, N. M. Sammes, G. A. Tompsett, D. L. Zhang, J. Swan and M. Bowden, J. Electrochem. Soc., 2003, 150, A74–A78 CrossRef CAS.
  47. A. Nakajo, J. Kuebler, A. Faes, U. F. Vogt, H. J. Schindler, L. K. Chiang, S. Modena, J. Van Herle and T. Hocker, Ceram. Int., 2012, 38, 3907–3927 CrossRef CAS.
  48. J. A. Lane and J. A. Kilner, Solid State Ionics, 2000, 136, 927–932 CrossRef.
  49. M. E. Lynch, L. Yang, W. T. Qin, J. J. Choi, M. F. Liu, K. Blinn and M. L. Liu, Energy Environ. Sci., 2011, 4, 2249–2258 CAS.
  50. K. L. Duncan and E. D. Wachsman, J. Electrochem. Soc., 2009, 156, B1030–B1038 CrossRef CAS.
  51. W. Weibull, J. Appl. Mech., 1951, 18, 293–297 Search PubMed.
  52. G. Anandakumar, N. Li, A. Verma, P. Singh and J. H. Kim, J. Power Sources, 2010, 195, 6659–6670 CrossRef CAS.

This journal is © The Royal Society of Chemistry 2014