Somrita Mondal,
Debasmita Ghosh,
Chandra Nath Roy and
Abhijit Saha*
UGC-DAE Consortium for Scientific Research, Kolkata Centre, III/LB-8 Bidhannagar, Kolkata 700 098, India. E-mail: abhijit@alpha.iuc.res.in; Fax: +91-33-23357008; Tel: +91-33-23351866
First published on 24th January 2014
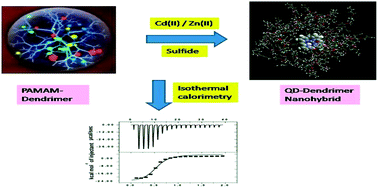
The synthesis of inorganic–organic hybrid nanomaterials has attracted considerable interest in recent years because of their multifaceted applications, such as in optoelectronics, cellular imaging, drug delivery, etc. The maneuvering of controlling parameters is key to the successful fabrication of good quality materials. However, the fundamental aspects pertaining to the thermodynamics of growth of such nano hybrid materials has so far not been unraveled. Here, we have investigated the energetics behind the formation of semiconductor–dendrimer nanohybrid materials using isothermal calorimetry. It is apparent from the observed energy release profile that the heat change for the formation of nanoclusters in phase II saturates faster with an increase in starting materials or monomer concentrations. We have also shown variation of the thermodynamic parameters with changes in the synthesis conditions, such as temperature, dendrimer generation and dendrimer core or surface groups. Based on a bi-phasic thermogram and the dependence of thermodynamic parameters on the dendrimer core and surface functionalities, it is suggested that nanoparticles are formed inside dendrimer molecules in the initial time period and on the outer surface at a longer time scale. Furthermore, it is observed that the formation of quantum dot–dendrimer hybrid materials is an exothermic, spontaneous and enthalpy driven process. Also, a lower temperature thermodynamically favors formation in the core of dendrimer molecules leading to smaller particles with a narrower distribution. The observed results suggest that higher values of formation constant and enthalpy are likely to make dendrimers of higher generation better templates for the synthesis of nanoparticles. The dependence of the ratio of concentrations of reacting metal ions (Cd or Zn) to sulfide ions shows a differential size pattern for CdS and ZnS nanoparticles, which has been interpreted in terms of binding constants determined calorimetrically. It is shown that enthalpy–entropy compensation takes place in the synthesis process affording favorable free energy. Such investigation can provide useful guidelines for the synthesis of better quality semiconductor–dendrimer hybrid nanomaterials.
Our research group has been developing one-pot non-injection approaches to fabricate good quality Group II–VI quantum dots, such as CdS, ZnS, CdTe, CdSe, ZnTe, etc. for various biological applications.8–12 Extending our approach to include dendrimer mediated synthesis, previously we have established how manipulating the conditions could enable the production of nanoparticles with controlled size and distribution.8,13 This has prompted us to investigate how the variation of synthesis conditions can influence the thermodynamics of formation of dendrimer encapsulated CdS or ZnS quantum dots,14 which, in turn, can control the size and distribution of the as-synthesized particles.
Isothermal Titration Calorimetry (ITC) is a very sensitive and accurate technique to monitor thermodynamics. This technique has been extensively/primarily used to look into the thermodynamics of different interactions of biomolecular systems, such as drug–DNA interactions, metal–protein, protein–protein, etc.15–17 Recently, this technique has been applied to understand the complex interactions between nanoparticles and protein molecules.18 However, little attention has been paid to understanding the energetics of the formation of nanoparticles. There have been a few calorimetric studies on interactions between two sets of metallic nanoparticles leading to the formation of bimetallic metal particles.19 The change in enthalpy in the formation of metal nanoparticles has been investigated by several groups.20–23 In the majority of these studies, the nature of the heat of reactions (exothermic, endothermic or mixed) during the formation of the nanoparticles has been monitored. However, the thermodynamics of formation of semiconductor CdS nanoparticles has been reported recently by Jiang et al.24 In that study, the formation of CdS nanoparticles without capping groups was followed in two solvents. Therefore, there has been a need for a more comprehensive thermodynamic study on the evolution of nanoparticles in real synthesis terms. In recent years, there has been a strong demand for developing synthesis methodologies for functional materials for various biological applications. This has spurred our interest to investigate the thermodynamics of the formation of dendrimer encapsulated semiconductor nanocrystals and to explore its possible implications in the size and distribution of as-synthesized particles. In the present study, CdS and ZnS have been taken as model luminescent semiconducting materials because their characteristics have been widely studied.
Microcalorimetry provided the total heat content of the formation of CdS or ZnS nanocrystals in the dendrimer matrix comprising the steps of supersaturation, nucleation and growth. We have obtained the thermodynamic parameters (n, K, ΔH, ΔS, and ΔG) for the formation reaction under different synthesis conditions. It is well known that the unique properties of nanoparticles arise particularly from the size and distribution of the synthesized nanocrystals. Thus, we have endeavored to look into the possible relationship of the energetics of these characteristics of the particles. Furthermore, we have investigated the thermodynamic dependence on the structural variation of different generations of dendrimer molecules encapsulating the nanoparticles.
PAMAM Dendrimer (10−4 M) was prepared and the pH was adjusted to 11.2–11.8 (using a Jenway 3345 ion meter) and purged with nitrogen for a few minutes prior to the titration. Isothermal titration calorimetry (ITC) was performed using an isothermal titration calorimeter (ITC200) of Microcal, Northampton (MA, USA) with the normal cell (200 μL). In this case, the sodium sulphide solution (2 × 10⁻² M) was injected into the Cd2+–PAMAM dendrimer solution. The titration consisted of an injection of 2 μL of the sodium sulfide solution into the Cd2+–dendrimer solution with a total number of 20 injections at 1 min intervals to obtain the complete binding curve. Control experiments were carried out for sodium sulfide to determine the heats of dilution. The thermal responses of the dilution were then subtracted to obtain the heat of binding. From the known concentrations of sodium sulfide and Cd2+ solution, the affinity, and enthalpy changes upon binding were derived from a simple fit to the data of a 1:
1 site binding model using the software ORIGIN (Microcal ITC200, Northampton, MA, USA).
ΔEg = a1ed/b1 + a2ed/b2 | (1) |
The size distribution was calculated from the differentiation of the absorption spectrum as shown typically for ZnS NPsin Fig. 1. The differentiated curve defines a peak energy E0, and an energy width in terms of E1 and E2, forming the FWHM. The absorption energy E0 is readily translated into the average size, dav by using the relationship as in eqn (1).25 Similarly, E1 and E2 are translated to apparent sizes, such as d1 and d2, which then define the apparent relative percentage distribution eqn (2). The actual distribution can be derived from the empirical relationship, as established by eqn (3).26
Δdapp = (d1 − d2)/dav × 100 | (2) |
ΔDactual = −0.0025 × Δdapp2 + 0.524 × Δdapp − 1.41 | (3) |
![]() | ||
Fig. 1 A typical UV spectrum of ZnS/dendrimer (G4) nanohybrid synthesized at 5 °C, inset: the first derivative of the absorption spectrum. |
The size and size distribution of the nanoparticles determined through optical spectroscopy using tight-binding approximation were found to be in good agreement with the results obtained from transmission electron microscopic measurements. TEM was carried out on an FEI, Technai S-twin with an acceleration voltage of 200 kV. A drop of aqueous solution of CdS or ZnS NPs was placed on a carbon coated copper grid of 400 mesh and dried before putting it into the sample chamber of TEM. Dynamic light scattering on the synthesized samples was carried out with DLS-nanoZS, Zetasizer (Nanoseries, Malvern Instruments, UK). The samples were filtered several times through a 0.22 μm Millipore membrane filter prior to taking the measurements.
![]() | ||
Fig. 2 Typical ITC thermogram for the formation of the CdS/dendrimer (G4) nanohybrid at 5 °C: (a) Phase I (b) Phase II. |
![]() | ||
Fig. 3 Typical ITC thermogram for the formation of the ZnS/dendrimer nanohybrid for the G4 dendrimer at 5 °C: (a) Phase I (b) Phase II. |
In the present study, the experimental data (corrected with a blank titration of S2− ions) determined under all of the reaction conditions employed satisfactorily fit into the typical single site binding model of commercially available software (ORIGIN, Microcal, Northhampton, MA, USA) suggesting that one type of interaction is involved in the formation of semiconductor nanocrystals, presumably, electrostatic or non-covalent in nature.29–31 Thus, this fit can provide an overall estimate of the thermodynamic parameters. In order to determine the heat of dilution, sulfide, at the same concentration as in the formation reaction, was titrated into water. The interaction of Cd(II) embedded in the dendrimer matrix with S2− ions resulted in a relatively large exothermic enthalpy change. The obtained parameter values from the fitting process were only marginally changed with the subtraction of the blank titration. The heat of dilution of S2− was found to be very small compared to the values of the overall heat change in the CdS or ZnS formation reactions. The Gibbs free energy changes (ΔG) and entropy changes (ΔS) were calculated using the thermodynamic equations ΔG = −RTln
K and ΔG = ΔH − TΔS11 where, K is termed here as the formation constant and ΔH, the enthalpy change. The formation constants (K), reaction stoichiometry (n), and enthalpy changes (ΔH) were determined from the curve-fitting analyses. Fig. 2 and 3 illustrate the raw calorimetric data obtained during titration (thermogram) for the CdS and ZnS/dendrimer nanohybrid formation, respectively, in phase I and II at a typical temperature of 5 °C, and also the plot of the integrated heat response obtained from the raw data versus the molar ratio of S2− added to the Cd2+ or Zn2+ ions present in the solution. Each negative peak shown in the heat signal curves represents an exothermic process, which denotes the heat released in one injection of the S2− ions into Cd2+or Zn2+–dendrimer solution as a function of time. Since, the metal cationic sites available in the Cd(II) or Zn(II)–dendrimer are progressively occupied through the diffusion of S2− during titration, the exothermicity of the peaks decreases and eventually saturates. However, it is observed that the induction period for the formation of the ZnS/dendrimer is longer than that of the CdS/dendrimer, which could be due to a difference in the nature of the metal–dendrimer complexes.
The heat change associated with growth is exothermic in all of the conditions studied. Similarly to the evolution of Au nanoparticles,32 the observed heat change as a function of time indicates the growth process in semiconductor nanocrystals appears to be sigmoidal in nature. The sigmoidal growth model suggests that there are three stages of the total process, nucleation, growth and the saturation. Interestingly, the heat change pattern with the growth of the semiconductor particles is the reverse to what was observed in the metal nanoclusters. In the case of Au nanoparticles, the heat change decreases with the growth of particles,32 while we observe that heat change increases with growing particles and reaches almost zero in semiconductor nanocrystals.
The sigmoidal nature of the binding curves may be explained on the basis of the increasing coverage of the metal–dendrimer sites due to the formation of CdS nanoclusters, which, in turn, lowers the available surface area for binding during succeeding titrations.31
The thermodynamic parameters obtained for the formation of CdS and ZnS nanocrystals in the dendrimer matrix at different temperatures for phase I are summarized in Tables 1 and S1,† respectively. The more negative ΔH values in the lower temperature range studied suggest the spontaneous formation of dendrimer encapsulated CdS nanocrystals at a lower temperature in zone I (core) of the dendrimer system. Further, it is evident from the tables that the K values decrease in the formation of both CdS and ZnS/dendrimer nanohybrids with increasing temperature. Similar to phase I, the K values for the formation of particles in zone II (dendrimer surface) also increase with lowering the synthesis temperature (K = 350 M−1 at 5 °C, 122 M−1 at 20 °C). The temperature dependence of the thermodynamic parameters is similar to what was observed in the formation of bare CdS nanocrystals at two temperatures by Jiang et al.24 However, the difference in their reported values of thermodynamic parameters from our observed values signifies the role of dendrimer molecules in the nanocrystal formation process. It may be presumed that a higher binding affinity at lower temperature leads to the formation of smaller particles at a lower temperature.8 Desorption may occur at a higher temperature, which leads to a lower binding affinity. The total heat content is almost similar in all temperatures in the case of CdS, indicating that the interaction between the Cd(II)–dendrimer and S2− dominates in the enthalpic change. However, it is apparent from the tables that the ΔS value becomes more negative at the lowest temperature (5° C) studied, but increases at relatively higher temperatures. This may be attributed to the fact that the particle formation occurs preferentially in the core of the dendrimer molecule at a lower temperature, because the formation of particles inside the core leads to less randomness and also results in smaller sized particles with a narrower size distribution. The observed results for the ZnS NPs are similar to the CdS NPs and are consistent with our earlier findings where 5–10 °C was found to be optimum for synthesizing particles of better quality.8 It may be noted that the size distribution was narrowed down from 15.5% to 12.4% for the ZnS–dendrimer nanohybrids when the synthesis was carried out at 25 °C and 5 °C respectively. To illustrate the formation of nanocrystals, the emission of the end products collected from the ITC cell after the reaction was recorded. Fig. 4 illustrates the emission of the end products, which strongly resembles the respective characteristic luminescence spectrum of the CdS or ZnS/dendrimer nanohybrids.8 Fig. S1 (ESI†) shows the emission spectra of the CdS/dendrimer formed at different temperatures. In addition, the DLS profile (Fig. 5) and TEM image with an SAED (Selective Area Electron diffraction) (Fig. 6) pattern depict the typical size, distribution and cubic phase of the synthesized CdS/dendrimer particles. The bigger dimensions obtained from DLS present primarily the hydrodynamic diameter of the dendrimer as a majority of the particles are formed inside the dendrimer molecules. These results confirm the in situ formation of the particles through ITC.
Temp (°C) | n | K (M−1) | ΔH (kJ mol−1) | ΔS (kJ mol−1 K−1) | ΔG (kJ mol−1) | TΔS (kJ mol−1) |
---|---|---|---|---|---|---|
5 | 0.7 | (1.4 ± 0.05) × 104 | −113 ± 10 | −0.33 | −22.1 | −90.6 |
10 | 0.8 | (1.1 ± 0.02) × 104 | −100 ± 8 | −0.28 | −22.0 | −78.2 |
20 | 0.8 | (6.7 ± 0.03) × 103 | −92 ± 9 | −0.24 | −21.5 | −70.8 |
30 | 0.9 | (4.0 ± 0.08) × 103 | −92 ± 7 | −0.23 | −21.0 | −70.9 |
40 | 0.9 | (2.4 ± 0.08) × 103 | −93 ± 8 | −0.23 | −20.2 | −71.9 |
![]() | ||
Fig. 4 Typical emission spectra of the CdS (a) and ZnS (b) nanoparticles in the dendrimer matrix collected from the ITC cell after the reaction. |
![]() | ||
Fig. 5 Typical DLS profile of the CdS/dendrimer (generation 4, NH2 terminated) nanohybrid synthesized at 5 °C. |
![]() | ||
Fig. 6 A typical TEM image and SAED pattern of the as-synthesized CdS/dendrimer nanohybrid (generation 4, NH2 terminated) at 5 °C. |
In the formation of the ZnS/dendrimer nanoparticles, with variation of the surface groups of dendrimer, the values of K and ΔH varied significantly in phase II, while those in phase I were not much affected. For the G2 dendrimer, the K and ΔH values are 1.3 × 10⁴ M−1 and −76.4 kJ mol−1, respectively for the zone I, whereas for zone II the values are 2.9 × 10² M−1 and −12.3 kJ mol−1. For the G2 dendrimer with a succinamic acid surface group, the K and ΔH values for the zone I are respectively 1 × 10⁴ M−1 and −70.1 kJ mol−1 for zone I, whereas for zone II the values are 3.8 × 10² M−1 and −15.6 kJ mol−1. The observed results show that the formation of particles in phase II is dominated at zone II, which supports the mechanism proposed by Mendez et al.27
In order to look into the role of the dendrimer core in nanocrystal formation, the thermodynamic parameters were determined for ZnS particle formation with G4 having an ethylenediamine core and G4 with a cystamine core. In the case of variation of the core of the dendrimer, the zone I values varied significantly, whereas the zone II values remained almost the same. For the G4 dendrimer with an ethylenediamine core, the K and ΔH values for the zone I are 2.2 × 10⁴ M−1 and −74.3 kJ mol−1 respectively, whereas for zone II, the K and ΔH values are 342 M−1 and −14.5 kJ mol−1, respectively. On the other hand, for the G4 dendrimer with a cystamine core, the K and ΔH values for zone I are 5.2 × 10³ M−1 and −65.5 kJ mol−1 respectively, whereas for zone II, the K and ΔH values are 328 M−1 and −12.8 kJ mol−1 respectively. The observed results suggest that for the G4 dendrimer, core group (zone I) plays an important role in the formation of semiconductor/dendrimer hybrid particles, indicating the predominant nucleation inside the G4-dendrimer.
In order to look into the possible role of dendrimer generation in the energetics of particle formation, calorimetric measurements of the ZnS/dendrimer nanohybrid formation with G2, G4 and G5 dendrimers were carried out. The observed K values for the phase I reactions are 1 × 10⁴ M−1, 2.2 × 10⁴ M−1 and 2.9 × 10⁴ M−1 for the G2, G4 and G5 dendrimers, respectively. The respective ΔH values in phase I are −70.1 kJ mol−1, −74.3 kJ mol−1 and −76.1 kJ mol−1, respectively. For the Phase II reaction, the K value changes from 249 M−1, 498 M−1 and 968 M−1 for the G2, G4 and G5 dendrimer respectively, the ΔH values are −15.7 kJ mol−1, −17.2 kJ mol−1 and −20.3 kJ mol−1 respectively. It was shown earlier8a that the size distribution of the semiconductor nanocrystals within the dendrimer matrix focuses when moving from Generation 2 to 5. We measured the size distribution of the CdS nanocrystals with dendrimers of different generations, G2, G4 and G5 as 8.8%, 6.5% and 5.6%, whereas the size distributions of ZnS were 13.8% and 12.4% with the G4 and G5 dendrimers, respectively. Thus, it may reasonably be assumed that higher K and −ΔH values indicate the possible thermodynamical control on the particle distribution. Dendrimers of lower generations tend to exist in relatively open forms, which hinder the growth of semiconductor nanoparticles less significantly. But higher generation dendrimer molecules take a spherical three-dimensional structure which appreciably limits the nucleation and growth of the NPs, which, in turn, strongly influences the particle size distribution. Thus, higher-generation dendrimers are better candidates for templates as they prevent the clusters from coalescing owing to denser surfaces.28
Fig. S2† demonstrates the ITC thermograms for the formation of ZnS/dendrimer hybrid materials at a higher ratio of metal to sulfide. Tables 2 and S2† provide the different thermodynamic parameters for the various ratios of metal and dendrimer. With increasing the ratio of Cd2+:
S2− from 1
:
5 to 1
:
20 (Table 2), the K value increases. It is important to note here that size of the CdS NPs decreases with increasing the ratio of cadmium to sulfide. In contrast, the formation constant value decreases while the particle size increases with increasing the ratio of zinc to sulfide in the formation of ZnS NPs (Table S2†). As we vary the metal
:
sulfide ratio, a similar trend in thermodynamic parameters was also observed for the CdS and ZnS/dendrimer nanohybrids in phase II. Although the stated trend is the reverse in the formation of the CdS and ZnS NPs with regard to the variation of concentrations of the reacting species, the observed results can unambiguously relate to the greater formation constant leading to the formation of smaller particles. Alternatively, it can be inferred that formation of the smaller particles is governed by a more negative free energy change. It is well known that metal ions compete with both sulfide ions and dendrimer molecules and Cd2+ has a much stronger binding affinity compared to Zn2+ with the NH2 groups of the dendrimer, while both metal ions bind with sulfide ions with a similar efficiency. Thus, it can be reasonably argued that the observed ratio dependent differential pattern in the formation of CdS/dendrimer and ZnS NPs results from weak coordination of the dendrimer amines with zinc ions leading to poor moderation of particle growth at higher sulfide concentration, which results in the formation of larger particles. Further, it was also observed that the size distribution became narrower when smaller particles were formed. The size distribution of the ZnS–dendrimer increased from 13.8% to 15.5% for the ratio of metal
:
sulphide = 1
:
10 to 1
:
20. Thus, it can be rationalized that higher formation constants lead to better moderation of the growth process resulting in the attainment of smaller particles with a narrower size distribution.
Cd2+![]() ![]() |
n | K (M−1) | ΔH (kJ mol−1) | ΔS (kJ mol−1 deg−1) | ΔG (kJ mol−1) | TΔS (kJ mol−1) |
---|---|---|---|---|---|---|
1![]() ![]() |
0.9 | (1.0 ± 0.02) × 104 | −114.1 ± 3.5 | −0.33 | −21.6 | −92.5 |
1![]() ![]() |
0.9 | (1.4 ± 0.08) × 104 | −110.3 ± 2.73 | −0.31 | −22.1 | −88.2 |
1![]() ![]() |
0.8 | (2.0 ± 0.04) × 104 | −105.3 ± 5.8 | −0.30 | −23.1 | −83.5 |
Since, the particle size increases with a higher Cd(II) to sulfide ratio, it appears that the heat change saturates faster with the formation of bigger particles. This observation is similar to what was reported in the growth of Au nanoparticles.32 Thus, when the sulfide concentration is high, the initial nucleation process occurs faster and the growth process saturates early. The particle size of the CdS NPs varied from 3.1 to 4.2 nm when the concentration of sulfide was increased to the highest value used in the present study. When the concentration of sulfide or the monomer concentration is small, the nucleation rate becomes slow and the available CdS or ZnS monomers present in the solution allows the growth of the particle to occur over a longer period.
A closer examination on the thermodynamic quantities determined in the present investigation reveals that the formation of CdS–dendrimer or ZnS–dendrimer nanocomposites characterizes a favorable enthalpy change (ΔH < 0), which is offset partially by unfavorable entropy loss (ΔS < 0), contributing to the overall negative free energy changes (ΔG). The thermodynamics of complexation depend on two simultaneous processes featuring non-covalent interaction (including electrostatic, hydrophobic, hydrogen bonding, and van der Waal's interactions) and solvent reorganization. From an enthalpic consideration, the non-covalent interactions are exothermic (ΔHintrinsic < 0), while the solvent reorganization is endothermic (ΔHdesolv > 0). The observed negative enthalpy suggests the intrinsic bond formation (or namely Cd2+/dendrimer–S2− interaction) plays a predominant role in the complex formation. It has been proposed that during metal–ligand interactions, solvent reorganization accounts for great contributions to enthalpy changes.18 Water molecules at interfaces can sometimes enhance the complementarity of the interacting surfaces; however, the negative entropy changes do not necessarily indicate that the hydration of the CdS–dendrimer interface remains unchanged or increases in comparison with that of the free Cd(II)–dendrimer and S2−. In addition, an unfavorable contribution to the entropy change may arise from the conformational restriction of the surface groups in the dendrimer upon complexation. When the entropy increase due to desolvation is not large enough to compensate the entropy loss owing to solute freedom reduction, overall unfavorable entropy changes are observed for the binding of Cd(II)–dendrimer with S2−. However, in the present case, it may be reasonably assumed that the unfavorable entropy (ΔS) may be attributed to the fact that the process of nanocrystal formation is initiated by the formation of monomers of CdS which are subsequently converted into nucleation centres followed by cluster generation. On the other hand, favourable enthalpy (ΔH) suggests that the formation of semiconductor nanocrystals is driven by the strong affinity of positively charged metal centres embedded in the matrix with an anionic counterpart (S2− ions).
In all of the cases of the formation of the CdS–dendrimer, it is observed that the contribution of ΔH to the free energy ΔG is greater than the one in TΔS. Therefore, we may infer that the interaction between the Cd(II)–dendrimer and S2− is an enthalpy driven process. A similar enthalpy-driven process was also observed in the ZnS–dendrimer nanocomposites.
It is apparent from the tables that favorable enthalpy changes in the Cd(II)–dendrimer–S2− interactions are always balanced by entropic loss i.e., enthalpy–entropy compensation.18 To analyze the compensation, if any, the TΔS value was linearly correlated with the ΔH value to give eqn (4). When eqn (4) is introduced to Gibbs–Helmholtz equation followed by the differential, eqn (5) is obtained
TΔS = αΔH + TΔSo | (4) |
δΔG = (1 − α) δΔH | (5) |
According to eqn (5), the slope (α) of the ΔH − TΔS plots reflect the contribution of enthalpic gains (δΔH) induced by alterations in the host, guest, and/or solvent to the free energy change (δΔG), as some enthalpy has been cancelled by the accompanying entropic loss (δΔS).33–38 By employing this correlation approach, the entropy changes (TΔS) are plotted against the corresponding enthalpy changes (ΔH) for the formation of CdS/dendrimer hybrid materials studied. As shown in Fig. 7, an excellent linear relationship is obtained in the case of the CdS/dendrimer with generation variation for these thermodynamic quantities with a correlation coefficient of 0.997. The α-value of the CdS/dendrimer formation is 0.987, which is comparable to that of the ZnS/dendrimer. Since, the observed intercept value (TΔSo = 20.4) in the semiconductor is not as high as in the case of the protein–protein interaction it may be assumed that the contribution of the desolvation effect is minimal. On the other hand, the low intercept value is consistent with earlier reported results on the interactions of protein–nonpeptide ligand or macromolecule–small organic molecule.18
![]() | ||
Fig. 7 Plot of entropy (TΔS) versus enthalpy (ΔH) typically for the formation of the dendrimer encapsulated CdS NPs. |
The temperature dependence of ΔH for the formation process allows the change in heat capacity, ΔCp to be quantified. Analysis of the ITC data for S2− binding to the Cd(II)–dendrimer over the 5–40 °C range indicates modest negative ΔCp values. The Cp values for the CdS and ZnS QDs are −2 and −3.6, respectively. The negative ΔCp values also predict a favorable formation reaction at a lower temperature. The relatively small negative values suggest fairly small perturbations in the dendrimer structure upon sulfide coordination with metal, which is consistent with the surface exposed cationic binding sites.
Footnote |
† Electronic supplementary information (ESI) available: Optical characterization of the nanoparticles is presented in the ESI. See DOI: 10.1039/c3ra47960a |
This journal is © The Royal Society of Chemistry 2014 |