A new approach to rubber reinforcement

Xin Hu*ab, Honglin Gaoc, Xuefeng Zhoub, Yushuang Cuia and Haixiong Ge*a
aNanjing University, Department of Materials Science and Engineering, College of Engineering and Applied Sciences, 22 Hankou Road, Nanjing, 210093, Jiangsu, China. E-mail: huxin@cslg.edu.cn; haixiong@nju.edu.cn
bChangshu Institute of Technology, School of Chemistry and Materials Engineering, 99 South Sanhuan Road, Changshu, 215500, Jiangsu, China
cResearch Institute of Engineering and Technology, Yunnan University, 2 North Cuihu Road, Kunming, 650091, Yunnan, China

Received 11th December 2013 , Accepted 31st January 2014

First published on 3rd February 2014


Abstract

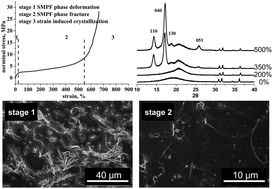
In this paper, we report the highly efficient reinforcement of dynamically cross-linked silane-modified phenol formaldehyde resin (SMPF) in ethylene-propylene diene terpolymer rubber (EPDM). Only 5 phr of SMPF is able to greatly improve the tensile strength of EPDM from 5 MPa to 28 MPa, which is 55% higher than that of EPDM filled with 30 phr of carbon black N330, and it still retains a high elongation of more than 600%. The scanning electron microscopy and X-ray diffraction results reveal the reinforcement mechanism of EPDM. SMPF is uniformly dispersed in the EPDM matrix by a conventional Banbury mixer and is dynamically cross-linked to form a greatly expanded hard phase comprising the interpenetrating polymer networks of EPDM and SMPF during the mixing process, which leads to a high modulus. The high tensile strength is attributed to the strain-induced crystallization of EPDM at high strain according to the X-ray diffraction patterns of the stretched EPDM–SMPF composites. These results reveal the high efficient reinforcement of the thermoset resin in rubber, demonstrate a new mechanism of rubber reinforcement and suggest a new direction for rubber reinforcement.


Introduction

Rubbers, one of the most important commercial polymers, are usually soft and weak materials and cannot be used as articles directly. They have to be mixed with fillers to promote their mechanical properties such as modulus and strength. Various fillers have been used in the rubber industry for decades including carbon black and silica. As it has been well known that fillers with a smaller dimension lead to the higher strength of the rubber–filler composite, a number of efforts have been made to investigate the reinforcement capacity of various fillers in rubbers and search for a substitute for carbon black and silica, especially since the blooming of nanomaterials, including organomontmorillonite,1–3 carbon and other nanotubes,4–7 graphene,8 etc. The dispersion of fillers in a rubber matrix by mechanical mixing is essential in rubber reinforcement. Unfortunately, nanoparticles tend to agglomerate to reduce their surface energy, which is a great challenge for the application of nano-sized fillers in rubber reinforcement. On the other hand, the significant polar differences between inorganic fillers and organic rubbers is also an obstacle for the dispersion of fillers in a rubber matrix. Several strategies have been suggested to overcome the disadvantages derived from the strong filler–filler interactions to obtain a good dispersion. One effective method to improve the filler dispersion is a surface modification of inorganic nanofillers. Silane-based coupling agents are usually used to enhance the interaction between rubber and silica due to the presence of different functionalities at the ends of the molecules.9 Organoclay, a kind of layered silicate clay, to which alkyl groups have been introduced, is another successful nanofiller to reinforce rubber because of its high compatibility to rubber and its exfoliation in a rubber matrix.10 Another path to uniform dispersion is the in situ formation of nanoparticles. A well-known example is the in situ formation of silica filler particles by the sol–gel hydrolysis and condensation of silanes.11–14

All the aforementioned inorganic nanofillers have a relatively high density and lead to high-weight products, so light, highly efficient reinforcement agents with a good dispersion are very attractive. It is reasonable to deduce that rigid polymeric particles can also act as a reinforcement agent if they have a nanoscale dimension and are uniformly dispersed in the rubber matrix.

Phenol formaldehyde resin (PF), the first commercial thermoset resin developed in 1904, is produced from the reaction of phenol with formaldehyde in the presence of a catalyst. Despite the emergence of several new classes of thermosets, high performance polymers and several other new generation materials that are superior in some respects, phenolic resin retains industrial and commercial interest, more than a century after its introduction.15 Some types of PF are also used in rubber formulas as an additive to improve some properties. Phenol formaldehyde resins are used as cross-linking agents in synthetic rubbers, including isobutyl isoprene rubber (IIR) and EPDM, to improve the temperature resistance of the corresponding vulcanizate.16,17 Only a few works have been reported to apply PF as a reinforcement agent in rubbers, including NR, NBR, CR and EPDM,18–20 but their results were quite disappointing and their tensile strengths were only a little improved. In non-polar rubbers (NR and EPDM), polar PF tended to agglomerate because of the phase separation, while PF was dissolved in a polar rubber (NBR or CR) matrix and could not form particles to reinforce rubber. Inspired by the dynamic cross-linking of EPDM in PP during the preparation of TPV, we managed to find a new direction toward rubber reinforcement. Vinyl triethoxysilane modified phenolic resin (SMPF) was dynamically cross-linked during the mixing process and served as a reinforcement agent to improve the mechanical properties of EPDM. SMPF was easily synthesized from phenol formaldehyde novolac21 and mixed with EPDM in a traditional Banbury mixer without any special treatment. The simple and low cost composite exhibited outstanding mechanical properties and the reinforcement capacity of SMPF was even higher than nanoclay. In this paper, we demonstrate the extremely high reinforcement capacity of SMPF and discuss the mechanism of reinforcement.

Experimental

Materials

EPDM (Nordel IP 4725, granulated form) with 70% ethylene and 4.5% ENB content having a Mooney viscosity of ML100°C1+4 was a commercial product of Dow Chemical; carbon black N330 was purchased from Cabot Co., Shanghai; vinyl triethoxysilane modified phenol formaldehyde resin was synthesized in our laboratory according to the literature;21 zinc oxide, stearic acid, hexamethylene tetramine (HMMT), sulfur, accelerator BZ, DM and CBS were all commercial products in China and used directly.

The preparation of the EPDM–SMPF composite

EPDM, SMPF, zinc oxide and stearic acid were together added to the mixing chamber of a Hakke Rheometer RC 90 at 170 °C at a rotor speed of 30 rpm and mixed for 8 minutes. When the compound was cooled to below 50 °C, it was milled with sulfur and accelerators by a two-roll mill and vulcanized by a plate vulcanizing machine at 170 °C for 8 minutes. All the formulas for testing contained EPDM 100 phr, ZnO 5 phr, stearic acid 1 phr, sulfur 1.2 phr, BZ 0.5 phr, DM 1.0 phr, and CZ 1.0 phr, while SMPF and carbon black were variable. The amount of HMMT was 10 wt% of SMPF.

Characterization

The tensile properties were determined on a dumbbell-shaped at a crosshead speed of 500 mm min−1 by using an electronic universal testing machine. All measurements were made five times and the values were averaged. The X-ray diffraction (XRD) experiments were performed for the samples using a D/max-RB diffractometer (Rigaku, Japan), which has an X-ray generator of 12 kW, a graphite monochromator, CuKα radiation operating at 40 kV, 100 mA. The samples were scanned at a scanning speed of 8° min−1 at diffraction angles 2θ 10–40°. The morphology observation was conducted with a scanning electron microscope (Helios Nanolab 600i, FEI). All samples were immersed in liquid nitrogen for 5 min and broken, and the cryogenically fractured surfaces were sputter-coated with gold before the examination.

The shear modulus was measured using the data of the stress–strain curves in small deformation according to the following equation:

 
σ = G(λλ−2) (1)
where σ is the stress, G is the shear modulus and λ is the draw ratio which is equal to 1 + ε.

The volume fraction was calculated according to the Guth and Gold expression:

 
G = G0(1 + 2.5Φ + 1.41Φ2) (2)
where G is the shear modulus of the filler loaded rubber vulcanizate, G0 is the shear modulus of the unloaded rubber vulcanizate and Φ is the volume fraction of the filler.

Results and discussion

The influence of the amount and mixing method of SMPF on the mechanical properties of the EPDM–SMPF composites

SMPF greatly improved the mechanical properties of EPDM. The tensile strength at break of the different EPDM–SMPF composites prepared by two methods loaded with different amounts of SMPF is illustrated in Fig. 1 and compares different carbon black loaded EPDM composites. SMPF exhibited a much higher reinforcement efficiency than carbon black. Only 5 phr of SMPF was able to improve the tensile strength of EPDM to 28 MPa, which was 180% higher than that of EPDM loaded with the same amount of carbon black. The strength slowly decreased with the increase of the SMPF load. This phenomena should be attributed to the agglomerate of SMPF when more SMPF was mixed in the EPDM matrix.
image file: c3ra47537a-f1.tif
Fig. 1 The influence of the mixing method of SMPF loaded EPDM on the tensile strength comparing carbon black.

Fig. 1 also indicates that SMPF should be properly mixed and formulated with EPDM to display its reinforcement capacity. In general knowledge, the reinforcement capacity of fillers is determined by the dimension, dispersion and interfacial adhesion.22,23 Accordingly we can imagine that when SMPF was mixed with EPDM in a chamber, the compound underwent a higher temperature and higher shear force so that the resin phase could be fully cross-linked and well dispersed in the EPDM matrix. When the compound was mixed in a two-roll mill, the mixing temperature and shear force was much lower than those in the chamber, which gave a much lower SMPF–EPDM interaction and lower mechanical properties.

HMMT also played an important role in the EPDM–SMPF composite (Fig. 2). The tensile strength of EPDM–SMPF (5 phr) was about 17 MPa, while the strength was further improved to 28 MPa when 10 wt% of HMMT (vs. SMPF) was loaded. Cross-linkers should be formulated with commercial thermoplastic phenolic resins to form a cross-linked network. Ethoxysilane groups were introduced into the structure of PF21 so that SMPF was able to hydrolyze and condense in the presence of water. The mechanism is similar to the condensation of the silane coupling agents. Water came from the reaction between zinc oxide and stearic acid at high temperatures. In the formula, ZnO and stearic acid are not only active additives in sulfur vulcanizating systems, but also the source of water for SMPF to cross-link. HMMT, a widely used curing additive for phenolic resins, further improved the cross-linking density of SMPF and consequently the modulus of the SMPF network was further improved to promote the mechanical properties of the EPDM–SMPF composite.


image file: c3ra47537a-f2.tif
Fig. 2 The influence of HMMT on the tensile strength of the EPDM–SMPF composites.

Typical stress–strain curves for the unfilled EPDM, EPDM–SMPF (5 phr) and EPDM loaded with different amounts of carbon black are shown in Fig. 3. The EPDM–SMPF vulcanizate showed a unique stress–strain curve when comparing with the unfilled and carbon black loaded EPDM. In a small deformation, high slope of the stress–strain curve of EPDM–SMPF was similar to the highly loaded rubber samples. When EPDM–SMPF was continuously stretched, the trend became weaker and the stress gradually became lower than the all carbon black loaded EPDM. It is quite interesting that EPDM–SMPF and unfilled EPDM had a similar stress when the strain was about 400%. When the sample was further stretched, the slope sharply went up and the tensile strength surpassed the all carbon black loaded EPDM composites and reached 28 MPa. The unique stress–strain behavior of EPDM–SMPF indicated a different reinforcement mechanism which is greatly different to traditional fillers.


image file: c3ra47537a-f3.tif
Fig. 3 The typical stress–strain curves for pure EPDM and the EPDM composites: (a) unfilled EPDM vulcanizate (b–d) EPDM loaded with different amounts of carbon black, the amount of carbon black is 10 phr, 20 phr and 30 phr respectively; (e) EPDM loaded with 5 phr of SMPF.

Fig. 4 illustrates the calculation of the shear modulus of EPDM–SMPF, unloaded EPDM and EPDM loaded with 30 phr of carbon black. According to eqn (1) based on the stress–strain data in Fig. 3, the shear modulus of EPDM–SMPF was 4.25 MPa, while that of unloaded EPDM and EPDM loaded with 30 phr of carbon black was 1.35 MPa and 3.73 MPa, respectively. A high modulus is usually associated with a high volume fraction of the fillers in the particle-reinforced rubber composites.24,25 The Guth and Gold expression gives the relationship between the shear modulus and the volume fraction of the fillers. From eqn (2) it can be calculated that the volume fraction of SMPF was 63% while the ideal volume fraction of SMPF should be 3.2% calculated from the density of rubber and resin. The result means that the volume of SMPF greatly expanded during the process of the composite, which indicates the reason for the high modulus and high tensile strength of the EPDM–SMPF composite.


image file: c3ra47537a-f4.tif
Fig. 4 The relationship between the nominal stress and strain of different EPDM vulcanizates.

The morphology characterization of the EPDM–SMPF composite

In order to further understand the exciting reinforcement capacity of SMPF, the morphology of EPDM–SMPF was studied by SEM. Fig. 5a illustrates sectional images of an EPDM–SMPF sample immersed in liquid nitrogen and broken for SEM investigation. The images display a number of lotus leaf-like structures and a few particles with a dimension of hundreds of nanometers to tens of micrometers can be found. The lotus leaf-like structure illustrates the morphology of the SMPF phase in the EDPM matrix: the structure was formed during the dynamic cross-linking in the chamber and the resin phase was greatly inflated. There were two competing processes in mixing: (1) the polarity difference between SMPF and EPDM made SMPF tend to agglomerate; (2) SMPF was cut into minor pieces by the strong shear force to separate in the polymer matrix before it was completely cross-linked. These two processes made the special morphology. As we mentioned before, PF should have a suitable compatibility with EPDM. The silane groups and vinyl groups introduced to the PF backbone reduced the polarity of PF and improved the dispersion of SMPF in the rubber matrix. The lotus leaf-like structures became clearer when the composite was highly stretched for 600% and immediately immersed in liquid nitrogen and broken (Fig. 5b). The veins of the leaf-like structures indicate the molecular orientation. The volume of SMPF was greatly expanded by the rubber molecules, which imparted its modulus to the rubber phase. The transition layer between the resin phase and the rubber phase makes the inflated resin phase easy to deform with an applied force. When the composite was stretched, the SMPF phase was able to deform so that the applied energy can be absorbed. When the resin phase was broken, SMPF was still strongly bonded with the rubber matrix and prevented the formation of defects which may cause the break.
image file: c3ra47537a-f5.tif
Fig. 5 The section SEM images of EPDM–SMPF under different strain: (a) unstretched; (b) stretched to 600%.

The structure is clearer when the SMPF phase was removed from the matrix. PF is not stable in strong base, while EPDM is stable in a basic medium. So the SMPF phase can be removed by immersing the composite in 20 wt% of a potassium hydroxide solution for 48 hours at room temperature without damaging the morphology of the EPDM phase.

Fig. 6 illustrates the SEM images of a fracture section of EPDM–SMPF (5 phr) etched by KOH solution. Fig. 6a gives an overview of the clear phase distribution of EPDM–SMPF. The contrast difference is a topography contrast due to the different secondary electron (SE) yield.26 The SE yield depends on the angle of incidence, and the rough surface gives more secondary electrons than the smooth surface. The more SMPF the region contains, the more polymer was removed by chemical etching, and a rougher surface was obtained. The distribution of the light-colored regions is able to characterize the SMPF distribution in the rubber matrix (Fig. 6a). We can find that although the ideal SMPF concentration was very limited (5 phr), the EPDM–SMPF phase became a continuous phase and occupied most of the volume of the composite matrix. The SEM image strongly supports the assumption and calculation that a high modulus was attributed to the highly expanded hard phase in the rubber matrix.


image file: c3ra47537a-f6.tif
Fig. 6 SEM images of the EPDM–SMPF vulcanizate etched by 20 wt% KOH for 48 hours: (a) an over view; (b) a zoomed image of area 1; (c) a zoomed image of area 2.

We can also find many dendriform and quite a lot of fiber like polymer structures with a diameter of about 30 nm to 65 nm (Fig. 6b and c). When SMPF was etched and removed, the residual structure was the EPDM phase. SMPF was partly compatible with EPDM and consequently tended to agglomerate. It has been generally known that a poor filler dispersion will reduce the filler–rubber interactions and consequently decrease the mechanical properties.27 In our study, micro-scale particles can be observed in Fig. 5, but they did not act as stress-concentrated points and lowered the strength of EPDM–SMPF. Most of the particles were also EPDM–SMPF composites and SMPF was dispersed in nano-scale dimensions. The strong interaction between SMPF and EPDM made the micro-scale particles act as reinforcement points.

The images clearly show that in the structure of the EPDM–SMPF composite there is no completely pure EPDM phase nor pure SMPF phase. Even the hardest phase was also full of staggered EPDM nanofibers.

The reinforcement mechanism of SMPF in EPDM

More interesting information about the EPDM–SMPF networks can be revealed by plotting the reduced stress σ* [σ* = σ/(λλ2)] against the reciprocal of the extension ratio λ−1 in Fig. 7 according to Mooney–Rivlin equation, given by
 
image file: c3ra47537a-t1.tif(3)
where σ is the nominal stress defined as the force divided by the undeformed cross-sectional area and λ is the extension ratio, defined as the ratio of the final length of the sample in the direction of stretch to the initial length before deformation, 2C1 and 2C2 are constants independent of the extension ratio λ.

image file: c3ra47537a-f7.tif
Fig. 7 Mooney–Rivlin plots for the different EPDM vulcanizates.

As shown in Fig. 7, the reduced stress σ* of EPDM filled with carbon black was much higher than that of unloaded EPDM and showed an obvious nonlinear behavior at the low stretch ratios while that of pure EPDM showed a weaker nonlinear behavior. Moreover, the reduced stress of the carbon black loaded EPDM increased at high stretch ratios, whereas no upturn was found when pure EPDM was further stretched. The behavior of EPDM–SMPF was quite different. It had a similar reduced stress to that of carbon black loaded EPDM when the strain was less than 60%. When EPDM–SMPF was continuously stretched, the slope kept going down until it had a similar reduced stress to that of pure EPDM. Then a sharp upturn of the Moony–Revlin plots can be observed when the strain met about 350% and in the end, the reduced stress of EPDM–SMPF surpassed that of carbon black loaded EPDM.

The decrease in the modulus observed in low deformations can be attributed to the Payne effect.28 For carbon black loaded rubber, the decrease of the modulus was attributed to the break down of the carbon black network formed during storage and vulcanizating. EPDM–SMPF also exhibited a similar Payne effect to carbon black filled EPDM, but it had a different mechanism. In this composite, the expanded hard phase was a continuous phase and had a quite large volume fraction to form a network. The hard phase was an interpenetrating polymer network (IPN), composing of soft cross-linked EPDM and rigid cross-linked SMPF. When the composite was stretched, the SMPF phase began to deform and fracture so that the composite had a similar behavior to carbon black loaded rubber. With the increase of strain, the hard phase began to break into smaller and smaller particles and nanofibers. The real volume fraction was very limited (about 3.2%) resulting in the composite having a reduced stress close to that of pure rubber.

It was explained that the upturn in the modulus at a large deformation is attributed to the finite or limited chain extensibility of the short chain linking filler particles.29 The mechanism of carbon black in rubber is attribute to the polymer chain entanglement and absorption at the surface of carbon black.30,31 It is hard to imagine that a limited real volume fraction in a large deformation can contribute so much to the chain absorption and entanglement. The stress–strain behavior and Mooney–Rivlin curves at a large deformation were quite similar to those of natural rubber, so it is reasonable to assume that the strain-stiffening behavior of EPDM–SMPF was also attributed to strain-induced crystallization.

Fig. 8 illustrates the XRD patterns of EPDM–SMPF in different strains comparing unfilled EPDM and EPDM–carbon black in different extensions. Whether carbon black filled EPDM was stretched or not, there was no visible diffraction peak. For unfilled EPDM and EPDM–SMPF, diffraction peaks did not appear until the samples were 350% stretched. Sharp peaks appeared in high strain with 2θ values of 14.3°, 17.2°, 18.8° and 25.9°, respectively. The intensity of the diffraction at 17.2° and 25.8° became stronger when EPDM–SMPF was further stretched to 500%. When the upper stretched samples were released, the diffraction patterns of EPDM–SMPF were similar to EPDM–carbon black: all of the diffraction peaks of the polymer disappeared. The phenomenon is a typical stress-induced crystallization. The ethylene segment content of the EPDM sample we used was about 70%, and it seems that the ethylene segment was easier to crystallize. Surprisingly the diffraction patterns are completely different to that of polyethylene. Some papers have studied the crystallization of unstretched and stretched ethylene rich EPDM,32,33 but only one strong diffraction peak was seen at 20.78°. The patterns of the stress-induced crystal in EPDM–SMPF are similar to that of isotactic polypropylene (i-PP), where the Bragg reflections at 14.089°, 17.086°, 18.485° and 25.579° correspond to the indexed planes of the monoclinic crystals (α-form) (110), (040), (130) and (051), respectively.34


image file: c3ra47537a-f8.tif
Fig. 8 The XRD patterns of different EPDM vulcanizates: (a) unfilled EPDM stretched for 350%; (b and c) are unstretched and 400% stretched EPDM–carbon black (30 phr); (d–g) are EPDM–SMPF (5 phr) stretched for 0%, 200%, 350% and 500%, respectively.

The XRD patterns showed a completely different reinforcement mechanism between SMPF and carbon black in EPDM. There was no strain-induced crystallization in the EPDM–carbon black composite, while the high tensile strength of EPDM–SMPF was greatly associated with crystallization. But on the other hand, strain-induced crystallization did not promise a high tensile strength because the same phenomenon was also found in unfilled EPDM. Fig. 9 illustrates the structure evolution of EPDM–SMPF: the unique structure of SMPF in the EPDM matrix not only promoted the modulus of EPDM–SMPF, but also served as a nanofiller in the rubber matrix and induced the crystallization of EPDM in high strain. The structure also prevented the composite from fracture before the material was highly oriented.


image file: c3ra47537a-f9.tif
Fig. 9 The reinforcement mechanism of SMPF in EPDM.

Conclusion

Dynamically cross-linked SMPF has an excellent reinforcement capacity in sulfur-accelerator vulcanized EPDM. Properly formulated and mixed EPDM–SMPF displays a high modulus, a high tensile strength and a high elongation with low density. The high modulus was attributed to the highly expanded hard phase which was composed of EPDM–SMPF IPN. At high strain, the high tensile strength was attributed to the strain-induced crystallization of EPDM in the presence of SMPF.

Notes and references

  1. M. Arroyo, M. A. Lopez-Manchado and B. Herrero, Polymer, 2003, 44, 2447–2453 CrossRef CAS.
  2. S. J. Wang, C. F. Long, X. Y. Wang, Q. Li and Z. N. Qi, J. Appl. Polym. Sci., 1998, 69, 1557–1561 CrossRef CAS.
  3. Y. W. Chang, Y. C. Yang, S. Ryu and C. Nah, Polym. Int., 2002, 51, 319–324 CrossRef CAS.
  4. M. D. Frogley, D. Ravich and H. D. Wagner, Compos. Sci. Technol., 2003, 63, 1647–1654 CrossRef CAS.
  5. A. Das, K. W. Stoeckelhuber, R. Jurk, M. Saphiannikova, J. Fritzsche, H. Lorenz, M. Klueppel and G. Heinrich, Polymer, 2008, 49, 5276–5283 CrossRef CAS PubMed.
  6. H. Ismail, P. Pasbakhsh, M. N. A. Fauzi and A. Abu Bakar, Polym. Test., 2008, 27, 841–850 CrossRef CAS PubMed.
  7. P. Pasbakhsh, H. Ismail, M. N. A. Fauzi and A. Abu Bakar, Appl. Clay Sci., 2010, 48, 405–413 CrossRef CAS PubMed.
  8. S. Araby, I. Zaman, Q. Meng, N. Kawashima, A. Michelmore, H. Kuan, P. Majewski, J. Ma and L. Zhang, Nanotechnology, 2013, 24, 165601 CrossRef PubMed.
  9. S. J. Park and K. S. Cho, J. Colloid Interface Sci., 2003, 267, 86–91 CrossRef CAS.
  10. P. C. LeBaron, Z. Wang and T. J. Pinnavaia, Appl. Clay Sci., 1999, 15, 11–29 CrossRef CAS.
  11. Y. Ikeda and Y. Kameda, J. Sol-Gel Sci. Technol., 2004, 31, 137–142 CrossRef CAS.
  12. J. Siramanont, V. Tangpasuthadol, A. Intasiri, N. Na-Ranong and S. Kiatkamjornwong, Polym. Eng. Sci., 2009, 49, 1099–1106 CAS.
  13. R. Scotti, L. Wahba, M. Crippa, M. D'Arienzo, R. Donetti, N. Santo and F. Morazzoni, Soft Matter, 2012, 8, 2131–2143 RSC.
  14. M. Thunga, A. Das, L. Haeussler, R. Weidisch and G. Heinrich, Compos. Sci. Technol., 2010, 70, 215–222 CrossRef CAS PubMed.
  15. C. Nair, Prog. Polym. Sci., 2004, 29, 401–498 CrossRef CAS PubMed.
  16. M. VanDuin and A. Souphanthong, Rubber Chem. Technol., 1995, 68, 717–727 CrossRef CAS.
  17. P. O. Tawney, J. R. Little and P. Viohl, Ind. Eng. Chem., 1959, 51, 937–938 CrossRef CAS.
  18. S. Chuayjuljit, P. Rattanametangkool and P. Potiyaraj, J. Appl. Polym. Sci., 2007, 104, 1997–2002 CrossRef CAS.
  19. L. Ye and Y. Zhang, J. Appl. Polym. Sci., 2009, 111, 1177–1184 CrossRef CAS.
  20. L. Ye, Y. Zhang and Z. Wang, J. Appl. Polym. Sci., 2007, 105, 3853–3857 CrossRef.
  21. X. Hu, J. Zeng, W. Dai, W. Shi, L. Li and C. Han, Polym. Bull., 2011, 66, 703–710 CrossRef CAS.
  22. S. Pradhan, F. R. Costa, U. Wagenknecht, D. Jehnichen, A. K. Bhowmick and G. Heinrich, Eur. Polym. J., 2008, 44, 3122–3132 CrossRef CAS PubMed.
  23. Q. W. Yuan and J. E. Mark, Macromol. Chem. Phys., 1999, 200, 206–220 CrossRef CAS.
  24. M. Bhattacharya and A. K. Bhowmick, Polymer, 2008, 49, 4808–4818 CrossRef CAS PubMed.
  25. E. A. Meinecke and M. I. Taftaf, Rubber Chem. Technol., 1988, 61, 534–547 CrossRef CAS.
  26. H. Seiler, J. Appl. Phys., 1983, 54, R1–R18 CrossRef CAS PubMed.
  27. Z. Ishak and A. A. Bakar, Eur. Polym. J., 1995, 31, 259–269 CrossRef CAS.
  28. J. Diani, B. Fayolle and P. Gilormini, Eur. Polym. J., 2009, 45, 601–612 CrossRef CAS PubMed.
  29. L. Bokobza and B. Erman, Macromolecules, 2000, 33, 8858–8864 CrossRef CAS.
  30. V. M. Litvinov and P. Steeman, Macromolecules, 1999, 32, 8476–8490 CrossRef CAS.
  31. G. Heinrich and T. A. Vilgis, Macromolecules, 1993, 26, 1109–1119 CrossRef CAS.
  32. B. Scholtens, E. Riande and J. E. Mark, J. Polym. Sci., Polym. Phys. Ed., 1984, 22, 1223–1238 CrossRef CAS.
  33. Z. Du, J. Xu, Q. Dong and Z. Fan, e-Polym., 2010, No. 079 Search PubMed.
  34. S. Bruckner, S. V. Meille, V. Petraccone and B. Pirozzi, Prog. Polym. Sci., 1991, 16, 361–404 CrossRef CAS.

This journal is © The Royal Society of Chemistry 2014