Nanofibrous electroactive scaffolds from a chitosan-grafted-aniline tetramer by electrospinning for tissue engineering

Xiaojie Maa, Juan Gea, Yan Lia, Baolin Guo*a and Peter X. Ma*abcde
aCenter for Biomedical Engineering and Regenerative Medicine, Frontier Institute of Science and Technology, Xi'an Jiaotong University, Xi'an, 710049, China. E-mail: baoling@mail.xjtu.edu.cn; mapx@umich.edu; Fax: +86-29-83395131; Tel: +86-29-83395361
bDepartment of Biomedical Engineering, University of Michigan, Ann Arbor, MI 48109, USA
cDepartment of Biologic and Materials Sciences, University of Michigan, 1011, North University Ave., Room 2209, Ann Arbor, MI 48109, USA
dMacromolecular Science and Engineering Center, University of Michigan, Ann Arbor, MI 48109, USA
eDepartment of Materials Science and Engineering, University of Michigan, Ann Arbor, MI 48109, USA

Received 5th January 2014 , Accepted 4th March 2014

First published on 5th March 2014


Abstract

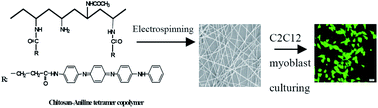
Functional degradable biomimetic scaffolds have great potential applications in tissue regeneration. Nanofibrous electroactive biodegradable scaffolds from chitosan-grafted-aniline tetramer (CS–AT) were fabricated by an electrospinning method. The CS–AT was synthesized by amidation reaction between the carboxyl group of aniline tetramer and the amine group of chitosan. The structure of CS–AT copolymer was characterized by 1H NMR, FT-IR, TGA and XRD. UV-vis and cyclic voltammetry tests were used to demonstrate the electroactivity of CS–AT. The electrospun nanofibers were created from CS–AT solution. The morphology of the CS–AT nanofibers was observed by employing SEM and the results illustrated that the diameter of the nanofibers of deposited CS and CS–AT samples was controlled by both polymer concentration and the AT content. The biocompatibility of the materials was evaluated by cell adhesion and proliferation of C2C12 myoblasts and dog chondrocyte cells, and the results demonstrated that the CS–AT materials had good biocompatibility and greatly enhanced the cell adhesion and proliferation of C2C12 cells.


1. Introduction

The search for biodegradable scaffolds originates from the growing need to interface living cells, tissues and organs, which structurally mimic the extracellular matrix (ECM). Collagen as the major protein of ECM arranges into nanofibers,1 which not only give support to tissue but also help to organize the communication between cells embedded within the matrix.2,3 To imitate the natural ECM, nanofibrous polymer scaffolds have been fabricated by using several different processing techniques, such as phase separation, molecular assembly and electrospinning.4,5 Among these methods, the electrospinning as an elegant and facile way to obtain nanofibrous structures is one of the most common technique.6,7 A variety of natural and synthetic biodegradable polymers have been prepared as porous scaffolds with random or aligned morphology, such as chitosan,8–10 polylactide11–13 and other biomaterials.14–16 The fibers generated from electrospinning exhibit high surface area and porosity, and their diameters are tunable ranging from several nanometers to several microns.17,18 Thus, electrospinning as a very promising method, plays an important role in the application of tissue engineering.6,7,14

Recently, an increasing attention has been paid to the design of specific cellular responsive biomaterials at the molecular level.19 It has been reported that electrical signals can regulate cell attachment, proliferation and differentiation.20 Electric fields and stimulations are very helpful for wound healing, recovery of the damaged spin cord, nerve regeneration21,22 and so on. Therefore conductive polymers used in biomedical area have attracted much attention in the past few decades.23 Mawad et al. successfully prepared a conducting hydrogel based on poly(3-thiopheneacetic acid), and fibroblast and myoblast cells were found to adhere and proliferate on the hydrogel substrate.24 Polypyrrole was coated onto random and aligned electrospun poly(lactic-co-glycolic acid) (PLGA) nanofibers and the polypyrrole-coated PLGA electrospun meshes enhanced the growth and differentiation of rat pheochromocytoma 12 cells compared to non-coated PLGA control meshes.25 However, conducting polymers are not degradable and they are expected to stay in vivo even small amount was used,26,27 which limits their applications in tissue engineering. Much more attention has been therefore given to aniline oligomers (aniline trimer, tetramer and pentamer) modified polymers due to its good electroactivity, low toxicity and degradability in body.28–30 Aniline oligomers might be consumed by macrophages and can undergo renal clearance, avoiding the long term adverse response in vivo.29 Aniline pentamer crosslinked chitosan was prepared and used for PC12 cell culturing.31 Our group synthesized a series of degradable conducting copolymer and hydrogels based on aniline oligomers and polylactide32,33 and polycaprolactone.28,34,35 We also developed a facile way to synthesize electroactive degradable chitosan–tetraaniline hydrogels by Schiff base reaction.36 However, Schiff base is not stable in acid or alkaline solution. Moreover, the fabrication of nanofibrous scaffolds of aniline oligomers grafted biomaterials to mimic the natural ECM has not been reported.

The object of the present work was to create nanofibrous electroactive scaffolds by using electrospinning from a chitosan-graft-aniline tetramer (CS–AT) copolymer which was synthesized by an amidation reaction between the amine group of CS and carboxyl group of AT. We chose chitosan as matrix because of its unique advantage in biomedical field, and aniline tetramer was then introduced to chitosan by simple amidation reaction. The structure and properties of CS–AT copolymers were characterized. The nanofibrous structures of scaffolds were generated from CS–AT solution by using electrospinning technique. We also investigated the feasibility of using CS–AT for adhesion and proliferation of two cell lines, chondrocyte and C2C12 myoblast cells.

2. Materials and methods

2.1 Materials

Chitosan (CS) with a molecular weight of 100[thin space (1/6-em)]000–300[thin space (1/6-em)]000 was purchased from J&K Scientific Ltd. N-(3-Dimethylaminopropyl)-N′-ethylcarbodiimide hydrochloride (EDC·HCl), N-hydroxysuccinimide (NHS), hydrochloric acid (HCl), acetic acid (AcOH), dimethylformamide (DMF), trifluoroacetic acid (TFA), dichloromethane (DCM) and sodium hydroxide (NaOH) were all purchased from Aldrich and were used as received.

2.2 Synthesis of aniline tetramer (AT)

0.1 mol N-phenyl-1, 4-phenylenediamine was allowed to react with 0.105 mol succinic anhydride in DCM to obtain phenyl/carboxyl-capped p-phenylenediamine (Scheme 1). 0.1 mol p-phenylenediamine and 0.1 mol phenyl/carboxyl-capped p-phenylenediamine were dissolved in a mixture solution of DMF and HCl (Scheme 1). The emeraldine (EM) base form of AT was obtained upon addition of 0.2 mol ammonium persulfate as the oxidant at room temperature under stirring for 4 h. The fully reduced leucoemeraldine (LM) of AT was prepared by reducing the EM base AT with phenylhydrazine for 2 h at room temperature. The LMAT product was washed thoroughly with distilled water, followed by washing in a Soxhlet extractor with 1,2-dichloroethane and THF to remove the excess reducing agent and byproduct in the reactions. The LMAT powders were then dried under reduced pressure. LM AT: 1H NMR (400 MHz, DMSO-d6): δ = 12.01 (s, 1H, –COOH), δ = 9.73 (s, 1H, –NHCO–), δ = 7.78 (s, 1H, –NH–), δ = 7.69 (s, 1H, –NH–), δ = 7.64 (s, 1H, –NH–), δ = 7.36–7.38 (d, 2H, Ar–H), δ = 7.11–7.13 (d, 2H, Ar–H), δ = 6.99–6.85 (m, 12H, Ar–H), δ = 6.69–6.65 (d, 2H, Ar–H), δ = 2.74–2.72 (t, 4H, –CH2CH2–).
image file: c4ra00083h-s1.tif
Scheme 1 Synthesis of carboxyl-capped aniline tetramer.

2.3 Synthesis of aniline tetramer grafted chitosan (CS–AT)

Chitosan modified with different amount of AT was prepared as shown in Scheme 2. The weight percentage of AT in the feed mixture of CS and AT varied from 5% to 40% (Table 1). The obtained aniline tetramer grafted chitosan was respectively abbreviated as CS, CS–AT5, CS–AT8, CS–AT10, CS–AT20, CS–AT30 and CS–AT40, meaning that the feed ratio of AT was 0, 5, 8, 10, 20, 30, and 40 wt%.
image file: c4ra00083h-s2.tif
Scheme 2 Synthesis of aniline tetramer grafted chitosan (CS–AT).
Table 1 Synthesis of CS–AT and the AT content in the copolymer by UV-vis test
Sample CS (g) AT (g) wt% of AT in feed solution wt% of AT in samples
CS 0.5 0 0 0
CS–AT5 0.5 0.026 5 0.5
CS–AT8 0.5 0.044 8 2.5
CS–AT10 0.5 0.056 10 4.4
CS–AT20 0.5 0.125 20 9.1
CS–AT30 0.5 0.214 30 25.2
CS–AT40 0.5 0.334 40 26.3


A typical example (CS–AT10) was as follows: EMAT of 0.0556 g, NHS of 0.0688 g and EDC·HCl of 0.1145 g were dissolved in 5 mL of DMF (dried by CaH2). The mixture was stirred at room temperature for 24 h. After the reaction, the mixture was added dropwise into the 1 wt% solution of CS (0.5 g CS was dissolved in 50 mL of 0.05 M HCl). The stirring was continued for 24 h at room temperature. After finishing the reaction, the pH of the mixture was adjusted by adding 3 M NaOH until the product was precipitated. The precipitate was then filtered and re-dissolved in 10 mL of 1 wt% acetic acid aqueous solution. After the removal of insoluble things by centrifugation, the pH of the filtrate was again adjusted by adding 3 M NaOH until the product was precipitated. The final product was washed several times with deionized water and dried in air.

2.4 Electrospinning

Electrospun nanofibers of CS and CS–AT were prepared in a manner similar to that reported previously.37,38 Briefly, CS and CS–AT solutions with different concentrations ranging from 2.5% to 4% (w/v) were prepared respectively by using the mixture of TFA and DCM (5[thin space (1/6-em)]:[thin space (1/6-em)]1 v/v) as solvent. The as-prepared CS and CS–AT solution was fed into a 5 mL glass syringe fitted with a gauge 20 stainless steel needle used as the nozzle with an inner diameter of 0.6 mm. An iron plate was used as collector, and a positive voltage of 17 kV and negative voltage of 4 kV were applied. Moreover, the tip-to-collector distance and flow rate of feed solutions were fixed at 15 cm and 0.04 mL h−1, respectively.

2.5 Characterization

FT-IR spectra of EMAT, CS and CS–AT20 were recorded on a Nicolet 6700 FT-IR spectrometer (Thermo Scientific Instrument) with a resolution of 4 cm−1. 1H NMR (400 MHz) spectra of AT and CS–AT were obtained on a Bruker Avance 400 MHz NMR instrument with DMSO-d6 as solvent at room temperature. Cyclic voltammetry (CV) of AT and CS–AT was conducted on an Electrochemical Workstation (CHI 660D) employing a three-electrode system with a platinum disk as working electrode, a platinum wire as auxiliary electrode, and an Ag/AgCl as reference electrode. The scan rate was 20 mV s−1 for the sample. Thermogravimetric analysis (TGA) of CS and CS–AT was performed on STARe/TGA/DSC with a heating rate of 10 °C min−1 from 25 to 800 °C under a nitrogen atmosphere. The UV-vis spectra of EMAT and EMAT grafted chitosan were recorded with a UV-vis spectrophotometer (PerkinElmer Lambda 35) using the mixture of DMF and 10 vol% aqueous solution of AcOH as solvent (the volume ratio of DMF to AcOH aqueous solution was 1[thin space (1/6-em)]:[thin space (1/6-em)]1). The AT content of the samples in Table 1 was determined by using UV-vis spectrophotometer according to ref. 31. The morphology of the as-spun CS and CS–AT nanofibrous membranes were investigated by scanning electron microscope (FE-SEM, SU-8000, Hitachi, Japan). Each sample was coated with gold by a sputtering device for 30 s prior to SEM observation. XRD patterns of CS and CS–AT copolymer were obtained with a Siemens D5005 diffractometer using CuKα radiation.

2.6 Biocompatibility test of CS–AT polymer

Cell culture. The dog chondrocytes were isolated from a beagle dog (2 week old) and incubated at 37 °C in an incubator with 5% CO2. The complete growth medium was Dulbecco's Modified Eagle Medium (DMEM, GIBCO) supplemented with 15% fetal bovine serum (FBS, GIBCO), 1.0 × 10⁵ U per L penicillin (Hyclone) and 100 mg L−1 Streptomycin (Hyclone). All national and institutional guidelines for the care and use of laboratory animals were followed.

C2C12 myoblasts were originally obtained from the ATCC (American Type Culture Collection) and cultured at 37 °C in an incubator with 5% CO2. The complete growth medium was DMEM supplemented with 10% FBS, 1.0 × 10⁵ U per L penicillin and 100 mg L−1 streptomycin.

Cell adhesion and morphology on CS–AT film substrate. 80 μL of the solution of CS, CS–AT5, CS–AT8, CS–AT10 and CS–AT20 was coated onto 18 mm × 18 mm cover slides respectively and the solvent was evaporated at room temperature for 2 days. The cover slides placed into a 6-well plate (Costar) were then sterilized with ethylene oxide and washed three times with DPBS and twice with cell culture medium for 30 min each at 37 °C while rotating at 50 rpm. The chondrocytes and C2C12 myoblasts were respectively seeded on the cover slides at the density of 1.0 × 10⁵ cells per well. The plates were incubated for 48 h at 37 °C in an incubator with 5% CO2. For cell viability test, the cells on cover slides were washed with Dulbecco's Phosphate-Buffered Saline (DPBS) twice and stained with LIVE/DEAD® Viability/Cytotoxicity Kit (Molecular Probes) for 30 min at room temperature following the protocol of manufacturer. For cell morphology observation, the C2C12 cells on the cover slides were washed twice with DPBS and fixed with 2.5% glutaraldehyde in DPBS at room temperature for 30 min, then washed with DPBS. The C2C12 myoblasts were stained by DPBS solution with fluorescein isothiocyanate (FITC) labeled phalloidin (Sigma) at the concentration of 5 μg mL−1 for 90 min at room temperature, and then washed with DPBS twice. The cells were redyed with DPBS solution of DAPI (Sigma, 0.1 μg μL−1) for 10 min. Cell adhesion and morphology was observed under the inverted fluorescence microscope (IX53, Olympus).
C2C12 myoblasts adhesion and proliferation on the CS–AT films. 100 μL of CS, CS–AT5, CS–AT8, CS–AT10, CS–AT20 and CS–AT30 solutions (10 wt%) was added into a 96-well plate (Costar) respectively and the solvent was removed. The plate was sterilized with ethylene oxide for 5 h and washed three times with DPBS and twice with cell culture medium for 30 min at 37 °C while rotating at 50 rpm.

100 μL of the rat C2C12 myoblasts suspension containing approximately 2000 cells was added in each well. After being cultured for 24 h, 10 μL of the alamaBlue® reagent was then added into each well. The plate was incubated for 7 h at 37 °C in an incubator with 5% CO2 protected from direct light. 90 μL of the medium in each well was carefully removed into a 96-well black plate (Costar). Fluorescence was read using 567 nm as excitation wavelength and 594 nm as emission wavelength by the microplate reader (Molecular Devices). The cells were incubated for 1, 2, 3, and 4 days and tested respectively. Cells seeded on CS substrate served as the positive control group. Tests were repeated six times for each group.

Cytotoxicity of degradation products of CS–AT polymers. To evaluate the cytotoxicity of degradation products of CS–AT5 and CS–AT10 for a longer time, C2C12 myoblasts were cultured in the CS–AT polymer extracts and the cell viability was determined by alamaBlue® assay. The sterile CS–AT5 and CS–AT10 polymers with concentration of 100 mg mL−1 were sucked in the complete growth medium at 37 °C in the incubator respectively for 14 days to extract the degradation products. C2C12 myoblasts were trypsinized, pelleted, resuspended in complete growth medium and seeded in 96-well plate at a density of 1000 cells per well. After being cultured for 24 h, the medium was changed into the CS–AT extracts. 10 μL of the alamaBlue® reagent was then added into each well after being cultured for another 24 h. Then the plate was incubated for 7 h, and 90 μL of the medium in each well was removed into a 96-well black plate. Fluorescence was read by a microplate reader. The cells were incubated for 1, 4, and 7 days and tested respectively. Cells treated with the extract of CS served as the positive control group. Tests were repeated five times for each group. All the experiments were done twice independently.
Statistical analysis. All the data were expressed as mean ± standard deviation. Statistical comparison of the alamaBlue® assay of C2C12 myoblasts proliferation on CS–AT polymer was performed by the variance analysis of repeated measurements between two groups using the SPSS18.0 statistical package. A value of p < 0.05 was considered statistically significant.

3. Results and discussions

3.1 Synthesis and characterization of CS–AT

Chitosan (CS) with good biocompatibility, degradability and mechanical properties has been widely used in biomedical fields, such as drug delivery,39–43 gene delivery44 and tissue engineering.45,46 In our previous work, we synthesized CS–glutaraldehyde–AT hydrogels by taking glutaraldehyde as crosslinking agent and grafting agent.36 However, Schiff base formed in the product is not stable. In this work, we use amidation reaction between the amine group of CS and carboxyl group of AT to graft AT on the main chain of CS. The process of the preparation of aniline tetramer grafted chitosan is depicted schematically in Scheme 2. Briefly, aniline tetramer grafted chitosan was obtained by reacting the amino groups on chitosan with the carboxyl groups of AT which were activated by NHS before mixing with CS solution. FT-IR and 1H NMR spectra were used to characterize the CS–AT copolymer. Fig. 1 shows the 1H NMR spectra of AT and CS–AT. In the 1H NMR spectra of CS–AT, there were proton signals between 7.39 and 6.68 ppm (multiplet) ascribing to the hydrogen in the benzene ring, and proton signals at 3.8, 2.7 and 1.8 ppm assigned to the hydroxyl and alkyl groups of CS, which confirmed the existence of AT segment in CS–AT, illustrating that the aniline tetramer was successfully grafted onto chitosan. Furthermore, the signals of –NH– groups between 7.78 and 7.64 ppm from AT segment are still present in the CS–AT, indicating that the structural integrality of AT is remained.
image file: c4ra00083h-f1.tif
Fig. 1 1H NMR spectra of (a) AT and (b) CS–AT20.

The FT-IR spectra of CS, AT and CS–AT were displayed in Fig. 2. The IR spectrum of non-modified CS in Fig. 2(a) shows absorption peaks at 1647 and 1590 cm−1 assigned to the C[double bond, length as m-dash]O stretching (amide) and N–H bending (amine), respectively. In Fig. 2(c) of AT, the bands at 1718 cm−1 and 1664 cm−1 are assigned to the absorption from the carbonyl groups (–CO–) in –COOH and amide groups –NHCO–, and the peaks at 1570 cm−1 and 1490 cm−1 ascribe to the vibration of the quinoid ring and benzene ring, respectively. By comparing with the spectra of AT and CS, curve b of CS–AT shows both peaks at 1646 cm−1 from CS and at 1580 cm−1 from AT. While the peak at 1718 cm−1 corresponding to –COOH group was absent in curve c, illustrating that the AT was chemically connected to CS main chains by the coupling reaction between the carboxyl group in AT and amine group in CS. Moreover, the characteristic peaks of residual amino groups and hydroxyl group on chitosan in CS–AT emerged at 3354 cm−1 which shifted to lower wavenumber compared to pristine CS at 3362 cm−1, indicating that the hydrogen bonds were formed between the CS and AT.


image file: c4ra00083h-f2.tif
Fig. 2 FT-IR spectra of (a) CS, (b) CS–AT20 and (c) EMAT.

The compositions of the CS–AT copolymers, prepared under different feed weight percentages of AT, are summarized in Table 1. It is obvious that the content of AT in the CS–AT samples increased with the increment of feed weight fraction of AT. It is reasonable that the active sites increased with the addition of AT in feed solution from 0% to 40% and the amount of AT grafted on CS increased accordingly. In addition, we can see that in Table 1 the AT content in CS–AT30 and in CS–AT40 was very close. That might be because with the addition of increased amount of AT, the concentration of carboxyl groups was no more a key factor effecting on the AT content in CS–AT samples. However, the viscosity of CS–AT solution increased along with the increment of AT content, due to the strong attraction among AT segments in CS–AT. Especially for CS–AT30 and CS–AT40, they were really not appropriate for fabrication of CS–AT nanofibers using electrospinning method in the following work.

3.2 XRD of CS–AT copolymers

Fig. 3 shows XRD pattern of CS and CS–AT copolymers. We can see that the XRD of CS showed two strong peaks in the diffractogram at 2θ at 10.2° and 19.8° which are characteristics of the crystalline structure of chitosan, indicating the high degree of crystallinity of chitosan. The first peak at 2θ = 10.2° ascribes to the crystal forms I and stronger reflection appeared at 2θ = 19.8° assigns to crystal forms II according to ref. 47 and 48. The introduction of AT in the CS–AT was confirmed by the decrease of peak intensity at 2θ of 10.2° because the AT segment might interrupt the formation of inter- and intra-molecular hydrogen bonds between chitosan and decrease the structure order of chitosan after modification.
image file: c4ra00083h-f3.tif
Fig. 3 XRD pattern of CS–AT copolymer.

3.3 Thermal stability of CS–AT copolymers

The thermal properties of CS and CS–AT were studied by TGA, and the representative curves are shown in Fig. 4. For CS, there is an obvious weight loss between 50 and 150 °C assigned to the weight loss of water moisture in the CS. The weight loss of CS–AT copolymer was much less between 50 and 150 °C compared to CS, because the hydrophobic AT segment was introduced to CS and the amine groups on CS main chain was consumed by the amidation reaction with AT segment. When the temperature increased to 800 °C, the weight loss of CS was 80%, indicating the degradation of the CS main chain. In case of the CS–AT copolymer, the weight loss decreased with increasing the AT content in the copolymer due to the better thermal stability of AT segment, illustrating that the introduction of AT into CS strengthened the heat resistance of CS.
image file: c4ra00083h-f4.tif
Fig. 4 Representative TGA curves of CS–AT copolymers.

3.4 Electroactivity of CS–AT copolymer

The electrochemistry of the samples was investigated by UV-vis and CV measurements. Noticeably, there were three absorption peaks in the UV spectrum for samples in Fig. 5. The two peaks around 308 and 590 nm was attributed to the π–π* transition of the aromatic benzene ring and the benzenoid to quiniod (πB–πQ) excitonic transition, respectively. Doping with acid is a key factor for electroactive polymers, which was verified by the peak appearing at 430 nm due to the formation of polarons. Furthermore, we can see from Fig. 5 that the absorption peak of π–π* band has a slight blue shift from 308 nm to 299 nm by comparing with the spectra of AT and CS–AT samples. This phenomenon may be caused by the large steric hindrance in CS–AT copolymer which restricts the non-planar conformation of the AT segments, leading to a decrease in the effective conjugation length of AT segment in the copolymer.49 The electroactivity of AT and CS–AT30 were also observed by CV test, as shown in Fig. 6. AT shows two pairs of reversible redox peaks at 0.38 and 0.58 V, respectively. The first pair of redox peaks around 0.38 V was due to the transition from the leucoemeraldine state to the emeraldine state. The second pair of redox peaks with the redox potential at around 0.58 V was attributed to the transition from the emeraldine state to the pernigraniline state50 (as shown in Scheme 3). While the CV curve of CS–AT30 only shows one pair of reversible redox peaks around 0.67 V which may ascribe to the transition of AT segment in CS–AT from the leucoemeraldine state to the emeraldine state. After AT was grafted on CS, the large steric hindrance in CS–AT polymers hampered the conjugation of the system and increased the oxidation energy barrier, which was in concordant with the result of UV-vis results. These data confirmed the good electroactivity of CS–AT copolymer and provided more evidence that the AT segment was successfully grafted onto CS main chains.
image file: c4ra00083h-f5.tif
Fig. 5 UV-vis spectra of AT and CS–AT20 in the mixture of DMF and 10% aqueous solution of AcOH (v/v = 1[thin space (1/6-em)]:[thin space (1/6-em)]1).

image file: c4ra00083h-f6.tif
Fig. 6 Cyclic voltammograms of AT (a) and CS–AT30 (b) in the mixture of DMSO and HCl.

image file: c4ra00083h-s3.tif
Scheme 3 Molecular structure of aniline tetramer at various oxidation states.

3.5 Nanofibrous scaffolds from CS–AT by electrospinning

We employed the solution of CS and CS–AT using AcOH as solvent for electrospinning in our initial work. A series of concentrations from 1 wt% to 4 wt% of CS and CS–AT were tested for electrospinning, but none of them produced fibers (data not shown). However, nanofibers were successfully fabricated by taking TFA instead of AcOH as solvent (Fig. 7). According to Ohkawa et al.,37 the triumphant electrospinning of CS in TFA resulted from the formation of salts between TFA and the amino groups on CS chain. Moreover, another advantage of TFA is its property of volatility and the volatility of solvent system was further ensured by adding DCM.
image file: c4ra00083h-f7.tif
Fig. 7 SEM images of nanofibers from (a) CS, (b) CS–AT5, (c) CS–AT8 and (d) CS–AT10 with polymer concentration of 3 wt%.

The SEM pictures of the nanofibers from CS and CS–AT solution in the mixture of TFA and DCM, with different concentration of AT content were represented in Fig. 7. Obviously, nanofibers were deposited onto the collector at a fixed concentration of 3 wt%, by varying samples from CS to CS–AT10 (as seen in Fig. 7a–d). It was evident that the nanofibers were with few defects and the diameter of them ranged from around 100 nm to 600 nm. However, no fibers but bead-like structures for sample CS–AT20 were exhibited (data not shown). That was caused by the increased affinity among the chains of CS–AT with the increase of AT content as shown in Table 1. The solubility of the CS–AT in the solvent decreased compared to that of chitosan because of the hydrophobicity of the AT segments. The viscosity of the CS–AT copolymer solution is higher than that of chitosan at the same concentration. The introduction of AT into CS resulted in a tight entanglement among polymer chains, which requires for a high voltage to overcome the resistance caused by entanglement. In addition, dramatic morphology changes of samples varying from CS to CS–AT10 were observed in Fig. 8a–d with a higher concentration of 4 wt%. By increasing the CS–AT polymer concentration, the entanglement among polymer chains become deeper and the viscosity of the polymer solution increased. Hence, the morphology of deposited CS and CS–AT nanofibers depended both on polymer concentration and the AT content. A higher or lower concentration was not beneficial for the fabrication of nanofiber structures.


image file: c4ra00083h-f8.tif
Fig. 8 SEM images of nanofibers from (a) CS, (b) CS–AT5, (c) CS–AT8 and (d) CS–AT10 with polymer concentration of 4 wt%.

3.6 Cell adhesion, proliferation and morphology on CS–AT polymers

The dog chondrocytes and C2C12 myoblasts were used for the cytotoxicity test of the CS–AT polymers. Chondrocytes and C2C12 myoblasts were cultured on the CS–AT substrates for 48 h and LIVE/DEAD® Viability/Cytotoxicity Kit was used to qualitatively evaluate the biocompatibility of the materials. Live and dead cells were respectively stained green and red in the test, and the representative images were shown in Fig. 9. The chondrocytes and C2C12 cells adhered well on all the substrates and a majority of the live cells (green) were found for CS–AT5, CS–AT8 and CS–AT10 except the TCP and CS, illustrating that CS–AT5, CS–AT8 and CS–AT10 are generally non-toxic. Moreover, the CS–AT5, CS–AT8 and CS–AT10 showed improvement in cell adhesion and proliferation compared to CS, due to the good biocompatibility of CS and the electroactivity of AT segment. However, some dead cells (red color) appeared on the CS–AT20 substrate indicating that the CS–AT20 is weakly toxic. Both the chondrocytes and C2C12 cells showed a similar result on the CS–AT substrates.
image file: c4ra00083h-f9.tif
Fig. 9 Fluorescent images of chondrocytes (top) and C2C12 myoblasts (bottom) on CS–AT polymer films stained by live/dead assay after culturing for 2 days. Most cells observed on CS, CS–AT5, CS–AT8 and CS–AT10 substrates were live (green) cells while some dead (red) cells appeared on CS–AT20 substrate. Scale bars represent 50 μm.

The toxicity of the materials could affect the morphology of the cells. Cell adhesion and morphology of C2C12 myoblasts on CS–AT polymers was evaluated by cell staining. After being incubated for 48 h and then stained by FITC labeled phalloidin and DAPI, C2C12 myoblasts spreaded well and showed a normal, healthy spindle-like shape on all the CS–AT polymer substrates (Fig. 10).


image file: c4ra00083h-f10.tif
Fig. 10 Fluorescent images of C2C12 myoblasts on CS–AT films stained by FITC labeled phalloidin and DAPI after being cultured for 48 h. The C2C12 myoblasts exhibited a normal spindle-like morphology. Scale bars represent 50 μm.

Cell viability of C2C12 myoblasts on the CS–AT substrates was further quantified by alamarBlue assay, and the results are shown in Fig. 11. A continuous increase of cell number was found from day 1 to day 4 for all groups (p < 0.01). The cell viability of C2C12 myoblasts of samples CS–AT5, CS–AT8 and CS–AT10 showed much higher values than that of the control group CS which has good biocompatibility. The cell numbers were increased in order for the CS–AT5, CS–AT8 and CS–AT10 groups probably owing to enhancement of chemical and signal exchanges between the cells as a result of incorporating AT segments in the copolymers.49 These results indicated that the CS–AT copolymers enhanced the cell adhesion and proliferation of C2C12 myoblasts compared to CS. But the cell viability of CS–AT20 and CS–AT30 group (data not shown) were obviously lower than that of CS group (p < 0.05). This is because the electroactivity that could improve the cell proliferation and toxicity that hinders the cell proliferation were both introduced into the materials along with AT segment.49,51 The AT segment should be in a favorable content to maximize the effect of electroactivity on promoting the cell proliferation and offset its toxicity. Therefore, a high concentration of AT segment in the copolymers may not be good for the materials for tissue engineering application.


image file: c4ra00083h-f11.tif
Fig. 11 Cell viability results of C2C12 myoblasts on the CS–AT films. These cell culturing results showed that the CS–AT5, CS–AT8 and CS–AT10 enhanced the cell proliferation of C2C12 myoblasts compared to CS.

The results of C2C12 myoblasts proliferation on the CS–AT film substrates showed that CS–AT5 and CS–AT10 copolymers had a good biocompatibility during the 4 days culture (Fig. 11). To further evaluate the toxicity of the degradation products of CS–AT5 and CS–AT10 for a longer period, the CS–AT5 and CS–AT10 polymers were sucked in the culture medium for 14 days to get the degradation products and the concentration of the CS–AT extracts (100 mg mL−1) is quite high for tissue engineering application. The cytotoxicity of degradation products of CS–AT5 and CS–AT10 was quantified by alamaBlue® assay and the results are shown in Fig. 12. Cell number exhibited a continuous increase for all samples from day 1 to day 7. The cell proliferation of C2C12 for CS–AT5 and CS–AT10 extracts was much better than that for CS control group (p < 0.05), indicating that the degradation products from CS–AT5 and CS–AT10 greatly improved the C2C12 myoblast proliferation. There was no significant difference between the CS–AT5 group and CS–AT10 group (p > 0.05). The C2C12 myoblasts were at 100% confluence after being cultured in CS–AT5 and CS–AT10 extracts for 7 days even though the initial seeding density was quite low (1000 cells per well). These cytotoxicity results of the degradation products showed that CS–AT5 and CS–AT10 copolymers had good biocompatibility for long-term cell culture.


image file: c4ra00083h-f12.tif
Fig. 12 Cell viability of C2C12 myoblasts in CS–AT extracts.

4. Conclusions

Nanofibrous electroactive scaffolds were created by electrospinning technique from chitosan-graft-aniline tetramer (CS–AT) copolymer. CS–AT copolymers with different AT content was synthesized by the amidation reaction between the carboxyl group and amine group of CS, and their structure was confirmed by NMR, XRD and FT-IR. The thermal stability of the CS–AT copolymer compared to CS was strengthened by the introduction of AT segment. The electroactivity of the CS–AT copolymer was verified by UV and CV measurements. The nanofibers were fabricated by electrospinning from the CS–AT copolymer, and the diameter of the nanofibers depended on the polymer concentration and AT content. The CS–AT substrates and their degradation products are not cytotoxic and could improve the cell adhesion and proliferation of C2C12 myoblasts compared to chitosan. All these results indicated that these biocompatible electroactive materials could be potentially used as tissue scaffolds that require electroactivity.

Acknowledgements

The authors gratefully acknowledge the National Natural Science Foundation of China (grant number 21304073) for financial support of this work.

References

  1. K. E. Kadler, D. F. Holmes, J. A. Trotter and J. A. Chapman, Biochem. J., 1996, 316, 1–11 CAS.
  2. A. Abbott, Nature, 2003, 424, 870–872 CrossRef CAS PubMed.
  3. B. Geiger, Science, 2001, 294, 1661–1663 CrossRef CAS PubMed.
  4. G. B. Wei and P. X. Ma, Adv. Funct. Mater., 2008, 18, 3568–3582 CrossRef CAS PubMed.
  5. J. M. Holzwarth and P. X. Ma, J. Mater. Chem., 2011, 21, 10243–10251 RSC.
  6. D. Li and Y. Xia, Adv. Mater., 2004, 16, 1151–1170 CrossRef CAS.
  7. Q. P. Pham, U. Sharma and A. G. Mikos, Tissue Eng., 2006, 12, 1197–1211 CrossRef CAS PubMed.
  8. B. M. Min, S. W. Lee, J. N. Lim, Y. You, T. S. Lee, P. H. Kang and W. H. Park, Polymer, 2004, 45, 7137–7142 CrossRef CAS PubMed.
  9. F. Z. Volpato, J. Almodovar, K. Erickson, K. C. Popat, C. Migliaresi and M. J. Kipper, Acta Biomater., 2012, 8, 1551–1559 CrossRef PubMed.
  10. Z. G. Chen, P. W. Wang, B. Wei, X. M. Mo and F. Z. Cui, Acta Biomater., 2010, 6, 372–382 CrossRef CAS PubMed.
  11. F. Yang, R. Murugan, S. Wang and S. Ramakrishna, Biomaterials, 2005, 26, 2603–2610 CrossRef CAS PubMed.
  12. S. Liu, G. Y. Zhou, D. X. Liu, Z. G. Xie, Y. B. Huang, X. Wang, W. B. Wu and X. B. Jing, J. Mater. Chem. B, 2013, 1, 101–109 RSC.
  13. X. W. Zhang, R. Nakagawa, K. H. K. Chan and M. Kotaki, Macromolecules, 2012, 45, 5494–5500 CrossRef CAS.
  14. X. Liu, L. A. Smith, J. Hu and P. X. Ma, Biomaterials, 2009, 30, 2252–2258 CrossRef CAS PubMed.
  15. D. R. Nisbet, J. S. Forsythe, W. Shen, D. I. Finkelstein and M. K. Horne, J. Biomater. Appl., 2009, 24, 7–29 CrossRef CAS PubMed.
  16. M. M. Perez-Madrigal, E. Armelin, L. J. del Valle, F. Estrany and C. Aleman, Polym. Chem., 2012, 3, 979–991 RSC.
  17. N. Bhardwaj and S. C. Kundu, Biotechnol. Adv., 2010, 28, 325–347 CrossRef CAS PubMed.
  18. S. Agarwal, J. H. Wendorff and A. Greiner, Polymer, 2008, 49, 5603–5621 CrossRef CAS PubMed.
  19. L. L. Hench and J. M. Polak, Science, 2002, 295, 1014–1017 CrossRef CAS PubMed.
  20. A. D. Bendrea, L. Cianga and I. Cianga, J. Biomater. Appl., 2011, 26, 3–84 CrossRef CAS PubMed.
  21. A. C. Mendonca, C. H. Barbieri and N. Mazzer, J. Neurosci. Methods, 2003, 129, 183–190 CrossRef.
  22. M. Zhao, B. Song, J. Pu, T. Wada, B. Reid, G. Tai, F. Wang, A. Guo, P. Walczysko, Y. Gu, T. Sasaki, A. Suzuki, J. V. Forrester, H. R. Bourne, P. N. Devreotes, C. D. McCaig and J. M. Penninger, Nature, 2006, 442, 457–460 CrossRef CAS PubMed.
  23. N. K. Guimard, N. Gomez and C. E. Schmidt, Prog. Polym. Sci., 2007, 32, 876–921 CrossRef CAS PubMed.
  24. D. Mawad, E. Stewart, D. L. Officer, T. Romeo, P. Wagner, K. Wagner and G. G. Wallace, Adv. Funct. Mater., 2012, 22, 2692–2699 CrossRef CAS.
  25. J. Y. Lee, C. A. Bashur, A. S. Goldstein and C. E. Schmidt, Biomaterials, 2009, 30, 4325–4335 CrossRef CAS PubMed.
  26. B. L. Guo, L. Glavas and A. C. Albertsson, Prog. Polym. Sci., 2013, 38, 1263–1286 CrossRef CAS PubMed.
  27. N. K. E. Guimard, J. L. Sessler and C. E. Schmidt, Macromolecules, 2009, 42, 502–511 CrossRef CAS PubMed.
  28. B. L. Guo, A. Finne-Wistrand and A. C. Albertsson, Chem. Mater., 2011, 23, 4045–4055 CrossRef CAS.
  29. T. J. Rivers, T. W. Hudson and C. E. Schmidt, Adv. Funct. Mater., 2002, 12, 33–37 CrossRef CAS.
  30. X. Y. Zhang, H. X. Qi, S. Q. Wang, L. Feng, Y. Ji, L. Tao, S. X. Li and Y. Wei, Toxicol. Res., 2012, 1, 201–205 RSC.
  31. J. Hu, L. H. Huang, X. L. Zhuang, P. B. Zhang, L. Lang, X. S. Chen, Y. Wei and X. B. Jing, Biomacromolecules, 2008, 9, 2637–2644 CrossRef CAS PubMed.
  32. B. L. Guo, A. Finne-Wistrand and A. C. Albertsson, Macromolecules, 2012, 45, 652–659 CrossRef CAS.
  33. B. L. Guo, A. Finne-Wistrand and A. C. Albertsson, Biomacromolecules, 2010, 11, 855–863 CrossRef CAS PubMed.
  34. B. L. Guo, A. Finne-Wistrand and A. C. Albertsson, J. Polym. Sci., Part A: Polym. Chem., 2011, 49, 2097–2105 CrossRef CAS.
  35. B. L. Guo, Y. Sun, A. Finne-Wistrand, K. Mustafa and A. C. Albertsson, Acta Biomater., 2012, 8, 144–153 CrossRef CAS PubMed.
  36. B. L. Guo, A. Finne-Wistrand and A. C. Albertsson, Biomacromolecules, 2011, 12, 2601–2609 CrossRef CAS PubMed.
  37. K. Ohkawa, D. I. Cha, H. Kim, A. Nishida and H. Yamamoto, Macromol. Rapid Commun., 2004, 25, 1600–1605 CrossRef CAS.
  38. P. Sangsanoh and P. Supaphol, Biomacromolecules, 2006, 7, 2710–2714 CrossRef CAS PubMed.
  39. B. L. Guo, J. F. Yuan and Q. Y. Gao, Colloids Surf., B, 2007, 58, 151–156 CrossRef CAS PubMed.
  40. B. L. Guo, J. F. Yuan, L. Yao and Q. Y. Gao, Colloid Polym. Sci., 2007, 285, 665–671 CAS.
  41. J. H. Park, G. Saravanakumar, K. Kim and I. C. Kwon, Adv. Drug Delivery Rev., 2010, 62, 28–41 CrossRef CAS PubMed.
  42. B. L. Guo, J. F. Yuan and Q. Y. Gao, Polym. Int., 2008, 57, 463–468 CrossRef CAS.
  43. B. L. Guo, J. F. Yuan and Q. Y. Gao, Colloid Polym. Sci., 2008, 286, 175–181 CAS.
  44. N. Duceppe and M. Tabrizian, Expert Opin. Drug Delivery, 2010, 7, 1191–1207 CrossRef CAS PubMed.
  45. S. F. Yan, K. X. Zhang, Z. W. Liu, X. Zhang, L. Gan, B. Cao, X. S. Chen, L. Cui and J. B. Yin, J. Mater. Chem. B, 2013, 1, 1541–1551 RSC.
  46. S. Pok, J. D. Myers, S. V. Madihally and J. G. Jacot, Acta Biomater., 2013, 9, 5630–5642 CrossRef CAS PubMed.
  47. G. P. Ma, D. Z. Yang, Y. S. Zhou, M. Xiao, J. F. Kennedy and J. Nie, Carbohydr. Polym., 2008, 74, 121–126 CrossRef CAS PubMed.
  48. Z. Zong, Y. Kimura, M. Takahashi and H. Yamane, Polymer, 2000, 41, 899–906 CrossRef CAS.
  49. Y. D. Liu, J. Hu, X. L. Zhuang, P. B. Zhang, Y. Wei, X. H. Wang and X. S. Chen, Macromol. Biosci., 2012, 12, 241–250 CrossRef CAS PubMed.
  50. J. Gao, D. G. Liu, J. M. Sansiñena and H. L. Wang, Adv. Funct. Mater., 2004, 14, 537–543 CrossRef CAS.
  51. H. T. Cui, Y. D. Liu, M. X. Deng, X. Pang, P. B. Zhang, X. H. Wang, X. S. Chen and Y. Wei, Biomacromolecules, 2012, 13, 2881–2889 CrossRef CAS PubMed.

This journal is © The Royal Society of Chemistry 2014