Theoretical and experimental determination of the number of water molecules breaking the structure of a glycine-based ionic liquid

Yang Wu*, Xiaoxue Ma, Yao Li, Wei Guan*, Jian Tong and Na Hu
College of Chemistry, Key Laboratory of Green Synthesis and Preparative Chemistry of Advanced Materials, Liaoning University, Shenyang, 110036, China. E-mail: wuyoung@hotmail.com

Received 9th December 2013 , Accepted 2nd January 2014

First published on 6th January 2014


Abstract

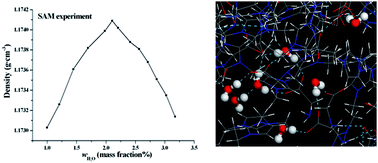
The effects of water on the structures of the amino acid ionic liquid (IL) 1-ethyl-3-methylimidazolium glycine ([emim][Gly]) are explored by a classical simulation method. The density and surface tension of the [emim][Gly]–H2O mixture are experimentally studied by a standard addition method. Simulation and experiment show that the density of the [emim][Gly]–H2O mixture reaches the maximum at 2–4 mass% water. Different analysis tools, including radial distribution, an interstice model, and molecular intrinsic characteristic contours are used to describe the structural modifications of the [emim][Gly] and ionic aggregates as a function of the solution concentration. At xw < 0.33 (mole fraction), the isolated water and dimer are located at the interstices formed between the ions, do not modify the network of ILs, and slightly strengthen the interactions between the cation and anion. Consequently, a turnover in the evolution of the IL structures and properties ensues. At 0.33 < xw < 0.50, the formation of relatively large water clusters, such as trimers and tetramers, leads to interstice distention, breakage of the cation–anion network, and gradual loosening of the interactions. With a further increased water concentration, a bicontinuous phase is generated and ionic clusters disperse in a continuous water phase. The size and morphology of the water aggregates are evaluated and analyzed by several statistical functions.

1. Introduction

Alternatives to conventional solvents are sought because of the demand for “green” chemistry and sustainable technology. Given the potential for novel synthesis routes and process designs, a number of environmentally benign media have been recently explored.1–3 Amino acid-based functionalized ionic liquids (AAILs) are one such class of solvents.4–7 The most interesting features of these AAILs are their strong hydrogen bonding abilities and chiral centers. Their physicochemical properties can be easily adjusted for a wide range of tasks. Thus, these AAILs pave the way for various applications, such as intermediates for peptide syntheses, chiral solvents, functional materials, and biodegradable ionic liquids (ILs).4,8–11

Water is regarded as inimical to pure ILs, because the presence of trace amounts of water can drastically affect the physicochemical properties of ILs, such as density, viscosity, conductivity, and surface characters. This effect enables significant modifications in the rate and selectivity of chemical reactions carried out using these ILs. In the case of CO2 capture in a flue gas using ILs, Brennecke et al.12 found that large amounts of water decrease CO2 solubility. For membrane applications using acetate-based ILs, the presence of water significantly alters membrane performance.13 Meanwhile, several reports have recently shown that during biopolymer dissolution, pure ILs almost cannot dissolve proteins without denaturation. ILs containing a small amount of water are reportedly superior at dissolving and preserving proteins, in which water is an excellent partner of ILs.14,15

The component ions of ILs strongly interact with water through ion–dipole interactions. Analysis of the hydrated states of these ions elucidates the physicochemical properties of IL–water mixtures. Based on the work of Dupont et al.,16 numerous researchers have experimentally and theoretically investigated the interactions between ILs and water. Some research techniques include IR and Raman spectroscopy,17–19 NMR,20 SFG spectroscopy,21 X-ray crystallography,22 fluorescence,23 thermodynamics study,24,25 DFT,17,25,26 and MD.27–31 They found that water molecules are solitarily dispersed throughout the ILs at low water concentrations.17,20 With a slightly increased water concentration, the dimeric association of water molecules is observed in the mixture.18,28 With a further increased water concentration, the association of the water molecules increases and spreads throughout the ILs. Subsequently, small ionic clusters are formed, and a second continuous phase is ultimately formed effectively.19,30

Miscibility is important in considering the properties of IL–water mixtures. ILs with hydrophilic ions, such as halide (i.e. [Cl] or [Br]), carboxylate ([RCOO]), or amino acid anions ([AA]) are generally mostly miscible with water. Meanwhile, ILs with highly fluorinated and charge-delocalized anions such as [Tf2N] and [PF6] tend to form hydrophobic ILs and are immiscible with water. However, previous work has shown that even extremely “hydrophobic” ILs have important solubilities with water32 that may be due to ionic characteristics. The ions in ILs cannot be closely packed, and many interstices (or holes) between ions exist, which may be related to the macroscopic properties based on interstice theory.33–36 Thus, upon incorporation into ILs, the water molecules are initially positioned in the interstices of ILs, and hydrated ions are formed. Even a small amount of water can dramatically influence the liquid properties of ILs without any reaction occurring, as mentioned in ref. 15.

This study aims to elucidate the relationship between the number of water molecules and local molecular structure of 1-ethyl-3-methylimidazolium glycine ([emim][Gly]). Combined with the standard addition method (SAM), we identified an important factor that has not been clearly considered in theoretical analysis, i.e. the number of water molecules that would initially break the structure of the [emim][Gly]. The calculated thermodynamics characteristics of [emim][Gly] by molecular dynamics (MD) simulations are compared with experiments related to interstice theory. The molecular shapes and frontier electron densities of Yang37,38 are applied to fit the volume data of water and prove the effect of the interstice volume of ILs on the [emim][Gly] properties. Finally, the microscopic structure of the [emim][Gly], water aggregation, and the connection between them are elaborately explored.

2. Computational details

2.1 Molecular dynamics (MD) simulations

All the MD runs for aqueous solutions were performed using the Tinker 4.2 molecular modeling package.39 For the ILs, the force field was based on an AMBER-type parametrization,40 and this force field has been specifically optimized for imidazolium-based ILs and widely used in other studies.41 The restraint electrostatic potential (RESP) charges42 were fitted to determine the ionic charges of the [emim][Gly] by the RED III scheme.43 The TIP3P model was used to represent water.44 The labeling scheme used for [emim][Gly] is shown in Scheme 1, and the complete set of force field parameters is given in the ESI (Table S1 and Fig. S1).
image file: c3ra47410k-s1.tif
Scheme 1 Schematic structure and atom-type notations of the 1-ethyl-3-methylimidazolium cation ([emim]+) and glycine anion ([Gly]) in the AMBER force field.

We prepared eight model systems containing solutions with xw = 0, 0.25, 0.33, 0.5, 0.67, 0.75, 0.89, and 0.92 (Table 1). The initial system geometries were generated by randomly inserting [emim][Gly] and water molecules into the simulation cell and then allowing the system to relax. This step was followed by equilibrating the system for 1 ns within the NPT ensemble at 298 K and 0.1 MPa, which were controlled by the Berendsen method.45 After the equilibration, the total intermolecular energies and densities were monitored until a steady state was reached, for example, Fig. S2 in the ESI shows the evolution of the pure [emim][Gly] system, as a function of time. Then, the next 1 ns trajectory within NPT was carried out to obtain the density and molar volume. Finally, considering the specific viscosity of the ILs, the production stage was continued for 5 ns under the NVT ensemble. During the production stage, configurations of the simulation box were recorded every 0.2 ps for the subsequent structural analysis. Cubic periodic boundary conditions were used to simulate the bulk liquid with the long-range electrostatic interactions, computed using the Ewald summation.

Table 1 Summary of the simulation box composition used to calculate different [emim][Gly] aqueous solutionsa
System xw xIL Nw NIL Box (Å3)
a xw is the water molar fraction, and NIL and Nw are the numbers of ionic-liquid pairs and water molecules in each simulation box.
Pure IL 0.0 1.0 0 192 36.90
3[thin space (1/6-em)]:[thin space (1/6-em)]1 0.25 0.75 64 192 37.00
2[thin space (1/6-em)]:[thin space (1/6-em)]1 0.33 0.67 96 192 37.26
1[thin space (1/6-em)]:[thin space (1/6-em)]1 0.50 0.50 192 192 37.91
1[thin space (1/6-em)]:[thin space (1/6-em)]2 0.67 0.33 192 96 30.98
1[thin space (1/6-em)]:[thin space (1/6-em)]3 0.75 0.25 192 64 27.84
1[thin space (1/6-em)]:[thin space (1/6-em)]8 0.89 0.11 192 24 22.67
1[thin space (1/6-em)]:[thin space (1/6-em)]12 0.92 0.08 192 16 21.29


2.2 Water aggregate analysis

Several statistical functions were used to quantitatively evaluate and analyze the size and morphology of the water aggregates. The water molecules were considered to be connected whenever the O⋯O distance was less than 3.5 Å. By letting p(n) be the probability of existence of a cluster of n water molecules (n-water for short), p(n) was calculated by counting and then normalizing the number of their occurrences throughout an entire MD simulation. A related probability, P(n), which is more sensitive to finding a given water molecule in an aggregate of size n, was calculated as follows:41
image file: c3ra47410k-t1.tif
The nature of the water clusters surrounding the ions in ILs was further investigated through the following connectivity index:41
image file: c3ra47410k-t2.tif
where 〈Nbn is the average number of intermolecular “bonds” among water molecules within an n-water cluster, and Cw is an index designed to yield different values for different cluster connectivities (Cw = 1 corresponds to a linear association of water molecules, a circularly connected trimer would have Cw = 3/2, a circular tetramer would have Cw = 4/3, etc.). The upper limit for Cw is obtained for an infinite cluster of tetrahedrally coordinated water molecules (as in bulk water), where Cw = 2.

2.3 Interstice model

For pure ILs, Yang et al.34 put forward a new theory, i.e., the interstice model, to describe the properties of ILs. Given the large size and asymmetric shape of cations and anions, the ions may not be closely packed and many interstices between ions may exist. To easily calculate the volume, the interstice is regarded as a bubble. Additionally, classical statistical mechanics can be used to obtain the expression for calculating the interstice molecular volume Vinterstice:
Vinterstice = 1.3582(kbT/γ)3/2
where kb is Boltzmann's constant, T is the thermodynamic temperature, and γ is the surface tension of IL. The expression can be used to determine how many water molecules exist in the interstice and how those water molecules affect the properties of ILs.

3. Experimental details

3.1 Materials

Distilled deionized water with a conductance of (0.8 to 1.2) × 10−4 S m−1 was used. N-methylimidazole (AR grade), 1-bromoethane (AR grade), ethyl acetate, and acetonitrile were distilled prior to use. Glycine (mass fraction >99%) and anion-exchange resin (type 717) were purchased from the Shanghai Chemical Reagent Co., Ltd. and activated by the common method before use.

3.2 Preparation of [emim][Gly]

The glycine based IL was prepared by a neutralization method according to Fukumoto et al.,4 and the clear preparation process has been previously described by Yang.34,46 The structure of the resulting compound was confirmed by 1H NMR spectroscopy, as listed in Fig. S3 (ESI). Calorimetric data were obtained with a differential scanning calorimetry (DSC) system (Mettler-Toledo Co., Switzerland). The heating rate was 10 °C min−1. The DSC measurements showed that [emim][Gly] had no obvious melting point, but the value of the glass transition temperature was −79.74 °C. The DSC data are shown in Fig. S3B (ESI). The water content w2 (in mass fraction) in [emim][Gly] was determined with a Karl Fischer moisture titrator (ZSD-2 type).

3.3 Measurement of density and surface tension

For [emim][Gly] to strongly form hydrogen bonds with water, the AAILs contain a small amount of water that is difficult to remove by the common method. To consider the effect of water, SAM was applied to these measurements, and the corresponding samples of [emim][Gly] with different water contents were prepared.

An Anton Paar DMA 4500 oscillating U-tube densitometer was used to measure the density of the samples. The temperature in the cell was regulated to ±0.01 K with a solid state thermostat. Before the measurement, the apparatus was calibrated once a day with dry air and double-distilled, freshly degassed water. The value of the density of pure water was then measured by the calibrated apparatus at 298.15 ± 0.01 K and agreed well with the literature, within the experimental error.47 Finally, the densities of [emim][Gly] with different water contents were measured at the same temperature.

By the use of the tensiometer of the forced bubble method (DPAW type produced by Sang Li Electronic Co.), the surface tension of water was measured at 298.15 ± 0.01 K and was in good agreement with the literature, within an experimental error of ±0.1 mJ m−2.47 Then, the values of the surface tension of the samples were measured by the same method at 298.15 ± 0.01 K.

4. Results and discussion

4.1 Thermodynamic properties

4.1.1 Density. The density values of [emim][Gly] containing various water contents at 298.15 ± 0.01 K as determined by SAM experiment are listed in Table 2, and each value is the average of three measurements. Based on SAM, the values of density are plotted against the water content (wH2O), as shown in Fig. 1. The values reveal the existence of a maximum in the solution–density curve. In particular, when the water mass fraction wH2O is 2.105%, the maximum density for the [emim][Gly]–H2O mixture is 1.17409 g cm−3, and the density gradually decreases with increased water content. Additionally, the inset in Fig. 1 shows that at a very low water content (wH2O < 2.105%), a straight line is obtained. The intercept of this line is the value of the density for pure [emim][Gly] (1.1721 g cm−3), which can be seen as the experimental value. For the value and trend of the density of the [emim][Gly]–H2O mixture at 298.15 K, some differences are observed in the previous works using a Westphal balance,46 which should be corrected.
Table 2 Density values (g cm−3) of [emim][Gly] containing various amounts of water at 298.15 K by standard addition method (SAM) experiments
wH2Oa ρ wH2Oa ρ wH2Oa ρ
a wH2O is the water mass fraction.
0.9981% 1.17303 1.206% 1.17326 1.445% 1.17361
1.694% 1.17382 1.981% 1.17399 2.105% 1.17409
2.260% 1.17402 2.411% 1.17388 2.563% 1.17381
2.711% 1.17368 2.863% 1.17351 3.025% 1.17335
3.175% 1.17314 0.0 1.1721    


image file: c3ra47410k-f1.tif
Fig. 1 Plot of density vs. the amount of water in [emim][Gly] by SAM experiment (a) and MD simulations (b). The inset in (a) shows the density at a very low water content, and the intercept of this is the experimental density for pure [emim][Gly]. Displayed in the inset of (b) is the excess molar volume.

A comparison between the thermodynamics properties derived from experiment and those derived from the MD simulations were then conducted. We first benchmarked the force fields used for the [emim][Gly] in this paper. From constant-pressure MD simulations, the density (ρ) and molar volume (Vm) of pure [emim][Gly] were calculated and are listed in Table 3. The predicted ρ and Vm are 1.1960 g cm−3 and 154.88 cm3 mol−1 at 300 K, respectively, which agree well with the experimental density (1.1721 g cm−3) and molar volume (158.04 cm3 mol−1) by SAM at 298.15 K.46

Table 3 Experimental and simulated properties of [emim][Gly] aqueous solutions, including density ρ (g cm−3), molar volume Vm (cm3 mol−1), intermolecular energy Uinter (kJ mol−1), heat of vaporization ΔHvap (kJ mol−1), excess molar volume VEm (cm3 mol−1), and cohesive energy c (J cm−3)a
System xw wH2Ob ρ Vm VEm Uinter ΔHvap c
a The simulation temperature was 300 K.b wH2O is the water mass fraction.c Experimental data by standard addition method.
Pure 0.0 0.0 1.1721c 158.04c     150.36c  
    1.1960 154.88 0.0 −534.448 137.92 874.4
3[thin space (1/6-em)]:[thin space (1/6-em)]1 0.25 3.137% 1.1993 119.60 −1.167 −418.856 122.08 999.9
2[thin space (1/6-em)]:[thin space (1/6-em)]1 0.33 4.567% 1.1968 108.66 −1.178 −357.156 92.30 826.5
1[thin space (1/6-em)]:[thin space (1/6-em)]1 0.50 8.856% 1.1897 85.42 −1.225 −296.741 99.72 1144.0
1[thin space (1/6-em)]:[thin space (1/6-em)]2 0.67 16.478% 1.1865 61.68 −1.754 −204.706 75.52 1183.9
1[thin space (1/6-em)]:[thin space (1/6-em)]3 0.75 22.572% 1.1787 50.74 −1.778 −169.298 72.04 1370.5
1[thin space (1/6-em)]:[thin space (1/6-em)]8 0.89 44.015% 1.1268 32.30 −1.112 −93.7040 52.31 1486.4
1[thin space (1/6-em)]:[thin space (1/6-em)]12 0.92 52.734% 1.1048 28.40 −0.916 −74.9789 45.55 1516.0


The densities of the mixture of H2O and [emim][Gly] are obtained from the MD simulations at different mole fractions of H2O and xw, as shown in Fig. 1 and Table 3. The densities are approximately decreased by the presence of water and strongly depend on the molar fraction of the water added. Interestingly, the densities of the [emim][Gly]–water mixture change to be slightly larger until xw = 0.25 (wH2O ≈ 3.137%), as listed in Table 3, and this phenomenon has been found in our previous experiments. For other typical ILs, such as [emim][NTf2] and [bmim][BF4], a slightly increasing trend has also been observed28 but has not attracted considerable attention. The interstice model provides a coherent explanation for this phenomenon. Given the large size and asymmetric shape of cations and anions in ILs, the ions may not be closely packed and many interstices may exist between ions. Thus, with small amounts of water, the intruding water preferred to enter the interstice through strong hydrogen bonds, which inevitably resulted in the slight increase in density and difficulty removing trace water from ILs. The specific water states, especially the number of water molecules in the interstice, are discussed in the following sections.

The non-linear behavior of densities clearly demonstrates the non-ideality of the [emim][Gly]–H2O mixtures, and this non-ideality can be measured through the excess thermodynamic properties. The inset in Fig. 1 shows VEm as a function of the mole fraction of water. Notably, the negative deviations from the ideal behavior may be attributed to the attractive interactions between [emim][Gly] and H2O. Although no experimental data are available for [emim][Gly], Torres48 measured the positive deviation in the VEm of [bmim][BF4] mixture, whereas Brennecke25 obtained the negative deviation for [emim][EtSO4]. We can observe that the plots of excess molar volume in Fig. 1 also reveal structural changes in moving from the IL-rich region to the water-rich region. Similar to the hydrophilic characteristic of [emim][Gly], VEm considerably decreases to about 1.2 cm3 mol−1 for xw = 0.25 (wH2O = 3.137%) and gently decreases until xw = 0.50 (wH2O = 8.856%). Then, VEm continuously decreases and then considerably increases beyond about xw > 0.80 (wH2O = 44.015%).

4.1.2 Interaction energy. Kabo et al.49 proposed an empirical equation to estimate the molar enthalpy of vaporization, ΔHvap:
ΔHvap = 0.01121(γV2/3mN1/3) + 2.4
where Vm is molar volume, N is Avogadro's constant, and γ is surface tension. Similar to density, γ for pure [emim][Gly] is the intercept of the straight line, 53.50 × 10⁻³ N m−1, plotted as the experimental surface tension against the water content, as shown in Fig. 2 (the specific experimental data are listed in Table S2). The calculated values of the molar enthalpy of vaporization for [emim][Gly] are 150.36 kJ mol−1.

image file: c3ra47410k-f2.tif
Fig. 2 Plot of surface tension vs. amount of water in [emim][Gly] by SAM at 298.15 K, where r is the correlation coefficients and s is the standard deviations.

The enthalpy of vaporization and the cohesion (c) of the particles in the liquid phase are related to the change in internal energy, Uinter, which can be directly extracted from the MD simulations. Our estimations of ΔHvap and c are calculated as:

ΔHvap = RT − (UinterxwUionpair)

c = −(UinterxwUionpair)/Vm
where xw is the mole fraction of [emim][Gly], R is the gas constant, and Vm is the calculated molar volume, listed in Table 3. Uionpair represents the intermolecular energy between the cations and anions of the gas-phase ion pair, which can be obtained by DFT calculation. The corresponding value of [emim][Gly] is 399.02 kJ mol−1 in our previous work.50 ΔHvap for pure [emim][Gly] is calculated to be around 139.33 kJ mol−1 at 300 K, which agrees with the estimated value by Kabo's function in our previous work (150.36 kJ mol−1), as also listed in Table 3.

The ΔHvap of the pure [emim][Gly] is similar to those of typical ILs. For example, the experimental vaporization enthalpy of [emim][BF4], [emim][Tf2N], and [bmim][NO3] are 157, 134, and 163 kJ mol−1, respectively.51 These values are much higher than those of ordinary molecular solvents because of the strong electrostatic ionic interactions. The calculated ΔHvap energies decrease in an approximately parabolic manner with xw, but interestingly, the energies are relatively small as xw approaches 0.33. Such a special behavior can also be found for the cohesive energy densities, as listed in Table 3. We consider that the structural organization of the [emim][Gly]–H2O mixture must exhibit special points at a relatively low water content, as clearly explained by the microscopic structures described below. At 300 K, the cohesive energy densities are 874.4 J cm−3 for pure [emim][Gly], 761 J cm−3 for [emim][PF6], and 912.7 J cm−3 for [bmim][BF4].52,53 By contrast, the c values of the heavy hydrocarbons hexadecane and naphthalene are 268 and 410 J cm−3, respectively.54 The extremely high c value of [emim][Gly] mainly results from electrostatic interactions and explains why these liquids have such low volatility. Additionally, with an increased water fraction, the c values increase stepwise with the only exception mentioned above.

4.2 Microscopic structures

4.2.1 RDF of neat [emim][Gly]. To better understand the structure, various radial distribution functions (RDFs or g(r)) were computed for the pure [emim][Gly] IL. The center-of-mass RDFs for the cation–cation, cation–anion, and anion–anion pairs at 300 K and 1 bar are shown in Fig. 3. The sharp first peak between the cations and anions is at approximately 4.75 Å, which indicates the highly favored anion–cation association because of the strong electrostatic attraction. Ion correlations extended to a few nanometers correspond to at least some characteristic sizes of the ions, and the oscillations of the RDFs spanning beyond 17 Å are obtained, which are about a half of the length of the simulation box. The simulations with [emim][Gly] IL reveal an interesting feature not observed in previous simulations, for e.g., in the case of [emim][BF4].55 This feature is the presence of a shoulder in the cation–anion RDF at 5.35 Å and two distinctive peaks in the anion–anion RDF at 4.95 and 9.05 Å (Fig. 3a). This result reveals that the shoulder and the second peak of the center-of-mass RDF correspond to the orientational correlation of H bonds in the [Gly]–[emim]+–[Gly] arrangement.56 By integrating g(r) out to the location of the first minimum, the coordination number for the first solvation shell, N, can be calculated by the following equation:
image file: c3ra47410k-t3.tif
where ρ is the bulk density and rshell is the first minimum in g(r). When rshell is equal to 7.85 Å, the calculated coordination number N for the cation–anion first solvation shell is 5.3, indicating that each ion is surrounded by a cage of nearly five other counterions.

image file: c3ra47410k-f3.tif
Fig. 3 Center-of-mass radial distribution function for [emim]+–[Gly], [emim]+–[emim]+, and [Gly]–[Gly] (a), and atomic partial radial distribution between (b) H atoms of [emim]+ and O atom of [Gly], (c) H atoms of [emim]+ and N atom of [Gly].

Previous studies have analyzed the liquid structure by examining site–site pair RDFs. Fig. 3b and c show the RDFs between the oxygen and nitrogen atoms of [Gly] and different hydrogen atoms of [emim]+, respectively. The hydrogen atoms of the cation are found to preferably distribute around the carbonyl O atom rather than the nitrogen atom in the anion. As shown in Fig. 3, the order of the activities of different H atoms in the cation is H2 > H4 > H1 = HC, which is consistent with the ab initio optimized geometry of the gas-phase ionic pairs for [emim][Gly].50

4.2.2 Structure after water addition. Next, we considered the local structure of the ILs after water addition. The cation–anion, cation–water, and anion–water center-of-mass RDFs are calculated for several water compositions and are shown in Fig. 4. Interestingly, the intensity of the first maximum of the RDF is higher when xw = 0.25 than when xw = 0 (i.e. pure [emim][Gly]), which is evident from the inset of Fig. 4a. This finding further confirms the trend, i.e., an increase in density with increase in water content for all the values of xw < 0.33, as mentioned above. Furthermore, when the content of water is low, the water molecules occupy the interstices without significantly influencing the size of the equilibrium box (Table 1), thereby, partially strengthening the interactions between the ions. As is evident from the inset of Fig. 4a, such strengthening is, however, not significant. With a further increased water concentration (xw = 0.33), the sharp first peak begins to decrease; in particular, the second weaker peak shifts to larger distances than those of the neat [emim][Gly]. At xw = 0.5, although the center-of-mass RDF for the cation–anion is similar to that of xw = 0.33, the peak for the site–site RDF between the carbonyl O2 in [Gly] and H2 in [emim]+ is significantly weakened, as shown in Fig. S4. Close-up snapshots from the simulation for the four mole fractions (pure, low, medium, and high) capture clearer characteristics, as shown in Fig. 5. At low mole fractions (xw < 0.33), the cation–anion networks are nearly similar to those of the pure [emim][Gly], and few water molecules can strengthen the cation–anion interactions. At 0.33 < xw < 0.50, the cation–anion network starts to break apart, and the cation–anion interactions gradually loosen. With continuous dilution, the cation–anion networks drastically decrease at xw = 0.75. At xw = 0.92, ion clusters are generated and dispersed in a continuous water phase, and only loose H-bond interactions exist, because of the dominant water–water interactions.
image file: c3ra47410k-f4.tif
Fig. 4 Center-of-mass radial distribution function for [emim]+–[Gly] (a), [emim]+–H2O (b), and [Gly]–H2O (c). The focus curves correspond to the different water mole fractions. Displayed in the inset of (a) is the RDF between 4.0 Å to 7.0 Å for pure IL and for IL when xw = 0.25.

image file: c3ra47410k-f5.tif
Fig. 5 Close-up snapshots of the cation–anion interaction in the [emim][Gly]–H2O mixtures: (a) pure [emim][Gly], (b) xw = 0.33, (c) xw = 0.75, and (d) xw = 0.92. All panels were enlarged by a similar scale.

The cation–water and anion–water center-of-mass RDFs show that for a given solution, the first peak corresponding to the anion–water distances is higher and occurs at smaller separations than those observed for the cation–water counterparts. This finding suggests that water preferentially associates with [Gly] rather than [emim]+, which is also illustrated by the site–site RDFs shown in Fig. S5. For anion–water and cation–water, the first peaks gradually weaken with an increased water content, which agrees with the results for other ILs.28–30 At a low water content (xw = 0.25 and 0.33), the first and second peaks of the anion–water RDFs are almost unaffected, whereas for xw = 0.5, the first peak is significantly lower and the second peak gradually broadens, shift to a larger distance, and eventually disappears. Additionally, in the case of the water–ion interactions (Fig. 4 and S4), the intensities almost decrease with an increased solution dilution. This does not necessarily indicate that the interactions between water and ions are weakened by solution dilution. The observed intensity shifts are controlled by the concentration and heterogeneous distribution of each species in solution. For [emim][Gly]-rich solutions, the water molecules tend to accumulate near the glycine anions, giving rise to the highest first and second peaks of the RDFs in Fig. 4, and the solutions become more heterogeneous. With further dilution, the water molecules start to accumulate more homogeneously, thereby contributing to the observation of progressively less intense first peaks and vanished second peaks.57

4.3 Water aggregation

The water clustering/aggregation was investigated by analyzing pair correlation hints and visually inspecting the simulation snapshots with increased xw. The snapshots in Fig. 6 clearly illustrate that in the solution with xw < 0.33, the water molecules are surrounded by less one other water molecule, i.e., isolated water and dimer clusters exist. This finding corroborates previous results obtained for other IL solutions. This finding is also illustrated by the several less intense peaks of water–water RDFs at xw < 0.33 in Fig. 7, where the heterogeneous nature of water surrounding the ions is clearly evident, and the water molecules are located in the interstice of [emim][Gly].
image file: c3ra47410k-f6.tif
Fig. 6 Snapshots of water–water interaction in [emim][Gly]–H2O mixtures for mole fraction: (a) xw = 0.25, (b) xw = 0.33, (c) xw = 0.50, (d) xw = 0.67, (e) xw = 0.75, and (f) xw = 0.92. A water monomer and a water dimer intercalated between [emim]+ and [Gly] are shown in panels (a) and (b). With further increased water concentration, the evolution of larger water clusters, such as timers and tetramers can be observed in (c) and (d), thereby effectively forming a second continuous phase ultimately in panel (f).

image file: c3ra47410k-f7.tif
Fig. 7 Center-of-mass radial distribution function for water–water in [emim][Gly]–H2O mixtures. The focus curves correspond to different water mole fractions. Displayed in the inset is water–water RDFs for low water contents.

For xw = 0.5, the RDF between the water molecules starts to show two pronounced peaks at 2.75 and 6.85 Å. Additionally, at rshell = 4.55 Å, N for the water–water first solvation shell is 1.83. The snapshot in Fig. 6 also shows not only water dimers, but also trimers at xw = 0.5. At xw > 0.5, the water network tends to be gradually observed and eventually forms a second continuous microphase. The second peaks for the water–water RDFs are broadened and shifted to larger distances compared with those at xw < 0.5. At xw > 0.9, the less intense first peak and the vanished second peak indicate that the water molecules start to accumulate more homogeneously and begin to show structural features resembling those of pure water (Fig. 6).

Combined with the above analysis, we conclude that a turnover at about xw ≈ 0.33 occurs. Before this point, the added water enters the interstice of [emim][Gly] and primarily exists as isolated water and dimer, and no larger water aggregations are observed. Based on the interstice model, the average volume of the interstice of [emim][Gly] can be obtained (Vinterstice = 28.99 Å3), because of its surface tension (γ = 53.5 × 10⁻³ N m−1) at 298.15 K. This finding leads to the question, “How many can water molecules are located in these interstices and initially break the structure of [emim][Gly]?”. Based on the molecular intrinsic characteristic contour and water cluster structures,37,38 the calculated volumes of isolated water and dimer are about 13.55 and 31.37 Å3, respectively. Interestingly, the water monomer and dimer can comfortably be located in the interstices formed between [emim]+ and [Gly], and the water trimer in such interstices leads to crowding, which exactly explains the results of the analysis above. At this turnover point, the isolated and dimer molecules enter the interstices, which nearly do not change the IL network, and then slightly strengthen the interaction between the cation and anion. Thereafter, the gradual formation of relatively large water clusters distends the interstices and breaks the network of ILs. Although the activity of water in the interstices can be relatively lower, the effect on the IL properties is considerable.14

The P(n) probability for different solution compositions is shown in Fig. 8. At xw < 0.33, the molecules are isolated or belong to dimer clusters. At around xw = 0.5, another turnover occurs from a regime with water monomers, dimers, and trimers to a regime where larger aggregates become increasingly likely. At xw < 0.9, Fig. 6 and 8 clearly show that the water clusters span most of the possible size range. At xw > 0.9, almost all water molecules belong to a single large aggregate spanning the entire simulation box and gradually forms a second continuous phase.41,57 The connectivity index Cw can be used to further investigate the nature of water clusters surrounding the IL ions, such as spherical and compact droplets, linearly connected chains, or some intermediate simulations.41 Notably, the dimer clusters are excluded from the overall average because they are trivially linear. At xw < 0.5, the Cw index is always extremely close to unity, and the linear nature of the water cluster is clearly observed, as shown in Fig. 6 and 8. At xw = 0.5, 0.67, and 0.75, the calculated Cw values are 1.03607, 1.02186, and 1.0817, respectively. This finding indicates that after the two-water clusters located in the interstices, the water molecules highly favor to extension by the linear types through narrow slits in ILs. With further increased water content, i.e., at xw = 0.89 and 0.92, the Cw index gradually increases (1.149 and 1.285, respectively). This finding suggests that although the second continuous microphase of water is progressively formed, this microphase differs from that of the pure water system (as in bulk water, the Cw index nearly equals 2).


image file: c3ra47410k-f8.tif
Fig. 8 Probability of water molecules to belong to clusters of different sizes as a function of cluster size (a). Normalized histograms of P(N) for mole fraction: (b) xw = 0.33, (c) xw = 0.50, and (d) xw = 0.92 (obtained from MD simulation).

5. Conclusions

Classical MD simulation techniques and SAM are combined to gain new insights into the structural modifications accompanying the changes in the concentration of an [emim][Gly] aqueous solution. The static properties obtained by MD are found to be consistent with the reported experimental observations.

A particularly interesting result is that the maximum density of the [emim][Gly]–H2O solution is observed when the content of water xw < 0.33. The physical origins of this phenomenon are evaluated within the context of the interstice model, molecular intrinsic characteristic contour, microstructural RDF analyses, and statistical functions of the size and morphology of the water aggregates. Since the average volume of the interstices in the [emim][Gly] corresponds to the volume of a dimeric water molecule, at the low water content (xw < 0.33), the water molecules exist as isolated monomers and dimers in the interstices and no large aggregations of water molecules are observed. Although the monomers and dimers of water molecules cannot significantly modify the network of ILs, they are likely to promote the interactions between the cations and anions in the liquid. Consequently, changes in the specific properties of [emim][Gly], such as density, excess molar volume, and heat of vaporization, are observed in experimental evaluations and in MD simulations. At 0.33 < xw < 0.50, relatively larger clusters of water molecules (such as trimers), that are not located in the interstices, can be observed. The cation–anion network of the [emim][Gly] IL starts to break apart and subsequently, the cation–anion interactions gradually become weak. With a further dilution of the solution, the [emim]+–[Gly] network is largely disrupted, generating ion clusters dispersed in a continuous water phase.

Acknowledgements

The calculations reported in this paper were performed on the computational clusters operated by the Computing Center, Liaoning University. The authors would like to express their gratitude to Professor Jia-Zhen Yang at Liaoning University (LNU). We gratefully acknowledge the financial support provided by the National Natural Science Foundations of China (no. 21173107 and 21373104), the Natural Science Foundation of Liaoning Province (no. 20102088), the Scientific Research Foundation of the Education Department of Liaoning Province (no. L2011006), and the Foundation of 211 Project for Innovative Talents Training of Liaoning University.

References

  1. R. D. Rogers and K. R. Seddon, Science, 2003, 302, 792 CrossRef PubMed .
  2. R. Giernoth, Angew. Chem., Int. Ed., 2010, 49, 2834 CrossRef CAS PubMed .
  3. D. Parmentier, S. J. Metz and M. C. Kroon, Green Chem., 2013, 15, 205 RSC .
  4. K. Fukumoto, M. Yoshizawa and H. Ohno, J. Am. Chem. Soc., 2005, 127, 2398 CrossRef CAS PubMed .
  5. G. H. Tao, L. He, W. S. Liu, L. Xu, W. Xiong, T. Wang and Y. Kou, Green Chem., 2006, 8, 639 RSC .
  6. S. Taguchi, T. Matsumoto, T. Ichikawa, T. Kato and H. Ohno, Chem. Commun., 2011, 47, 11342 RSC .
  7. D. H. Dagade, K. R. Madkar, S. P. Shinde and S. S. Barge, J. Phys. Chem. B, 2013, 117, 1031 CrossRef CAS PubMed .
  8. H. Vallette, L. Ferron, G. Coquerel, A.-C. Gaumont and J.-C. Plaquevent, Tetrahedron Lett., 2004, 45, 1617 CrossRef CAS PubMed .
  9. N. Gathergood, M. T. Garcia and P. J. Scammells, Green Chem., 2004, 6, 166 RSC .
  10. X. Y. Mu, Q. Li, H. Z. Zhang, Y. Shen, J. Qiao and H. M. Ma, Talanta, 2012, 97, 349 CrossRef CAS PubMed .
  11. Y. Hamada, K. Yoshida, R. Asai, S. Hayase, T. Nokami, S. Izumi and T. Itoh, Green Chem., 2013, 15, 1863 RSC .
  12. B. F. Goodrich, J. C. de la Fuente, B. E. Gurkan, Z. K. Lopez, E. A. Price, Y. Huang and J. F. Brennecke, J. Phys. Chem. B, 2011, 115, 9140 CrossRef CAS PubMed .
  13. W. Shi, C. R. Myers, D. R. Luebke, J. A. Steckel and D. C. Sorescu, J. Phys. Chem. B, 2012, 116, 283 CrossRef CAS PubMed .
  14. M. G. Freire, C. M. S. S. Neves, P. J. Carvalho, R. L. Gardas, A. M. Fernandes, I. M. Marrucho, L. M. N. B. F. Santos and J. A. P. Coutinho, J. Phys. Chem. B, 2007, 111, 13082 CrossRef CAS PubMed .
  15. Y. Kohno and H. Ohno, Chem. Commun., 2012, 48, 7119 RSC .
  16. U. Schröder, J. D. Wadhawan, R. G. Compton, F. Marken, P. A. Z. Suarez, C. S. Consorti, R. F. de Souza and J. Dupont, New J. Chem., 2000, 24, 1009 RSC .
  17. T. Köddermann, C. Wertz, A. Heintz and R. Ludwig, Angew. Chem., Int. Ed., 2006, 45, 3697 CrossRef PubMed .
  18. M. López-Pastor, M. J. Ayora-Cañada, M. Valcárcel and B. Lendl, J. Phys. Chem. B, 2006, 110, 10896 CrossRef PubMed .
  19. L. Q. Zhang, Z. Xu, Y. Wang and H. R. Li, J. Phys. Chem. B, 2008, 112, 6411 CrossRef CAS PubMed .
  20. A. Mele, C. D. Tran and D. H. De Paoli Lacerda, Angew. Chem., Int. Ed., 2003, 42, 4364 CrossRef CAS PubMed .
  21. S. Rivera-Rubero and S. Baldelli, J. Am. Chem. Soc., 2004, 126, 11788 CrossRef CAS PubMed .
  22. S. Saha and H.-O. Hamaguchi, J. Phys. Chem. B, 2006, 110, 2777 CrossRef CAS PubMed .
  23. S. Trivedi, N. I. Malek, K. Behera and S. Pandey, J. Phys. Chem. B, 2010, 114, 8118 CrossRef CAS PubMed .
  24. M. G. Freire, P. J. Carvalho, R. L. Gardas, I. M. Marrucho, L. M. N. B. F. Santos and J. A. P. Coutinho, J. Phys. Chem. B, 2008, 112, 1604 CrossRef CAS PubMed .
  25. L. E. Ficke and J. F. Brennecke, J. Phys. Chem. B, 2010, 114, 10496 CrossRef CAS PubMed .
  26. Q. G. Zhang, N. N. Wang and Z. W. Yu, J. Phys. Chem. B, 2010, 114, 4747 CrossRef CAS PubMed .
  27. C. G. Hanke, N. A. Atamas and R. M. Lynden-Bell, Green Chem., 2002, 4, 107 RSC .
  28. A. R. Porter, S. Y. Liem and P. L. A. Popelier, Phys. Chem. Chem. Phys., 2008, 10, 4240 RSC .
  29. H. V. Spohr and G. N. Patey, J. Chem. Phys., 2010, 132, 234510 CrossRef PubMed .
  30. C. E. S. Bernardes, M. E. Minas da Piedade and J. N. Canongia Lopes, J. Phys. Chem. B, 2011, 115, 2067 CrossRef CAS PubMed .
  31. W. Shi, K. Damodaran, H. B. Nulwala and D. R. Luebke, Phys. Chem. Chem. Phys., 2012, 14, 15879 RSC .
  32. L. I. N. Tomé, F. R. Varanda, M. G. Freire, I. M. Marruvho and J. A. P. Coutinho, J. Phys. Chem. B, 2009, 113, 2815 CrossRef PubMed .
  33. A. P. Abbott, ChemPhysChem, 2004, 5, 1242 CrossRef CAS PubMed .
  34. J. Z. Yang, X. M. Lu, J. S. Gui and W. G. Xu, Green Chem., 2004, 6, 541 CAS .
  35. I. Bandrés, R. Alcalde, C. Lafuente, M. Atilhan and S. Aparicio, J. Phys. Chem. B, 2011, 115, 12499 CrossRef PubMed .
  36. W. Beichel, Y. Yu, G. Dlubek, R. Krause-Rehberg, J. Pionteck, D. Pfefferkorn, S. Bulut, D. Bejan, C. Friedrich and I. Krossing, Phys. Chem. Chem. Phys., 2013, 15, 8821 RSC .
  37. Z. Z. Yang, D. X. Zhao and Y. Wu, J. Chem. Phys., 2004, 121, 3452 CrossRef CAS PubMed .
  38. L. D. Gong and Z. Z. Yang, J. Comput. Chem., 2010, 31, 2098 CrossRef CAS PubMed .
  39. J. W. Ponder, TINKER: Software Tools for Molecular Design, 4.2, Washington University School of Medicine, Saint Louis, MO, 2004 Search PubMed .
  40. W. D. Cornell, P. Cieplak, C. I. Bayly, I. R. Gould, K. M. Merz, D. M. Ferguson, D. C. Spellmeyer, T. Fox, J. W. Caldwell and P. A. Kollman, J. Am. Chem. Soc., 1995, 117, 5179 CrossRef CAS .
  41. M. Moreno, F. Castiglione, A. Mele, C. Pasqui and G. Raos, J. Phys. Chem. B, 2008, 112, 7826 CrossRef CAS PubMed .
  42. C. I. Bayly, P. Cieplak, W. D. Cornell and P. A. Kollman, J. Phys. Chem., 1993, 97, 10269 CrossRef CAS .
  43. F.-Y. Dupradeau, A. Pigache, T. Zaffran, C. Savineau, R. Lelong, N. Grivel, D. Lelong, W. Rosanski and P. Cieplak, Phys. Chem. Chem. Phys., 2010, 12, 7821 RSC .
  44. W. L. Jorgensen, J. Chandrasekhar, J. D. Madura, R. W. Impey and M. L. Klein, J. Chem. Phys., 1983, 79, 926 CrossRef CAS PubMed .
  45. H. J. C. Berendsen, D. van der Spoel and R. van Drumen, Comput. Phys. Commun., 1995, 91, 43 CrossRef CAS .
  46. J. Z. Yang, Q. G. Zhang, B. Wang and J. Tong, J. Phys. Chem. B, 2006, 110, 22521 CrossRef CAS PubMed .
  47. D. R. Lide, Handbook of Chemistry and Physics, 82nd edn, CRC Press, Boca Raton, FL, 2001–2002 Search PubMed .
  48. K. R. Seddon, A. Stark and M. J. Torres, Pure Appl. Chem., 2000, 772, 2275 CrossRef .
  49. D. H. Zaitsau, G. J. Kabo, A. A. Strechan and Y. U. Paulechka, J. Phys. Chem. A, 2006, 110, 7303 CrossRef CAS PubMed .
  50. W. Yang and T. T. Zhang, J. Phys. Chem. A, 2009, 113, 12995 CrossRef PubMed .
  51. U. Preiss, S. P. Verevkin, T. Koslowski and I. Krossing, Chem.–Eur. J., 2011, 17, 6508 CrossRef CAS PubMed .
  52. T. I. Morrow and E. J. Maginn, J. Phys. Chem. B, 2002, 106, 12807 CrossRef CAS .
  53. X. P. Wu, Z. P. Liu, S. P. Huang and W. C. Wang, Phys. Chem. Chem. Phys., 2005, 7, 2771 RSC .
  54. J. H. Hildebrand and R. L. Scott, Regular Solutions, Prentice Hall, New Jersey, 1962 Search PubMed .
  55. O. Borodin and G. D. Smith, J. Phys. Chem. B, 2006, 110, 11481 CrossRef CAS PubMed .
  56. T. M. Chang, L. X. Dang, R. Devanathan and M. Dupuis, J. Phys. Chem. A, 2010, 114, 12764 CrossRef CAS PubMed .
  57. C. E. S. Bernardes, M. E. Minas da Piedade and J. N. Canongia Lopes, J. Phys. Chem. B, 2011, 115, 2067 CrossRef CAS PubMed .

Footnote

Electronic supplementary information (ESI) available. See DOI: 10.1039/c3ra47410k

This journal is © The Royal Society of Chemistry 2014