Ethanol adsorption on rutile TiO2(110)

Carmen Pérez León *a, Keisuke Sagisakaa, Daisuke Fujitaa and Liyuan Hanb
aNano Characterization Unit, National Institute for Materials Science (NIMS), 1-2-1 Sengen, Tsukuba, Ibaraki 305-0047, Japan. E-mail: carmen.perez.leon@kit.edu
bPhotovoltaic Materials Unit, National Institute for Materials Science (NIMS), 1-2-1 Sengen, Tsukuba, Ibaraki 305-0047, Japan

Received 6th December 2013 , Accepted 6th January 2014

First published on 7th January 2014


Abstract

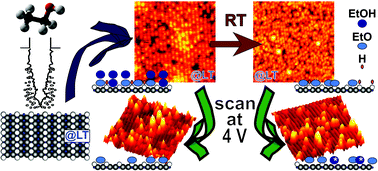
We investigated ethanol adsorption on TiO2(110) surfaces with scanning tunneling microscopy (STM) at 78 K. The ethanol was deposited by pulse injection. The STM images show that the ethanol molecules adsorbed above Ti4+ sites formed rows in the [001] direction even in the case of multilayer adsorption. Ethanol desorbed from the surface when the sample was annealed to room temperature, and the multilayer was reduced to a monolayer. Mainly ethoxy groups remained attached to the surface, and the majority of them were bound to the Ti rows. Furthermore, electron-stimulated desorption experiments revealed that only a few molecules desorbed from the surface when the scans were conducted with a sample bias ≥+3 V. In contrast, when scans were conducted at ≥+4 V, the majority of the hydrogen and covalent bonds between the adsorbates and the rutile were broken and only a small amount of species remained adsorbed on the surface. In the case of the cold dose without further annealing, the remaining ethoxy groups preferentially adsorbed on the Ti rows, whereas in the case of the annealed surface, many of the ethoxys shifted to oxygen bridging sites. This change in the adsorption behavior can be explained by the different oxidation states of the surface, which play an important role in the adsorption-desorption process.

1 Introduction

Adsorption of organic molecules on titanium oxides surfaces has been extensively investigated during the last decade.1–4 TiO2-based materials are of great interest owing to their technological applications. Their highly oxidizing properties make them suitable, for, e.g., photocatalysis, photo-assisted degradation of organic molecules, and photovoltaic cells.1,5 Rutile TiO2(110) is one of the most thermodynamically stable faces of titania.1,5 Its availability and the fact that it is easily prepared have meant that it is now the most common model system for surface and adsorption research, consequently, its structure is quite well understood. Alcohols and their reactivity with TiO2 have been often used to study photocatalytic oxidation of organic contaminants, since their decomposition reveals the catalytically active sites on metal oxide surfaces.1–3,5–7 Many techniques have been used for analyzing such systems; scanning tunnelling microscopy (STM), especially conducted in ultrahigh vacuum (UHV), provides high-resolution images of the topographic and electronic structure of molecules adsorbed on metal or semiconductor surfaces. Thus, it enables us to study directly the interaction of alcohols with the titania surface, and to reveal their reactive sites at the molecular level and the role of surface defects.

STM studies on methanol adsorption on TiO2(110) have shown that molecules adsorb preferentially at Ti4+ sites when the deposition is carried out at 80 K.8 Methanol dissociates under UV light illumination, and the resulting H adatoms transfer to neighboring bridging oxygen sites.8 If the dose is done at 300 K, methanol dissociates at bridging oxygen vacancies via O–H bond scission.9 Methoxy species fill such vacancies, whereas H adatoms move to neighboring bridging oxygen sites as in the case of adsorption at low temperature.8 When the number of methanol molecules is larger than the number of oxygen vacancies the excess methanol becomes mobile.9 Concerning adsorption of ethanol on rutile, X-ray photoelectron spectroscopy (XPS) and temperature programmed desorption (TPD) studies on {011}-faceted TiO2(001) found that molecular and dissociated adsorbed species coexisted after dosing at 200 K, but only dissociated species were adsorbed after dosing at 300 K.10 Moreover, Gamble et al. used XPS and TPD to study the adsorption of ethanol on the stoichiometric TiO2(110) surface at 125 K.11 They reported that half of the ethanol molecules dissociatively adsorbed at Ti4+ sites.11 In their TPD experiments, the peak at 160 K was ascribed to ethanol multilayer desorption; the peak at 180–250 K was ascribed to desorption of molecular ethanol in the first layer, and the broad peak between 250 and 400 K was ascribed to ethoxy desorption. The broad peak results from protonation of surface ethoxys by surface H adatoms.11 Farfan-Arribas and Madix confirmed that the ethoxy groups recombined with H adatoms and desorbed as ethanol gas.12 Recently, Hansen et al. presented STM results on oxygen-defective TiO2(110) surfaces.13,14 They found that molecularly and dissociatively adsorbed ethanol coexisted at the Ti sites when the ethanol was deposited at 140 K. After annealing to 280 K, the species still coexisted, but the preferred adsorption site changed for almost half of the adsorbates to the bridging oxygen rows. Upon heating to 330 K, the remaining molecules were mainly attached to the bridging oxygen sites.13 For exposures at 300 K and subsequent annealing to 310 K, molecular and dissociated ethanol again adsorbed on rutile, whereas after heating to 380 K, the only ethoxy groups were at bridging oxygen sites. Their TPD results were similar to those of the previous studies, that is, desorption of the multilayer at 185 K, followed by desorption of the monolayer in contact with the surface around 310 K.13 The latest TPD experiments reported that the desorption temperatures for the first and second layer of ethanol ranged between 110–200 K and between 200–350 K, respectively.15 Recent first-principles DFT calculations predict that the dissociative adsorption mode on Ti4+ is slightly more favorable than the molecular one, in particular, this difference is predicted to be more pronounced on the oxygen defective rutile (110) surface.16 Moreover, molecular ethanol is only weakly bonded to Ti atoms via a lone oxygen pair,13,16 whereas the ethoxy groups bind strongly to Ti through covalent bonds.13 Although some research has been done, little is known about the adsorption of ethanol at high doses or coverages at the atomic scale, either on the oxygen defective or on the stoichiometric rutile surface. In addition, to date, the studies describing electron-induced effects of the STM tip on adsorbates on rutile have been restricted to small molecules only, and the impact on large molecules is still unknown.

In this article, we present our findings on the adsorption behavior of ethanol on the cold TiO2(110) surface with a low-temperature STM. For the deposition, we used a pulse-injection valve.17,18 The pulse-injection technique permits instantaneous interaction of large amounts of molecules with the surface. This brings us closer to real processes, such as the use of ethanol as solvent for dye-sensitization of the titania, in which a considerable volume of ethanol comes in contact with the surface, rather than the usual ideal experiments with evaporated molecules in UHV. However, a drawback of the technique is that the STM resolution is somewhat degraded, due to the large number of molecules. Nevertheless we were able to achieve atomic resolution. We investigated the multilayer adsorption, and examined the effect of annealing to room temperature on the ordering and dissociation states of ethanol. Additionally, we studied the influence of electron-stimulated effects induced by scanning the surface with a high sample bias, and compared it with effects that occur on stoichiometric and oxygen-defective pristine rutile surfaces.

2 Experimental

The experiments were performed in a UHV-STM-system consisting of several chambers. The rutile TiO2(110) substrate (SurfaceNet GmbH) was prepared using several cycles of 2.5 keV Ar+ sputtering and subsequent heating to 1020 K. The cleanness of the terraces was checked by STM. The ethanol was deposited on the rutile surface through a pulse valve (Series 9, Parker Instr.) with a control unit (IOTA One, Parker Instr.) located above and close to the substrate (8–10 cm). The valve was installed in a separate deposition chamber equipped with an independent pumping system. The diameter of the pulse valve orifice was 0.05 mm. The valve was opened for 9 ms three times, at intervals of several minutes, i.e., the time needed for recovering the base pressure (P < 5 × 10⁻⁸ Pa). While the valve was open, the pressure increased to 1–4 × 10⁻⁴ Pa. After the deposition, the sample was transferred to the analysis chambers where the base pressure was below 5 × 10⁻⁹ Pa, and was subsequently imaged by STM. The STM studies were performed with a low-temperature system (LT-STM, Unisoku, USM-1400) at 78 K using W tips in constant-current mode. The W tips were prepared by electrochemical etching and cleaned in UHV by electron heating. The desorption experiments were carried out in another chamber equipped with a quadrupole mass spectrometer (QMS, Pfeiffer PrismaPlus). The ethanol (99.9%), with a boiling temperature of 351 K, was purchased from MERK, degassed with freeze–pump and thaw cycles, and introduced to the chamber through the pulse valve.

Although the ethanol was treated with freeze–pump an thaw cycles, a check was performed for possible contamination with air.19 Accordingly, control experiments were carried out in which the substrate was exposed to a few pulses of air in the deposition chamber. The data (not shown) helped us to identify the effects of contamination.

3 Results and discussion

3.1 Pristine rutile surface

Fig. 1(a) & (b) shows STM images of the rutile TiO2(110) surface as prepared. A closer look at the (1 × 1) surface reveals bright and dark rows running along the [001] direction. It is agreed that the dark rows correspond to protruding bridging oxygens, whereas the bright rows correspond to fivefold-coordinated Ti atoms.1 Many point defects are present on the surface. Pale white dots in the dark rows are attributed to surface bridging oxygen vacancies, Ov. The brighter ones may correspond to OH groups and H adatoms on bridging oxygen, Obr, resulting from water dissociation, or to CO2 molecules since they have a similar appearance in STM images2,20 (e.g. the dots indicated with a white arrow in Fig. 1(a) & (b)). The few white dots in the bright rows may be H2O, O2 or CO molecules from residual gases in the UHV chamber21–24 (e.g. the dots indicated with a blue arrow in Fig. 1(a) & (b)). The image contrast of the vacancies and various adsorbates depends on the tunneling parameters,25,26 as can be seen by comparing Fig. 1(a) and (b), which were measured at +2 V and +3 V, respectively.
image file: c3ra47369d-f1.tif
Fig. 1 STM images of rutile TiO2(110). (a & b) After preparation. The contrast of the rutile surface, the oxygen vacancies (Ov), and the adsorbates depends on the tunneling parameters. The white arrows indicate adsorbed OH groups, while the blue arrows indicate either adsorbed H2O, O2 or CO molecules. Sample bias: (a) +2 V and (b) +3 V. (c) Surface shown in (a) and (b) after it was scanned at ≥+4 V. The majority of Ov were covered by OH and OH pairs. The circle indicates an unfilled Ov and the rectangle indicates a pair of oxygens. Sample bias: +3 V. (d) Line profiles along the lines in (c). All images were recorded with a tunneling current of 100 pA. Images size: 12 × 12 nm2.

It has been reported that the dissociation and desorption of various adsorbates on the rutile (110) surface can be induced by scanning with a high sample bias or by high-voltage pulses due to electron-stimulated processes. High-voltage pulses or scans dissociate O2, CO2, H2O and OH groups, and desorb H atoms from the surface.9,20,26–28 The dissociation of these molecules results in a “healing” of the Ov (filling in the vacancy with oxygen), and the desorption of hydroxyl groups in a “cleaning” of the surface (desorption of H-adatoms on the bridging oxygen). Thus, we performed scans at a high sample bias and investigated their influence on the defective rutile surface. The STM image in Fig. 1(b) does not show any effect from the scans at +3 V, apart from the change in contrast. However, after scanning at +4 V, the surface changes dramatically. Fig. 1(c) shows that most of the Ov disappeared (one remaining Ov is indicated with a circle), and that many features, probably corresponding to hydroxyls and H adatoms, appeared on the bridging oxygen rows. Water dissociatively adsorbs on Ov, with the OH group filling the vacancy, and the H adatom moving to an adjacent oxygen of the bridging rows.27,29 After analyzing the height of the new species, we found that we could classify them into adsorbates with two heights: ∼0.07 nm and ∼0.095 nm. A few profiles are shown in Fig. 1(d). We ascribed the small adsorbates to OHbr, and the large ones to OHbr pairs.25,27,28 It seems that owing to electron-stimulated processes, the oxygen vacancies reacted with the residual gases present in the chamber at P < 5 × 10⁻⁹ Pa, particularly with water.

After the STM characterization, the clean and cold rutile single crystal was transferred to the deposition chamber. There, ethanol was deposited and the crystal was transferred back to the STM where it was cooled down for further analysis. We also performed control experiments in which the TiO2(110) was transferred to the deposition chamber and brought back to the STM without further processing or deposition. The STM image in Fig. 2(a) reveals that the rutile surface was strongly influenced by this transfer. Most of the oxygen vacancies disappeared. Apparently, the surface reacted with the residual gases of the deposition chamber even at the base pressure of 3 × 10⁻⁸ Pa. This led to a “healing” of the Ov. At the same time, new features appeared on the titanium atoms. After analyzing their height, we classified them into: small and large species, with apparent heights of ∼0.095 nm and ∼0.13 nm, respectively. Presumably, they respectively correspond to H2O molecules and H2O dimers.24 A few oxygen atoms also appeared to adsorb on the Ti rows,22,30 e.g. the two oxygen adatoms indicated with an arrow in Fig. 2(a) & (b). The effect of scanning the “healed” surface with a high sample bias was substantially different from that of scanning the oxygen defective surface. Scanning at ≥+3 V caused the water molecules, but not the H2O dimers, to start diffusing on the Ti rows. In contrast, scans at ≥+4 V desorbed almost all adsorbates, leaving a defect-free rutile surface. This means that the surface on which the ethanol is deposited is more similar to the healed or stoichiometric one than to the oxygen defective one. As we will see in the next section, this definitely affects the adsorption behavior of ethanol and the effect of the electron-stimulated processes.


image file: c3ra47369d-f2.tif
Fig. 2 STM images of TiO2(110) showing the influence on the surface of sample transfer and scanning with a high sample bias. (a) After the sample was transferred between the STM chamber and the deposition chamber, the majority of the Ov disappeared, and H2O and O appeared on the Ti rows. H2O and O are indicated by the blue and white arrows, respectively. Sample bias: +2 V. (b) Surface shown in (a) by scanning at +3 V. Some of the H2O molecules started diffusing along the Ti rows, but the H2O dimers did not. (c) Surface shown in (b) after it was scanned at ≥+4 V. Almost all of the adsorbates desorbed. Sample bias: +2 V. All images were recorded with a tunneling current of 50 pA. Images size: 12 × 12 nm2. (d) Line profiles along the lines in (a).

3.2 Rutile with ethanol

Fig. 3(a) shows the TiO2(110) surface after the ethanol deposition. The whole rutile surface appears to be homogeneously covered with features with circular to oval shape 0.6–0.7 nm in size, which we can primarily ascribe to ethanol species. The species adsorbed parallel to the rutile rows; some of them display a bright contrast and others a darker one. Since the titania surface was completely covered, we cannot discriminate whether the molecules were adsorbed at the Ti or O sites. However, in Fig. 3(b), the tip unintentionally modified the molecular layer during the scan, and it removed many of the overlaying molecules at the top of the image. This permits us to see both ethanol layers and to figure out the position of the rutile rows. We see that, even for multilayers the ethanol species adsorbed above the Ti4+ sites forming rows of molecules in the [001] direction. For the layer in contact with the rutile (the first layer), we expect to find molecularly and dissociated ethanol species coexisting, (as indicated in previous experiments10,11,13,16), whereas, in the multilayers, we expect the ethanol to be basically adsorbed in its molecular form.
image file: c3ra47369d-f3.tif
Fig. 3 STM images of rutile TiO2(110) after ethanol deposition via pulse injection. Molecular and dissociated ethanol are expected to adsorb on the surface. (a) After deposition, adsorbates formed rows parallel to the rutile [001] direction. Sample bias: +2 V, and tunneling current: 50 pA. Image size: 30 × 30 nm2. (b) In another region of the surface, after the surface in the upper part of the image was unintentionally modified, this reveals that two ethanol layers adsorbed above Ti sites. ”1L eth”, and ”2L eth” respectively refer to the first layer ethanol, and the second layer ethanol. Sample bias: +1 V, and tunneling current: 50 pA. Image size: 25 × 25 nm2.

The adsorption of ethanol is governed by a combination of molecule-substrate and molecule–molecule interactions. In the case of defective rutile surfaces at low coverages, it has been proposed that the dissociation of ethanol molecules takes place at Ov. The ethanol loses an H adatom on a neighbor Obr atom, and the oxygen of the ethoxy group fills the Ov.11,13 The reaction can be written as:

 
CH3CH2OH + Ov + Obr → CH3CH2Obr + Obr − Had (1)

In the case of a defect-free surface, on the other hand, the dissociated ethanol molecules bind on the Ti sites, while the H adatoms move to a neighbor Obr.11,16 The reaction then reads:

 
CH3CH2OH + Obr → CH3CH2OTi + Obr − Had (2)

On both surfaces, non-dissociated molecular ethanol adsorbs on the Ti sites. Since in our images all ethanol species were adsorbed on the titanium rows, our results are better explained by adsorption on a defect-free surface. The interaction with the Ti4+ is expected to be dominant in the closest layer to the surface, whereas this should be much weaker in higher layers. Ethanol molecules interact via H-bonding with other ethanol molecules. The low-temperature structure of ethanol is characterized by infinite hydrogen-bonded molecular chains in which the molecules are arranged in an alternating sequence.31 An ice structure probably formed, and therefore, the molecules aligned in rows. Water at submonolayer coverage exhibits a similar behavior, supporting the idea of H-bonding between molecules.29 Considering that only molecular ethanol were likely to be adsorbed in the upper layers, we can ascribe the features with the dark contrast in the multilayer surface to molecular vacancies in the ethanol layers.

Scans of the surface at >+2.5 V induced desorption of the molecules. Fig. 4 displays a sequence of STM images of the same area, acquired after scanning a 20 × 20 nm2 square in the center several times at a high sample bias. In Fig. 4(a), we can see the ethanol covered surface after the deposition. Fig. 4(b) and (c) show the area after scans at ≥+3 V and ≥+4 V, respectively, where the desorption of the adsorbates is evident. In Fig. 4(c), the clean (1 × 1) rutile surface and even a (1 × 2) reconstructed string are visible in the high-bias scanned region.


image file: c3ra47369d-f4.tif
Fig. 4 Sequence of STM images of the ethanol/rutile (110) surface scanned with high sample biases. (a) After ethanol deposition. (b & c) After the central region of 20 × 20 nm2 was scanned several times with sample biases of (b) ≥+3 V and (c) ≥+4 V. All images were recorded with a sample bias of +2 V, and a tunneling current of 20 pA. Images size: 30 × 30 nm2.

Fig. 5(a) compares the line profiles of the surface indicated in Fig. 4 in order to estimate the thickness of the adsorbed multilayer ethanol and the amount removed by the scans. Taking into account that the step height on TiO2(110) is 0.32 nm,1 we estimate that only a sublayer of >0.15 nm of adsorbates was removed after scanning at ≥+3 V. After the surface was scanned at +4 V, (Fig. 4(c)), almost all of the ethanol disappeared and only a few species remained on the rutile surface. After the deposition, ethanol with a thickness of ≥0.3 nm covered the titania, this corresponds to at least two molecular layers of ≥0.15 nm. Most of the ethanol species that remained on the surface after the high-voltage scans were adsorbed on the Ti rows. Fig. 5(b) shows a magnified part of the region scanned at high bias in Fig. 4(c). There were mainly two kinds of adsorbate on the rutile after the scans at ≥+4 V. The first, more common type, had an apparent height of 0.15 nm and adsorbed on the Ti+4 atoms; the second type had a height of ∼0.21 nm and was attached to the bridging oxygen (see the profiles in Fig. 5(c)).


image file: c3ra47369d-f5.tif
Fig. 5 (a) Line profiles along the dashed lines in Fig. 4(a)–(c). A ≥0.3 nm thick layer of ethanol, which corresponds to two molecular layers, was removed by the high-voltage scans. (b) Magnified image of part of Fig. 4(c) scanned at high sample biases. Mainly two different kinds of adsorbate remained after the high-voltage scans: the smaller ones (the majority), adsorbed on the Ti4+ atoms, whereas the larger ones were attached to the bridging oxygens. We ascribed both types to ethoxy groups. Image size: 10 × 10 nm2. (c) Line profiles along the lines in (b).

The analysis of the adsorption behavior of ethanol on rutile shows that at least two layers of ethanol adsorbed on the Ti rows on the cold TiO2(110) surface. Molecular ethanol made up the upper layer, whereas both dissociated and molecular ethanol constituted the layer in contact with the rutile surface. The upper ethanol layer was probably connected to the layer in contact with the rutile surface through hydrogen bonds. In the layer in contact with the rutile surface, molecular ethanol was attached to the rutile via H-bonding,16 whereas the dissociated ethoxy groups formed stronger σ-bonds.13,16 The topology of the sample was significantly affected by scanning with a high sample bias. The injection of high-energy electrons caused the ethanol species to desorb. Some molecules of the ethanol layer desorbed at V ≥ +3 V. In contrast, at ≥+4 V, the energy of the electrons was high enough to break all of the H-bonds between the two layers of ethanol, the H-bonds of molecular ethanol and the surface, and even the majority of the covalent bonds between the ethoxy groups and the Ti4+ atoms. Thus, we can ascribe the remaining adsorbates to dissociated ethanol. Similar features have been reported by Hansen et al. They deposited ethanol on TiO2(110) below 150 K,13 and found three different adsorbates: molecular ethanol on Ti sites that were ∼0.26 nm in height; ethoxy on Ti sites (∼0.19 nm); and ethoxy on bridging oxygen sites (∼0.20) nm.13 These results support our conclusion that the high-voltage scans in our experiment caused all the molecular ethanol to desorb and only a few ethoxy groups to remain attached on the surface at either the Ti or the Obr sites.

We further investigated the interaction of the ethanol with the rutile surface by annealing the sample to room temperature (RT). During the ethanol deposition, the rutile substrate was moved from the cryostat for a short time (<15 min). Previous TPD experiments,11–13,15 indicate that the second layer and multilayers of ethanol on rutile desorb above 200 K. Since our surface was covered with at least two molecular layers of ethanol, the substrate was kept below 200 K during the ethanol deposition, and while it was outside the cryostat. The substrate was then warmed to RT in another chamber for two hours, during which time we monitored the mass spectra to check the species desorbing from the surface. The measurements revealed that mainly molecular ethanol detached from the substrate (peak at m/z = 31), although signals from other gases were also detected (H2O, CO2 and CO). Although some of these signals may have arisen from residual gases stuck to the sample holder in the UHV system, desorption of water seemed to be a concomitant effect with that of ethanol, as we will discuss later. It is worth noting that previous TPD measurements on deposited ethanol on TiO2(110) revealed that only ethanol molecules (no ethoxy groups) desorbed from the surface below 300 K.11–13 Upon heating, the dissociated ethoxy groups recombine with H adatoms and desorb as ethanol, reversing reactions (1) and (2).

After the rutile substrate was annealed to RT, it was transferred back to the STM and analyzed. Fig. 6 shows that the TiO2 surface was still covered with ethanol, although its coverage was reduced to less than one monolayer. The remaining species exhibited homogeneous size and image contrast, indicating that only one kind of ethanol species, most likely ethoxy groups, remained on the surface. Moreover, the fact that the Ti rows of the rutile surface were observed in regions uncovered by the adsorbates allowed us to identify the adsorption site. The preferred adsorption site of the ethoxy groups again corresponded to the Ti rows; i.e., the adsorption site did not change as a result of the annealing, and approximately 85% of the ethoxy groups were still found on the Ti4+ sites. The apparent height of this layer was ∼0.15 nm, similar to that of an ethoxy group measured in the non-annealed sample. Some species appeared to be adsorbed on top of other molecules and thus displayed double height. As in the case of the electron-induced process, the molecular ethanol was completely desorbed by annealing. This result corresponds with reported TPD experiments in which molecular ethanol desorbed between 180–250 K,11 and only dissociated ethanol was found on the rutile surface after the exposure was carried out at 300 K.10,12 In the ethoxy-free regions, there were small protrusions on the Obr rows that may correspond to H adatoms resulting from the ethanol dissociation (some are marked with white arrows in Fig. 6). H adatoms are difficult to image, in particular, when they are in close proximity to more protruding species such as ethoxy groups.9,13


image file: c3ra47369d-f6.tif
Fig. 6 STM image of rutile (110) covered with ethanol after it was annealed to RT. Multilayers desorbed, and only one kind of ethanol species, most likely ethoxy groups remained on the Ti sites. White arrows possibly indicate H adatoms split from ethanol. Sample bias: +2,V and tunneling current: 20 pA. Image size: 30 × 30 nm2.

Scans at a high sample bias on the annealed surface resulted in a similar behavior to that of the non-annealed case, (Fig. 7). The scans at ≥+3 V removed only a few of the species adsorbed on top of the molecules. They also affected the position of some ethoxys by shifting them inside the Ti rows by two or three atomic positions (compare Fig. 7(a) and (b)). On the other hand, scans at ≥+4 V “cleaned” the surface of adsorbates (Fig. 7(c)). Moreover, instead of one, four kinds of species are apparent in Fig. 7(c) and 8(a). The two types of adsorbate on Ti sites showed heights of ∼0.15 nm and ∼0.28 nm, and the other two types on the bridging oxygen rows showed heights of ∼0.21 nm and ∼0.32 nm. The preferred adsorption site changed from Ti to Obr, this led to approximately 60% of the adsorbates being on the bridging rows.


image file: c3ra47369d-f7.tif
Fig. 7 Sequence of STM images of the ethanol/rutile (110) surface after it was annealed to RT and after it was scanned several times at high sample bias. (a) The annealed surface was covered by ethoxy groups and H adatoms. Sample bias: +2 V. (b) Scanning at +3 V caused only a few ethoxy groups to become mobile. Sample bias: +3 V. (c) Scanning at ≥+4 V, however, caused almost all of the adsorbates to desorb, as in the case of the non-annealed sample. Sample bias +1 V. All images were recorded with a tunneling current of 20 pA. Images size: 30 × 30 nm2.

image file: c3ra47369d-f8.tif
Fig. 8 (a) Magnified image of part of Fig. 7(c). Four different kinds of adsorbates remained on the rutile surface after the high-voltage scans. There were small and large protrusions on the Ti sites and Obr sites. We can ascribe the small adsorbates to ethoxy groups, but cannot identify the larger ones. One Ov is indicated with a circle. Image size: 10 × 10 nm2. (b) Line profiles for the four types of adsorbate found in (a).

To summarize the above results, after annealing the sample to room temperature, only ethoxy groups remained on the surface and the majority were still bound to the Ti4+ sites. The scans at ≥+3 V had only a small influence on such groups. It seems that the electrons energy was not high enough to remove the strongly bonded ethoxy species, and was only able to shifting them a little bit. In contrast, the scans at ≥+4 V left only a few adsorbates on the surface, these could be classified into four kinds. A comparison of these results with those of the non-annealed sample led us to ascribe the smaller adsorbates on the Ti and Obr sites to ethoxy groups. The larger adsorbates represented only 10% of the remaining molecules; we could not conclusively identify them. They could be recombined or decomposed ethanol,11,12 but further work will be required to determine what they are with more certainty.

The change in the preferred adsorption site from Ti to Obr rows has been previously reported in TPD and STM studies.11–13 Ethoxy groups have high affinity to Ov where the bond has been experimentally determined to be much stronger than the one on Ti4+.11–13 On defective rutile surfaces, the density of ethoxy groups on Obr sites increases with increasing annealing temperature.13 On stoichiometric surfaces, initially without Ov, this behavior is slightly different. Gamble et al. explained that the recombination of ethoxy groups with H adatoms that go on to desorb as ethanol gas competes with the reaction of H adatoms and hydroxyl groups that form water.6,11 They found that for every two non-desorbed ethoxy groups, one water molecule desorbs. The OH is taken from the surface (a hydroxylated Obr), leaving an Ov. This results in there being an insufficient number of H adatoms for removing all ethoxys adsorbed on the Ti by heating, and the residual groups migrate to fill the Ov, resulting in a change of the adsorption site.11 A similar scenario is expected to take place with the high-voltage scans. This explains the change in the adsorption site of the ethoxy groups and the appearance of oxygen vacancies on the surface (e.g. see the circle in Fig. 8(a)). The number of H adatoms on the surface was also decreased by the desorption induced by the high-voltage scans.9,20,26–28

We have shown that the high-voltage scans induce both surface reactions on the defective surface (Fig. 1), and desorption of molecules on the defect-free rutile (Fig. 2, 4 and 7). Possible mechanisms of electron-induced desorption of adsorbates are weakening of the bonds by the applied electric field,26 desorption by electron attachment,20 and desorption by local heating induced by inelastic scattering of electrons injected from the tip.28 Throughout our experiments, the effects of the high-voltage scans appeared to be similar to those of heating the sample to higher temperatures, i.e., desorption of molecular ethanol and the shift of adsorption site. Molecules only desorb from the scanned area, so it is unlikely that the desorption is caused by the electric field of the tip. Furthermore, the LUMOs of undissociated and dissociated ethanol are located at 3.3 and 2.9 eV, respectively, above the conduction band minimum of the rutile.16 If electron attachment is responsible for desorption, ethoxy groups should desorb when the sample bias matches the LUMO of ethanol, and the desorption rate should be proportional to the number of injected electrons. However, desorption of ethoxy groups requires much higher energies. Therefore, local heating by inelastic electron scattering is the most likely mechanism of ethanol desorption by STM.

4 Conclusions

We used STM at 78 K to investigate the adsorption of ethanol multilayers on the almost stoichiometric TiO2(110) surface. The ethanol was deposited through a pulse valve on the cold rutile substrate. We found that the molecules adsorbed above the Ti4+ rows parallel to the [001] direction, even in the case of multilayer adsorption. These results indicate that there is strong interaction between the ethanol and the rutile surface through covalent bonds, and an interlayer interaction of ethanol molecules through hydrogen bonds. Annealing the sample to RT reduced the amount of ethanol to submonolayer coverage. Apparently, only ethoxy groups remained attached to the Ti4+ atoms, showing that they had the strongest bonds.

Our experiments show that the injection of high-energy electrons promoted the desorption of adsorbates from the surface in the case of the stoichiometric rutile surface, whereas on the reduced surface, chemical reactions of the rutile surface with residual gases or the adsorbates occurred mediated by the oxygen vacancies, i.e., change in the preferred adsorption site. These results prove that the Ov plays an important role in the surface chemistry of rutile TiO2(110).

Acknowledgements

We thank N. Ishida for his advice regarding the TiO2(110) preparation, and M. Marz and G. Angulo for critically reading the manuscript. This work was financially supported by the Core Research for Evolutional Science and Technology (CREST) of the Japan Science and Technology Agency (JST).

References

  1. U. Diebold, Surf. Sci. Rep., 2003, 48, 53 CrossRef CAS.
  2. Z. Dohnálek, I. Lyubinetsky and R. Rousseau, Prog. Surf. Sci., 2010, 85, 161 CrossRef PubMed.
  3. A. G. Thomas and K. L. Syres, Chem. Soc. Rev., 2012, 41, 4207 RSC.
  4. 1–3 and references therein.
  5. M. A. Henderson, Surf. Sci. Rep., 2011, 66, 185 CrossRef CAS PubMed.
  6. H. Idriss and E. G. Seebauer, J. Mol. Catal. A: Chem., 2000, 152, 201 CrossRef CAS.
  7. C. L. Pang, R. Lindsayb and G. Thornton, Chem. Soc. Rev., 2008, 37, 2328 RSC.
  8. C. Y. Zhou, Z. F. Ren, S. J. Tan, Z. B. Ma, X. C. Mao, D. X. Dai, H. J. Fan, X. M. Yang, J. LaRue, R. Cooper, A. M. Wodtke, Z. Wang, Z. Y. Li, B. Wang, J. L. Yang and J. G. Hou, Chem. Sci., 2010, 1, 575 RSC.
  9. Z. Zhang, O. Bondarchuk, J. M. White, B. D. Kay and Z. Dohnálek, J. Am. Chem. Soc., 2006, 128, 4198 CrossRef CAS PubMed.
  10. K. S. Kim and M. A. Barteau, J. Mol. Catal., 1990, 63, 103 CrossRef CAS.
  11. L. Gamble, L. S. Jung and C. T. Campbell, Surf. Sci., 1996, 348, 1 CrossRef CAS.
  12. E. Farfan-Arribas and R. J. Madix, J. Phys. Chem. B, 2002, 106, 10680 CrossRef CAS.
  13. J. Ø. Hansen, P. Huo, U. Martinez, E. Lira, Y. Y. Wei, R. Streber, E. Lægsgaard, B. Hammer, S. Wendt and F. Besenbacher, Phys. Rev. Lett., 2011, 107, 136102 CrossRef CAS.
  14. P. Huo, J. Ø. Hansen, U. Martinez, E. Lira, R. Streber, Y. Y. Wei, E. Lægsgaard, B. Hammer, S. Wendt and F. Besenbacher, J. Phys. Chem. Lett., 2012, 3, 283 CrossRef CAS.
  15. Z. Ma, Q. Guo, X. Mao, Z. Ren, X. Wang, C. Xu, W. Yang, D. Dai, C. Zhou, H. Fan and X. Yang, J. Phys. Chem. C, 2013, 117, 10336 CAS.
  16. J. N. Muir, Y. Choib and H. Idriss, Phys. Chem. Chem. Phys., 2012, 14, 11910 RSC.
  17. H. Tanaka and T. Kawai, J. Vac. Sci. Technol., B: Microelectron. Nanometer Struct., 1997, 15, 602 CrossRef CAS.
  18. C. Pérez León, C. Sürgers, M. Marz, R. Hoffmann, M. Mayor and H. V. Löhneysen, J. Phys. Chem. C, 2009, 113, 14335 Search PubMed.
  19. C. Pérez León, C. Sürgers and H. V. Löhneysen, Phys. Rev. B: Condens. Matter Mater. Phys., 2012, 85, 035434 CrossRef.
  20. S. J. Tan, Y. Zhao, J. Zhao, Z. Wang, C. X. Ma, A. D. Zhao, B. Wang, Y. Luo, J. L. Yang and J. G. Hou, Phys. Rev. B: Condens. Matter Mater. Phys., 2011, 84, 1554181 Search PubMed.
  21. P. Scheiber, A. Riss, M. Schmid, P. Varga and U. Diebold, Phys. Rev. Lett., 2010, 105, 216101 CrossRef.
  22. Z.-T. Wang, Y. Du, Z. Dohnálek and I. Lyubinetsky, J. Phys. Chem. Lett., 2010, 1, 3524 CrossRef CAS.
  23. Y. Zhao, Z. Wang, X. F. Cui, T. Huang, B. Wang, Y. Luo, J. L. Yang and J. G. Hou, J. Am. Chem. Soc., 2009, 131, 47958 Search PubMed.
  24. J. Matthiesen, J. O. Hansen, S. Wendt, E. Lira, R. Schaub, E. Lægsgaard, F. Besenbacher and B. Hammer, Phys. Rev. Lett., 2009, 102, 226101 CrossRef CAS.
  25. X. Cui, Z. Wang, S. Tan, B. Wang, J. Yang and J. G. Hou, J. Phys. Chem. C, 2009, 113, 13204 CAS.
  26. S. Suzuki, K.-I. Fukui, H. Onishi and Y. Iwasawa, Phys. Rev. Lett., 2000, 84, 2156 CrossRef CAS.
  27. O. Bikondoa, C. L. Pang, R. Ithnin, C. A. Muryn, H. Onishi and G. Thornton, Nat. Mater., 2006, 5, 189 CrossRef CAS.
  28. D. P. Acharya, C. V. Ciobanu, N. Camillone and P. Sutter, J. Phys. Chem. C, 2010, 114, 21510 CAS.
  29. I. M. Brookes, C. A. Muryn and G. Thornton, Phys. Rev. Lett., 2001, 87, 266103 CrossRef CAS.
  30. S. J. Tan, Y. Ji, Y. Zhao, A. D. Zhao, B. Wang, J. L. Yang and J. G. Hou, J. Am. Chem. Soc., 2011, 133, 2002 CrossRef CAS PubMed.
  31. P.-G. Jönsson, Acta Crystallogr., Sect. A: Cryst. Phys., Diffr., Theor. Gen. Crystallogr., 1976, 32, 232 CrossRef.

Footnote

Present address: Karlsruhe Institute of Technology, Physikalisches Institut and DFG-Center for Functional Nanostructures, Wolfgang-Gaede-Str. 1, 76131 Karlsruhe, Germany.

This journal is © The Royal Society of Chemistry 2014
Click here to see how this site uses Cookies. View our privacy policy here.