DOI:
10.1039/C3RA47223J
(Paper)
RSC Adv., 2014,
4, 7288-7295
Structure, luminescence property and energy transfer behavior of color-adjustable La5Si2BO13:Ce3+,Mn2+ phosphors
Received
2nd December 2013
, Accepted 6th January 2014
First published on 7th January 2014
Abstract
A series of color-adjustable phosphors La5Si2BO13(LSBO):Ce3+,Mn2+ were synthesized through a high temperature solid-state method. The crystal structures of Ce3+ and Mn2+ doped La5Si2BO13 phosphors were refined by the Rietveld method, which were proved to be the apatite-type hexagonal phase (space group of P63/m). It was found that two different La3+ sites in the La5Si2BO13 phase were occupied evenly by Ce3+ and Mn2+ ions, and then the formed vacancy contributed to the charge compensation. La5Si2BO13:Ce3+,Mn2+ phosphors exhibited a broad excitation band ranging from 250 to 375 nm and two broad emission bands centred at 418 nm and 585 nm upon 345 nm excitation. It is found that the emission colors could be tuned from blue-violet (0.1629, 0.0523) to pink (0.3227, 0.1830) by changing the ratio of Ce3+/Mn2+. Moreover, the energy transfer mechanism was verified to be the dipole–dipole interaction, and the critical distance was calculated to be 10.02 Å by using the concentration quenching method.
1. Introduction
It is believed that the white light-emitting diodes (wLEDs) will become the fourth generation solid-state light sources, due to their low energy consumption, high brightness, as well as long service lifetime and environmentally friendly properties.1,2 Currently, the commercially available wLEDs generally can be employed by the combination of a blue InGaN LED chip and the yellow-emitting phosphor (Y1−aGda)3(Al1−bGab)5O12:Ce3+) based on the phosphor-converted emission mechanism.3 However, this kind of wLEDs faces a low color rendering index (CRI) and a high correlated color temperature due to the lack of sufficient red emission which induces the poor white color quality.4,5 Accordingly, an alternative approach on fabricating wLEDs is realized by means of near-ultraviolet (n-UV) chip LED assigned with the mixture of tricolor (blue, green and red) phosphors. Consequently, it is necessary for the development of a tricolor emission phosphor upon n-UV light in the field of phosphor materials.6
It is well known that apatite compounds have been widely used in solid-state lighting and display industry because of their stable and adjustable structure for optical materials.7 Apatite structure belongs to the hexagonal phase (space group of P63/m) with a general chemical formula as A10[PO4]6Z2, where A often represents divalent cations such as Ca2+, Mg2+, Ba2+, Fe2+, Sr2+, Mn2+, Pb2+; Z is denoted by F, Cl, Br, OH or O. For this compound, the rare earth ions or alkali metal ions like Na+, K+, and Ag+ can also occupy the A-site owing to the isomorphic replacement effect. Meanwhile, [PO4]3− ions can also be substituted by [SiO4]4−, [CO3]2−, [BO3]3−, [VO4]3− anion groups under different conditions and Z is mainly composed by the F−, OH−, Cl− ions. For the A10[PO4]6Z2 compound, there are two kinds of cationic crystallographic sites labeled A(I) and A(II) with the local symmetry C3 and Cs, respectively. Therefore, the study on the apatite compound is of significance and valuable, as they possess the capability of substituting by versatile ions and forming solid solution. The luminescence properties of Mn2+ doped apatite compounds have been widely investigated, such as Ca3Gd7(PO4)(SiO4)5O2:Mn2+,8 Mg2Y8(SiO4)6O2:Mn2+.9 Mn2+ ion generally shows red emission ascribed to the 4T1(4G) → 6A1(6S) transition and it has a broad-band emission peaked at 585 nm in the present La5Si2BO13(LSBO) system. However, the emission efficiency of Mn2+ is usually poor because of the spin-forbidden 4T1(4G) → 6A1(6S) transition, which is difficult to be pumped in many matrix. Accordingly, Ce3+ and Eu2+ ions with allowed 5d–4f transitions are used to promote the excitation and improve the emission intensity of Mn2+ via the energy transfer behavior between Ce3+(Eu2+) and Mn2+ ions.10
Ce3+ and Mn2+ ions possess f–d and d–d electron configuration, respectively, and they act as good candidates as activators in phosphor because they can emit broadband visible light. The energy transfer between Ce3+ and Mn2+ ions has been realized in many systems. For instance, Ca3Sc2Si3O12:Ce3+,Mn2+,11 Ba2Li2Si2O7:Ce3+,Mn2+,12 Ca2Gd8(SiO4)6O2:Ce3+,Mn2+,13 Ca3Y(GaO)3(BO3)4:Ce3+,Mn2+,14 and so on. However, to the best of our knowledge, the luminescence properties and energy transfer of Ce3+/Mn2+ in LSBO host have not been reported.
As for the crystal structure of La5Si2BO13, both Si and B are located on the tetrahedral site as a member of [SiO4]4− and [BO4]5−. Furthermore, the O(4) ion (free oxide ion in the crystal structure of La5Si2BO13) lies on the 6-fold axis generally named X site which does not belong to any tetrahedral and only coordinates to three cations in the 6h sites. The free oxide ion (O(4)) is situated in the plane of the triangle formed by three cations. Based on an appropriate choice of anions and cations, several isostructural compounds can be synthesized. In the present work, phase structure of the apatite compound, La5Si2BO13, has been investigated, and luminescence properties of Ce3+, Mn2+ singly doped and Ce3+–Mn2+ codoped La5Si2BO13 were discussed in detail.
2. Experimental procedures
Ce3+ or Mn2+ singly doped samples LSBO:Ce3+, LSBO:Mn2+, and Ce3+ and Mn2+co-doped LSBO:Ce3+,Mn2+ phosphors were all synthesized by the traditional high temperature solid-state technique. It is proposed that the charge compensation can be achieved by the formed vacancy in the formula of La5−(2x/3)MnxSi2BO13 when Mn2+ ion substitutes for La3+ sites in the present LSBO matrix, which is also verified by the following Rietveld refinement results. Therefore, the formula in the form of La5Si2BO13:Ce3+,Mn2+ (LSBO:Ce3+,Mn2+) was still as written hereafter. The raw materials used for the prepared phosphors were SiO2 (A.R.), B2O3 (A.R.) (added excessive B2O3 (10%) as flux), MnCO3 (A.R.), La2O3 (99.99%), and CeO2 (99.99%). Stoichiometric amounts of reactants were thoroughly mixed by grinding in an agate mortar, then the final mixture was placed into an alumina crucible and annealed at 1450 °C in a reducing (5% H2 + 95% N2) atmosphere for 5 h. After that, the samples were furnace-cooled to room temperature, and ground again into powders for measurement.
The crystal structure of as-prepared samples were checked by the X-ray powder diffractometer (XD-3, PGENERAL, China) using Cu Kα radiation (λ = 0.15405 nm) operated at 40 kV and 30 mA. The continuous scanning rate (2θ ranging from 10° to 70°) used as phase formation determination was 8° (2θ) min−1. The step scanning rate (2θ ranging from 5° to 100°) used as structural analysis was 2.35 s per step with a step size of 0.02. Powder diffraction data were calculated by the Rietveld method using the computer software TOPAS package.15 Photoluminescence (PL) spectra were carried out by a fluorescence spectrophotometer (F-4600, HITACHI, Japan) equipped with a photomultiplier tube operating at 400 V, and a 150 W Xe lamp was used as the excitation lamp. A 400 nm cutoff filter was used in the measurement to eliminate the second-order emission of source radiation. The lifetimes were recorded on a spectro-fluorometer (HORIBA, JOBIN YVON FL3-21), and the 370 nm pulse laser radiation (nano-LED) was used as the excitation source. The temperature-dependence luminescence properties were measured on the same spectrophotometer, which was combined with a self-made heating attachment and a computer-controlled electric furnace. The internal quantum efficiency was measured using the integrated sphere on the FLS920 fluorescence spectrophotometer (Edinburgh Instruments Ltd, UK), and a Xe900 lamp was used as an excitation source and white BaSO4 powder as a reference to measure the absorption. All the measurements were performed at room temperature.
3. Results and discussion
The phase structures of the as-prepared samples were characterized by XRD measurements. Fig. 1 presents the XRD patterns of as-prepared LSBO powder without doping any rare earth ions (a), LSBO:0.05Ce3+ (b), LSBO:0.1Mn2+ (c), and LSBO:0.05Ce3+,0.1Mn2+ (d), respectively. It is found that all the positions and relative intensity are in good agreement with the Joint Committee on Powder Diffraction Standards card data (JCPDS card no. 69-0599 of La5Si2BO13), and no second phase can be detected, which confirmed the formation of apatite structure.
 |
| Fig. 1 XRD patterns of (a) LSBO compound, (b) LSBO:0.05Ce3+, (c) LSBO:0.1Mn2+, (d) LSBO:0.05Ce3+,0.1Mn2+. The standard data for La5Si2BO13 (JCPDS card no. 69-0599) is shown as a reference. | |
In order to further understand the crystal structure of the synthesized phosphor, especially the sites occupied by the doped rare earth ions in the apatite compound La5Si2BO13, the Rietveld structural refinements for La4.95Ce0.05Si2BO13 and La4.85Ce0.05Mn0.15Si2BO13 compounds were performed based on the Topas3 program. The structural parameters of La5Si2BO13 were used as initial parameters in the Rietveld analysis. The observed, calculated, and difference results for the Rietveld refinement XRD patterns are shown in Fig. 2a and b. Moreover, the final refined residual factors and refined structural parameters are summarized in Tables 1 and 2. Fig. 2a gives the results of the refinement of the La4.95Ce0.05Si2BO13 compound, and all of the observed peaks satisfy the reflection condition and converge to Rexp = 6.80%, Rwp = 8.19%, Rp = 6.13% GOF = 1.20. Since Mn2+ ion also replaced for La3+ sites as that of Ce3+ in the structure of La5Si2BO13, the lattice parameters of La4.85Ce0.05Mn0.15Si2BO13 have a tend to be smaller and the refined factors converged to Rexp = 7.05%, Rwp = 12.92%, Rp = 9.44% GOF = 1.83, as shown in Fig. 2b. It is found that the La5Si2BO13 compound is isostructural with the fluorapatite (Ca10(PO4)6F2), which crystallizes in a hexagonal with space group P63/m and the detailed crystal structure diagram of La5Si2BO13 compound is given in Fig. 3a, which consists of two cationic sites which can be easily accommodated by all kinds of rare-earth ions. The refinements confirmed the as-prepared samples are related to the apatite-type La5Si2BO13. The a-axis and c-axis, as well as the volume of the unit cell decreases as doping the Mn2+ ions in LSBO:Ce3+,Mn2+, indicating that Mn2+ ions have been effectively introduced into the host lattice. As is also shown in Fig. 3b, one cationic site is labeled as La(I) which is the 9-fold coordinated 4f sites with C3 point symmetry and the other is labeled as La(II) which is the 7-fold coordinated 6h sites with Cs point symmetry, of which, the molar ratio of La(I) and La(II) is 2
:
3. It demonstrates that the two different types of sites can be occupied for guest cations with different charges availably.10,16
 |
| Fig. 2 Rietveld refinement XRD patterns of (a) La4.95Ce0.05Si2BO13 and (b) La4.85Ce0.05Mn0.15Si2BO13 at room temperature by TOPAS program. Solid red lines are calculated intensities, and circles are the observed intensities. Short vertical lines show the position of Bragg reflections of the calculated pattern. Blue solid lines below the profiles stand for the difference between the observed and the calculated intensities. | |
Table 1 Crystallographic data for La4.95Ce0.05Si2BO13 as determined from Rietveld refinement
Formula |
La4.95Ce0.05Si2BO13 |
Space group |
P63/m, hexagonal |
Cell parameters |
a = b = 9.54946(37) Å, c = 7.21264(12) Å, α = 90°, β = 90°, γ = 120°, V = 569.691(58) Å, Z = 2 |
Reliability factors |
Rexp = 6.80%, Rwp = 8.19%, Rp = 6.13%, GOF = 1.20 |
Atom |
Wyck. |
x |
y |
z |
Occ |
La1 |
4f |
0.33333 |
0.66667 |
0.9963(20) |
0.99 |
La2 |
6h |
0.231(21) |
0.985(23) |
0.25000 |
0.99 |
Ce1 |
4f |
0.33333 |
0.66667 |
0.9963(20) |
0.01 |
Ce2 |
6h |
0.231(21) |
0.985(23) |
0.25000 |
0.01 |
Si1 |
6h |
0.403(51) |
0.373(53) |
0.25000 |
0.667 |
B1 |
6h |
0.403(51) |
0.373(53) |
0.25000 |
0.333 |
O1 |
6h |
0.360(14) |
0.463(11) |
0.25000 |
0.861(18) |
O2 |
6h |
0.590(91) |
0.467(68) |
0.25000 |
0.838(81) |
O3 |
12i |
0.346(41) |
0.258(40) |
0.0829(54) |
0.953(47) |
O4 |
2a |
0.00000 |
0.00000 |
0.25000 |
1.348(81) |
Table 2 Crystallographic data for La4.85Ce0.05Mn0.15Si2BO13 as determined from Rietveld refinement
Formula |
La4.85Ce0.05Mn0.15Si2BO13 |
Space group |
P63/m, hexagonal |
Cell parameters |
a = b = 9.51339(31) Å, c = 7.20365(26) Å, α = 90°, β = 90°, γ = 120°, V = 564.617(60) Å, Z = 2 |
Reliability factors |
Rexp = 7.05%, Rwp = 12.92%, Rp = 9.44%, GOF = 1.83 |
Atom |
Wyck. |
x |
y |
z |
Occ |
La1 |
4f |
0.33333 |
0.66667 |
0.9935(42) |
0.96 |
La2 |
6h |
0.233(16) |
0.985(23) |
0.25000 |
0.96 |
Ce1 |
4f |
0.33333 |
0.66667 |
0.9935(42) |
0.01 |
Ce2 |
6h |
0.233(16) |
0.985(23) |
0.25000 |
0.01 |
Mn1 |
4f |
0.33333 |
0.66667 |
0.9935(42) |
0.03 |
Mn2 |
6h |
0.233(16) |
0.985(23) |
0.25000 |
0.03 |
Si1 |
6h |
0.411(21) |
0.368(22) |
0.25000 |
0.667 |
B1 |
6h |
0.411(21) |
0.368(22) |
0.25000 |
0.333 |
O1 |
6h |
0.369(26) |
0.448(17) |
0.25000 |
0.926(15) |
O2 |
6h |
0.588(55) |
0.462(76) |
0.25000 |
0.911(49) |
O3 |
12i |
0.351(32) |
0.256(11) |
0.0837(46) |
0.995(36) |
O4 |
2a |
0.00000 |
0.00000 |
0.25000 |
1.017(49) |
 |
| Fig. 3 Crystal structure of La5Si2BO13 along the a-axis direction (a) and (b) shows the coordination environment of Ca(1) and Ca(2). | |
The PL spectra of La5−xSi2BO13:xCe3+ (x = 0.01, 0.03, 0.05, 0.10, 0.20) monitored by 345 nm are depicted in Fig. 4. It can be seen that the emission spectra consist of an asymmetric broad band centered at 418 nm which corresponds to the 5d–4f allowed transition of Ce3+. Additional, the inset of Fig. 4 shows the Ce3+ content dependent emission intensity at 418 nm. It can be easily seen that the emission intensities have an obvious increasing trend with increasing Ce3+ concentration, and maximizes at x = 0.05, then the emission intensity decreases, which could be ascribed to the internal concentration quenching effect.16,17
 |
| Fig. 4 PL spectra for LSBO:xCe3+ (x = 0.01–0.20) phosphors on Ce3+ doping content (x). | |
Fig. 5 presents the excitation and emission spectra of single-doped and co-doped La5Si2BO13 phosphors. The PLE and PL spectra of LSBO:0.05Ce3+ sample were shown in Fig. 5a. The PLE spectrum monitored by 345 nm exhibits two distinct excitation bands at 289 and 345 nm, which could be ascribed to the electronic transitions from the ground state to the different crystal field splitting bands of excited 5d states of Ce3+. Upon 345 nm excitation, the PL spectrum consists of an asymmetric broad emission band from 370 to 500 nm with a maximum at 418 nm which is assigned to the 5d–4f transitions of Ce3+. It is well-known that the typical emission of Ce3+ should consist of a double band in view of the transitions of Ce3+ ions from 5d state to the 2F5/2 and 2F7/2 ground states, and the theoretical energy difference of this splitting between 2F5/2 and 2F7/2 level is about 2000 cm−1. However, the asymmetric emission band can be resolved by a Gaussian fit into two emission bands (the dotted lines in Fig. 5a) with the peaks at 418 and 445 nm, the energy difference is about 1451 cm−1, which is far from 2000 cm−1. It means that these two emission bands cannot be ascribed to the ground state splitting of the single Ce3+ emission center, which is related to different sites occupied by Ce3+.18 As shown in Fig. 3b, there are two different sites (4f (C3) site and 6h (Cs)) for the cations Ce3+, which further induced the broad-band emission. Fig. 5b demonstrates the PLE and PL spectra of LSBO:0.10Mn2+. The excitation spectrum consists of several bands centering at 322 nm, 343 nm, 410 nm and 463 nm, corresponding to the transitions of Mn2+ ion from ground level 6A1(6S) to4E(4D), 4T2(4D), [4A1(4G), 4E(4G)], and 4T1(4G) levels, respectively. The broad emission band from 500 to 700 nm centered at 585 nm ascribed to the spin-forbidden 4T1(4G)–6A1(6S) transition of the Mn2+ ions. As seen in Fig. 5a and b, the significant spectral overlap occurs between the emission band of Ce3+ and the excitation band of Mn2+, which indicates the possible resonance type energy transfer from the Ce3+ to Mn2+ ions in La5Si2BO13 matrix. Moreover, it can be further confirmed by the PLE spectra in Fig. 5c. The PLE spectrum of LSBO:0.05Ce3+,0.1Mn2+ monitored at the emission of Ce3+ (418 nm) is in consistent with that monitored at the emission of Mn2+ (585 nm) except for the difference of the relative intensity. These results suggest that energy transfer take place from Ce3+ to Mn2+. Upon excitation at 345 nm, the PL spectrum of LSBO:0.05Ce3+,0.1Mn2+ phosphor appears not only as a blue-violet band of Ce3+ ions also as a pink band of the Mn2+ ions. Therefore, the luminescence color of LSBO:Ce,Mn can be adjusted from blue-violet to pink by tuning Mn2+-doped concentration in the single host via the energy transfer behavior.
 |
| Fig. 5 PLE (left) and PL (right) spectra of LSBO:xCe3+ (a), LSBO:0.1Mn2+ (b), and LSBO:0.05Ce3+,0.1Mn2+ (c) samples. The corresponding monitoring wavelengths are also given in the figure. | |
In order to further understand the energy process involved in LSBO:Ce3+,Mn2+, a series of LSBO:Ce3+,yMn2+ samples were synthesized. The content of Ce3+ was fixed at the optimum value x = 0.05 and the concentration of Mn2+ was varied in the range of 0–0.2. Fig. 6a shows the dependence of emission spectra for LSBO:Ce3+,yMn2+ (y = 0, 0.01, 0.03, 0.05, 0.08, 0.1, and 0.2). It can be found that the PL intensity of Ce3+ decreases monotonically with an increasing Mn2+ content which assigns to the energy transfer from Ce3+ ions to Mn2+ ions. Furthermore, the emission peak of Mn2+ appears red-shift from 585 nm to 600 nm as the content increases from 0.01 to 0.2, which could be ascribed the enhancement of the crystal field strength surrounding Mn2+ ions.19,20 A series of phosphors with fixed Mn2+ content are prepared to study the effect of Ce3+-doping concentration on the luminescence properties of phosphors. The PL spectra of the LSBO:xCe3+,0.10Mn2+ phosphors are depicted in Fig. 6b. Whereas the weaker absorption at 345 nm of Mn2+ single-doped phosphor, we hardly see the emission of Mn2+ ion. With increasing of the Ce3+ content and fixed the concentration of Mn2+, the emission intensity of Mn2+ dramatically increases to a maximum at x = 0.05, further confirming an efficient energy transfer from the Ce3+ to Mn2+ ions.21,22 As x varies from 0.01 to 0.12, then decreases with further increment of Ce3+ content.
 |
| Fig. 6 PL spectra of LSBO:Ce3+, Mn2+ phosphors with various (a) Mn2+ content and (b) Ce3+ content. The inset shows the energy transfer efficiency using integrated emission intensity. | |
The PL decay curves of LSBO:0.05Ce3+,yMn2+ excited at 370 nm and monitored the main emission of the Ce3+ ions at 418 nm were measure, and the lifetime as well as energy transfer efficiencies are shown in Fig. 6. It can be seen that the decay curves of the 5d–4f transition of LSBO:0.05Ce3+ shows a second-order exponential decay, which can be fitted by the equation:3,23
|
I(t) = I0 + A1 exp(−t/τ1) + A2 exp(−t/τ2)
| (1) |
where
I(
t) is the luminescence intensity at time
t,
A1 and
A2 are constants,
t is the time, and
τ1 and
τ2 are rapid and slow times for the exponential components, respectively. The average lifetime
τ* can be obtained by the formula as follows:
3,23 |
τ* = (A1τ12 + A2τ22)/(A1τ1 + A2τ2)
| (2) |
The decay time of LSBO:0.05Ce3+ sample without the Mn2+ was determined to be 31.72 ns for the 5d–4f transition. However, the Mn2+ was doped in the system of LSBO:0.05Ce3+, the decay of Ce3+ ions becomes faster and faster and significant deviate from second-exponential decay. So, the decay processes of these samples are characterized by average lifetime (τ), which was defined as following formula:1,24
|
 | (3) |
where
I(
t) stands for the intensity at time
t. Based on the
eqn (3), the average lifetimes value were calculated and shown in
Fig. 7. The decay time of the Ce
3+ ions was found to decrease as the Mn
2+ concentrations increases, which demonstrates that the energy transfer process occurs from sensitizer Ce
3+ to activator Mn
2+. Additional, the energy transfer efficiency (
ηT) from Ce
3+ to Mn
2+ in LSBO matrix can be determined using the calculation below:
25–28 |
 | (4) |
where
τS0 and
τS stand for the lifetimes of the sensitizer Ce
3+ in the absence and the presence of activator Mn
2+, respectively. The energy transfer efficiency was calculated as a function of Mn
2+ concentration and also shown in
Fig. 7. The energy transfer efficiency is found to increase with increasing Mn
2+ content. When the doped Mn
2+ concentration was fixed at 0.1 mol (
y = 0.1), the value of
ηT is estimated to be 70.27%. So, it indicated that the Mn
2+ emission intensity was enhanced
via energy transfer from sensitizer Ce
3+, instead of the energy absorption by Mn
2+ ions themselves.
 |
| Fig. 7 Decay curves and lifetime of Ce3+, and the energy transfer efficiency from Ce3+ to Mn2+ in LSBO:0.05Ce3+, yMn2+ (y = 0–0.10) phosphors at room temperature. | |
The resonant-type energy transfer process can be classified into exchange interaction and multipolar. It is well known that the critical distance between the sensitizer and activator should be shorter that 3–4 Å if energy transfer occurs owing to the exchange interaction.8,17,29 The critical distance of energy transfer Rc was obtained by using the concentration quenching method. The average separation Rc can be estimated according to the following equation suggested by Blasse.30,31
|
 | (5) |
Here V is the volume of the unit cell, xc is the critical concentration (the total concentration of Ce3+ and Mn2+), and N is the number of available sites for the dopant in the unit cell. In our host of LSBO, N equals to 10, and V is estimated to be 564.617 Å3, and the critical doping content xc at which the luminescence intensity of Ce3+ is half that of the sample in the absence of Mn2+ is 0.1080 mol. According the eqn (5), the critical distance was determined to be about 10.02 Å. It is little possibility of energy transfer through the exchange interaction mechanism with longer distance (more than 5 Å). Thus, the electric multipolar interaction will take place for energy transfer between Ce3+ to Mn2+. According to Dexter's energy transfer expressions of multipolar interaction and Reisfeld's approximation, the following relation can be obtained:32,33
where
η0 and
ηs are the luminescence quantum efficiencies of Ce
3+ with and without activator Mn
2+, respectively. In
(η0/ηs) can be estimated approximately by the logarithmic value of relative luminescence intensity ratio (In
(IS0/Is)). The value for
n = 6, 8, 10 corresponds to the electric dipole–dipole, dipole–quadrupole, and quadrupole–quadrupole interactions, respectively. The linear (black line) and polynomial (red line) fits to the relationship between
IS0/
IS and
Cn/3 based on the above equation are illustrated in
Fig. 8. It can be seen that the
R2 of the linear fit is less than that of the polynomial fit from
Fig. 8b and c, and for
Fig. 8a the
R2 value of liner and polynomial fits were almost equal which means that the relationship is the closest one to a linear behavior when
n = 6. Therefore, the energy transfer from Ce
3+ to Mn
2+ occurs through the dipole–dipole mechanism.
34
 |
| Fig. 8 Dependence of IS0/IS of Ce3+ on (a) C6/3, (b) C8/3, and (c) C10/3. | |
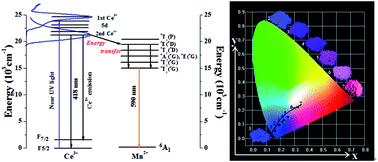
The corresponding energy levels scheme and energy transfer from Ce3+ to Mn2+ in a co-doped LSBO phosphor upon excitation with UV radiation is illustrated in Fig. 9. The Ce3+ ions act as sensitizer and the Mn2+ ions as activators. The energy transfer behavior between Ce3+ and Mn2+ ions can be ascribed to the similar value of energy level of excited 5d state of Ce3+ is close to the 4E(4D) levels of Mn2+ ions. When the Ce3+ ions are excited by the UV light, electron is pumped to 5d level, and then it relaxes to the lowest 5d crystal field splitting state. An energy transfer process takes place from 5D3/2 of Ce3+ to 4E(4D), which relaxes to 4T1(4G) levels later (labeled as ET in Fig. 9. Then the excited Mn2+ relaxes to the 4T1(4G) levels non-radioactively and gives the characteristic emission of Mn2+.10,35
 |
| Fig. 9 The schematic diagram of energy transfer in LSBO:Ce,Mn and the proposed luminescence energy transfer mechanism. | |
It is vital to have a good performance which has less variation in chromaticity and brightness in an application of lighting at high temperature.10,23 Temperature dependent emission spectra of LSBO:Ce3+,Mn2+ phosphor monitored by 345 nm is showed in Fig. 10. It can be seen that the sample has an obvious decreasing trend with increasing temperature, and the luminescence intensity dropped to 50% of the initial intensity when the temperature was raised up to 125 °C. Typically, the emission peaks of Ce3+ and Mn2+ shift to a lower energy as the temperature increases. However, the peak positions of the emission spectra are blue shifted with increasing temperature in our case, some similar results have been discussed.36,37 In order to better to understand temperature dependence of the luminescence, a modified Arrhenius equation was used to calculate the activation energy as following:38
|
 | (7) |
where
I0 and
IT are the initial PL intensity of the phosphor at room temperature and different temperatures, respectively.
k is Boltzmann constant (8.62 × 10
−5 eV),
c is a constant, and Δ
E is the activation energy for thermal quenching. The plots of ln[(
I0/
IT) − 1]
versus 1/
T for LSBO:0.05Ce
3+,0.1Mn
2+ is depicted in the inset of
Fig. 10. And the activation energy Δ
E can be obtained from the slop of the plot, as demonstrated in
eqn (7), Δ
E is calculated to be 0.2792 eV. It has a higher value than reported value in Ce
3+ doped other phosphors with apatite compounds.
38
 |
| Fig. 10 PL spectra of LSBO:0.05Ce3+, 0.1Mn2+ at different temperatures (T = 25–250 °C). | |
The variation of the Commission International de L'Eclairage (CIE) chromaticity coordinates of the LSBO:0.05Ce3+,yMn2+ phosphors with different doping contents of Mn2+ are calculated based on the corresponding PL spectrum upon 345 nm excitation are summarized in Fig. 11 and Table 3. Increasingly, the color tune can be modulated from blue-violet (0.1629, 0.0523) to pink (0.3227, 0.1830) with the increasing doping content of the Mn2+ ions, which is due to the variation of the emission intensity of Ce3+ and Mn2+ through the energy transfer from Ce3+ to Mn2+ ions. A series of digital photographs of the selected LSBO:0.05Ce3+,yMn2+ samples under a 365 nm UV lamp irradiation are shown in the inset of Fig. 11. Along the line between (0.1629, 0.0523) and (0.3227, 0.1830), the emission color is tunable in the visible region from blue to pink by controlling Mn2+ doped contents which indicates that the series of LSBO:0.05Ce3+,yMn2+ phosphors are promising candidates for color tunable luminescence material used for the n-UV pc-wLEDs. Furthermore, the luminescence quantum efficiency of the selected samples LSBO:0.05Ce3+ and LSBO:0.05Ce3+,0.15Mn2+ were measured and determined to be 29.4% and 24.1%, respectively. It is believed that the quantum efficiency can be further improved by the future controlling synthetic route.
 |
| Fig. 11 CIE chromaticity diagram for LSBO:0.05Ce3+, yMn2+ (y = 0–0.20) phosphors (point 1 to 7) excited at 345 nm. | |
Table 3 Comparison of the CIE chromaticity coordinates (x, y) for LSBO:0.05Ce3+, yMn2+ (y = 0–0.20) phosphors excited at 345 nm
Sample no. |
Sample composition (y) |
CIE coordinates (x, y) |
1 |
0 |
(0.1629, 0.0523) |
2 |
0.01 |
(0.1906, 0.0961) |
3 |
0.03 |
(0.2165, 0.1230) |
4 |
0.05 |
(0.2237, 0.1238) |
5 |
0.08 |
(0.2520, 0.1551) |
6 |
0.10 |
(0.2999, 0.1721) |
7 |
0.20 |
(0.3227, 0.1830) |
4. Conclusion
In summary, a series of color-adjustment LSBO:Ce3+,Mn2+ phosphors were prepared through a conventional solid-state reaction. The spectroscopic data and fluorescence decay dynamics indicate that the energy transfer process takes place from sensitizer Ce3+ to activator Mn2+ via a nonradiative dipole–dipole mechanism in LSBO:Ce3+,Mn2+ phosphors. The critical energy transfer distance has also been calculated by the concentration quenching method. The emission color of the obtained phosphors can be modulated from blue-violet (0.1629, 0.0523) to pink (0.3227, 0.1830) by controlling the doping content of the Mn2+ ions with the fixed Ce3+ content.
Acknowledgements
This present work was supported by the National Natural Science Foundations of China (Grant no. 51002146, no. 41172053, no. 51272242), Natural Science Foundations of Beijing (2132050), the Program for New Century Excellent Talents in University of Ministry of Education of China (NCET-12-0950), Beijing Nova Program (Z131103000413047) and Beijing Youth Excellent Talent Program (YETP0635).
References
-
(a) Z. G. Xia and R. S. Liu, J. Phys. Chem. C, 2012, 116, 15204 Search PubMed;
(b) S. Nakamura, M. Senoh and T. Mukai, Appl. Phys. Lett., 1993, 62, 2390 CrossRef CAS PubMed.
-
(a) W. R. Liu, C. H. Huang, C. W. Yeh, J. C. Tsai, Y. C. Chiu, Y. T. Yeh and R. S. Liu, Inorg. Chem., 2012, 51, 9636 CrossRef CAS PubMed;
(b) H. A. Höppe, Angew. Chem., Int. Ed., 2009, 48, 3572 CrossRef PubMed.
-
(a) M. P. Saradhi and U. V. Varadaraju, Chem. Mater., 2006, 18, 5267 CrossRef CAS;
(b) Z. G. Xia, J. Q. Zhuang and L. B. Liao, Inorg. Chem., 2012, 51, 7202 CrossRef CAS PubMed;
(c) J. Y. Sun, J. L. Lai, Z. G. Xia, X. Y. Zhang, H. K. Liu and H. Y. Du, Appl. Phys. B, 2012, 107, 827 CrossRef CAS.
-
(a) H. S. Jang, Y. H. Won and D. Y. Jeon, Appl. Phys. B, 2009, 95, 715 CrossRef CAS;
(b) C. H. Huang and T. M. Chen, Inorg. Chem., 2011, 50, 5725 CrossRef CAS PubMed;
(c) R. J. Xie, N. Hirosaki and M. Mitomo, J. Electroceram., 2008, 21, 370 CrossRef CAS;
(d) Z. G. Xia, X. M. Wang, Y. X. Wang, L. B. Liao and X. P. Jing, Inorg. Chem., 2011, 50, 10134 CrossRef CAS PubMed.
- C. H. Huang, W. R. Liu and T. M. Chen, J. Phys. Chem. C, 2010, 114, 18698 CAS.
- Z. G. Xia, Y. Y. Zhang, M. Molokeev, V. Atuchin and Y. Luo, Sci. Rep., 2013, 3, 3310 Search PubMed.
- S. A. Naidu, U. V. Naradaraju and B. J. Raveau, Solid State Chem., 2010, 183, 1847 CrossRef CAS PubMed.
- Y. Zhang, G. G. Li, D. L. Geng, M. M. Shang, C. Peng and J. Lin, Inorg. Chem., 2012, 51, 11655 CrossRef CAS PubMed.
- M. M. Shang, G. G. Li, D. L. Geng, D. M. Yang, X. J. Kang, Y. Zhang, H. Z. Lian and J. Lin, J. Phys. Chem. C, 2012, 116, 10222 CAS.
-
(a) A. K. Sharma, K. H. Son, B. Y. Han and K. S. Sohn, Adv. Funct. Mater., 2010, 20, 1750 CrossRef CAS;
(b) M. M. Shang, G. G. Li, D. M. Yang, X. J. Kang, C. Peng and J. Lin, Dalton Trans., 2012, 41, 8861 RSC;
(c) W. C. Ke, C. C. Lin, R. S. Liu and M. C. Kuo, J. Electrochem. Soc., 2010, 157, J307 CrossRef CAS PubMed;
(d) Q. Wang, Z. P. Ci, G. Zhu, M. D. Que, S. Y. Xin, Y. Wen and Y. H. Wang, ECS J. Solid State Sci. Technol., 2012, 1, R92 CrossRef CAS PubMed.
- Y. F. Liu, X. Zhang, Z. D. Hao, X. J. Wang and J. H. Zhang, Chem. Commun., 2011, 47, 10677 RSC.
- X. G. Zhang and M. L. Gong, Mater. Lett., 2011, 65, 1756 CrossRef CAS PubMed.
- G. G. Li, D. L. Geng, M. M. Shang, C. Peng, Z. Y. Cheng and J. Lin, J. Mater. Chem., 2011, 21, 13334 RSC.
- C. H. Huang and T. M. Chen, J. Phys. Chem. C, 2011, 115, 2349 CAS.
- TOPAS V3.1: General Profile and Structure Analysis Software for Powder Diffraction Data, B. A., Karlsruhe, Germany.
-
(a) D. Mazza, M. Tribaudino, A. Delmastro and B. Lebech, J. Solid State Chem., 2000, 155, 389 CrossRef CAS;
(b) G. Zhu, Y. H. Wang, Z. P. Ci, B. T. Liu, Y. R. Shi and S. Y. Xin, J. Electrochem. Soc., 2011, 158, J236 CrossRef CAS PubMed.
-
(a) J. S. Hou, W. Z. Jiang, Y. Z. Fang, Y. M. Wang, X. Yin and F. Q. Huang, ECS J. Solid State Sci. Technol., 2012, 1, R57 CrossRef CAS PubMed;
(b) J. Zhou, Z. G. Xia, M. X. Yang and K. Shen, J. Mater. Chem., 2012, 22, 21935 RSC.
- H. Xu, Z. G. Xia, H. K. Liu and L. B. Liao, ECS J. Solid State Sci. Technol., 2013, 2, R186 CrossRef CAS PubMed.
- J. Lin and Q. Su, J. Alloys Compd., 1994, 210, 159 CrossRef CAS.
- G. G. Li, D. L. Geng, M. M. Shang, Y. Zhang, C. Peng, Z. P. Ci and J. Lin, J. Phys. Chem. C, 2011, 115, 21882 CAS.
- L. A. Shi, Y. L. Huang and H. J. Seo, J. Phys. Chem. A, 2010, 114, 6927 CrossRef CAS PubMed.
- Y. C. Jia, Y. J. Huang, N. Guo, H. Qiao, Y. H. Zheng, W. Z. Lv, Q. Zhao and H. P. You, RSC Adv., 2012, 2, 2678 RSC.
-
(a) C. H. Huang, T. M. Chen, W. R. Liu, Y. C. Chiu, Y. T. Yeh and S. M. Jang, ACS Appl. Mater. Interfaces, 2010, 2, 259 CrossRef CAS;
(b) C. H. Huang and T. M. Chen, Opt. Express, 2010, 18, 5089 CrossRef CAS PubMed;
(c) Z. G. Xia, J. Q. Zhuang, H. K. Liu and L. B. Liao, J. Phys. D: Appl. Phys., 2012, 45, 015302 CrossRef.
-
(a) Z. G. Xia, J. Q. Zhuang, L. B. Liao, H. K. Liu, Y. Luo and P. Du, J. Electrochem. Soc., 2011, 158, J359 CrossRef CAS PubMed;
(b) N. Guo, Y. H. Zheng, Y. C. Jia, H. Qiao and H. P. You, New J. Chem., 2012, 36, 168 RSC.
- D. L. Geng, M. M. Shang, D. M. Yang, Y. Zhang, Z. Y. Cheng and J. Lin, J. Mater. Chem., 2012, 22, 23789 RSC.
- C. J. Duan, Z. J. Zhang, S. Rösler, S. Rösler, A. Delsing, J. T. Zhao and H. T. Hintzen, Chem. Mater., 2011, 23, 1851 CrossRef CAS.
- H. P. You, G. Y. Hong, X. Y. Wu, J. K. Tang and H. P. Hu, Chem. Mater., 2003, 15, 2000 CrossRef CAS.
- J. Y. Yu, Z. D. Hao, X. Zhang, Y. S. Luo and J. H. Zhang, Chem. Commun., 2011, 47, 12376 RSC.
- B. Antipenk, I. M. Bataev, V. L. Ermolaev, E. I. Lyubimov and T. Privalov, Opt. Spectrosc., 1970, 29, 177 Search PubMed.
- G. Blasse and B. C. Grabmaier, Luminescent Materials, Springer-Verlag, Berlin, 1994 Search PubMed.
- W. J. Yang, L. Y. Luo, T. M. Chen and N. S. Wang, Chem. Mater., 2005, 17, 3883 CrossRef CAS.
- P. R. Biju, G. Jose, V. Thomas, V. P. N. Nampoori and N. V. Unnikrishnan, Opt. Mater., 2004, 24, 671 CrossRef CAS.
- H. Jiao, F. Liao, S. Tian and X. J. Jing, J. Electrochem. Soc., 2003, 150, H220 CrossRef CAS PubMed.
- C. H. Huang, T. S. Chan, W. R. Liu, D. Y. Wang, Y. C. Chiu, Y. T. Yeh and T. M. Chen, J. Mater. Chem., 2012, 22, 20210 RSC.
- M. Li, X. F. Yu, W. Y. Yu, J. Zhou, X. N. Peng and Q. Q. Wang, J. Phys. Chem. C, 2009, 113, 20271 CAS.
- W. J. Ding, J. Wang, Z. M. Liu, M. Zhang, Q. Su and J. K. Tang, J. Electrochem. Soc., 2008, 155, J122 CrossRef CAS PubMed.
- J. S. Kim, Y. H. Park, S. M. Kim, J. C. Choi and H. L. Park, Solid State Commun., 2005, 133, 445 CrossRef CAS PubMed.
- J. Zhang, H. Liang and Q. Su, J. Phys. D: Appl. Phys., 2009, 42, 105110 CrossRef.
|
This journal is © The Royal Society of Chemistry 2014 |
Click here to see how this site uses Cookies. View our privacy policy here.