Imaging of luminescence induced by beta and gamma emitters in conventional non-scintillating materials

Marco Pagliazzia, Federico Boschib and Antonello E. Spinelli*a
aMedical Physics Department and Centre for Experimental Imaging, San Raffaele Scientific Institute, Via Olgettina 60, Milan, Italy. E-mail: spinelli.antonello@hsr.it
bDepartment of Computer Sciences, University of Verona, Strada Le Grazie 15, 37134 Verona, Italy

Received 27th November 2013 , Accepted 4th March 2014

First published on 5th March 2014


Abstract

Detecting radioluminescence in tissues in the optical and near infrared regions of the electromagnetic spectrum has recently emerged as a new research field for preclinical bioluminescent imaging. Even though Cerenkov light emission of beta particles is the main mechanism of radioisotope luminescence we showed that alpha or gamma emitters are nevertheless capable of generating luminescence, as demonstrated in many recent studies. Here we report a series of experimental observations aiming to distinguish between Cerenkov and non-Cerenkov radioluminescence in organic and inorganic samples like ex vivo chicken tissue, glass and acrylic. These two phenomena have been found to differ significantly in terms of light spectrum, light production yield, and spatial distribution of the luminescent region in the sample when excited by radionuclide decay as a radiation source. More precisely, the Cerenkov radiation spectrum, as expected, does not exhibit great variability with respect to the radiator used. Nevertheless, radioluminescence originating from other phenomena than Cerenkov emission was found to be characterized by material dependent emission spectra. Detailed measurements of the signal due to non-Cerenkov radiation are important in biological applications and optical imaging: they allow engineering a radiator material that enhances light production from escaping radiation and can be subtracted from emission spectra when attempting 3D image reconstruction by multi-spectral Cerenkov luminescence tomography.
Introduction

Radioluminescence is the optical emission following excitation by the ionizing radiation generated, for example, by decay of radionuclides in tissue. Observation of light emitted by decay of radionuclides of common interest in nuclear medicine (i.e. 18F) is referred to as Cerenkov luminescence imaging (CLI).1–3 Recently, many studies have been proposed that effectively use CLI as a new way of detecting both beta-plus and beta-minus radioisotopes in vivo.4–7 Due to its nature, Cerenkov emission is produced in a radiator material only when charged particles travel with kinetic energy above a threshold energy, which depends on the refractive index of the material.8

There have been several experimental evidences of radioluminescence in tissue generated by radionuclides that are not compatible with Cerenkov emission conditions. For example, 99mTc and 241Am have been found9,10 to emit a detectable amount of optical photons. 99mTc in particular is a promising new probe for luminescence imaging in vivo as it was proven.11 Unlike scintillation that takes place in controlled and often purposely-engineered scintillators the radioluminescence of animal and human tissues is a weaker phenomenon in terms of the detectability of emitted luminous signal. Characterization of the non-Cerenkov light production of material that are not engineered to display scintillation capabilities is a complex task because the phenomenon is strongly material-dependent and often generates faint fluxes of light that are hard to detect. Studies that make use of a list of light sensors that vary between spectrographic films and cryogenically cooled CCDs were published in a period spanning over 60 years, which analyze the non-Cerenkov luminescence of ice or water when irradiated for example by high-energy 60Co gamma radiation12 or beta radiation from 32P decay.13 Results presented in these papers were at the odds with each other regarding the possibility of non-Cerenkov emission of non-scintillator materials like pure water. However, given the tremendous improvements of the sensitivity of the detectors that took place in recent times, the existence of weak radioluminescence of water was experimentally proven.14 More recently there has been a renewed interest on radioluminescence of non-scintillating material: scintillation dosimetry required careful characterization of luminous spurious signal produced in fiber optics used to readout scintillators in radiotherapy applications. This phenomenon, known as stem effect, is clearly given by the superposition of a radioluminescent and Cerenkov signal, as experimentally measured in a silica light guide.15 Measurements of stem effect have been also carried out in poly(methyl methacrylate) (PMMA or acrylic) core fibers.16 The cited experimental works were almost entirely carried out with spectrometers and PMT sensors, thus lacking of immediate imaging capabilities.

In this work we show that radionuclides that are not capable of generating Cerenkov light can stimulate the radioluminescence of animal tissue and of some materials commonly used in optical setups (glass and acrylic plastic). We also show that in this case the spectrum of radioluminescence is different respect to Cerenkov and strongly material-dependent. In the following we address the phenomenon of luminescence induced by technetium decay as non-Cerenkov radioluminescence (NCR). This emission was also characterized in its spatial extent of production using two-dimensional images. Despite the low amount of emitted light, spectrometry was proven to be feasible using optical filters and a deeply cooled CCD in a commercial optical system (IVIS Spectrum, Perkin & Elmer). One of the greatest advantages of Cerenkov light for in vivo applications is a broadband and very predictive and stable power spectrum in the visible and near infrared (NIR) spectral regions. The knowledge of the power spectrum of Cerenkov emission is required for example when using tomographic reconstruction techniques in optical tomography.17 Here we focus on the red and NIR portion of the optical spectrum where tissues are known to be relatively transparent.

Results and discussion

Radioluminescence efficiencies

Typical Cerenkov energy threshold values for electrons and positrons are 263 keV for water (n ≃ 1.33 at 500 nm wavelength) and 219 keV for tissue (n ≃ 1.40 at 500 nm wavelength emission) (Ross, 1969). For the acrylic and glass samples used in this work the threshold drops down respectively to 178 keV and 182 keV. A first way to generate Cerenkov luminescence in materials is by irradiating them with an external beam of energetic electrons or other charged particles from an accelerator. We did not consider this technology in our experiments for two reasons: first, it is not compatible with our imaging system, and second, we are explicitly interested in studying radionuclide emission for in vivo applications.

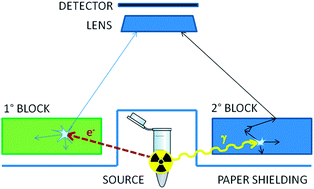
We used 32P and 99mTc as radioactive sources to stimulate radioluminescence in acrylic, glass and tissue samples. Compton and photoelectric electrons from 99mTc gamma decay, which has a gamma endpoint energy of 140 keV,18 are thus not able to produce Cerenkov. On the other hand 32P undergoes beta-minus decay with endpoint energy of 1.7 MeV,18 allowing Cerenkov production. In the following, we alternate between the two sources keeping the two samples in position (Fig. 1).


image file: c3ra47102k-f1.tif
Fig. 1 Schematics of the experimental setup. Sample radioluminescence can be excited by beta-minus emission from 32P or gamma emission from 99mTc which take place in separate experiments. A thin black paper shielding was used in order to impede detection of the light that is generated in the vial.

Material samples were shaped as two right isosceles triangular based prisms made of acrylic plastic and glass. Samples were polished and transparent. We measured the total counts in the triangular ROIs corresponding to each block (see Fig. 2a).


image file: c3ra47102k-f2.tif
Fig. 2 (a) In two separated experiments 32P (left) and 99mTc (right) sources are placed between two blocks of acrylic and glass. 300 s, f = 1 luminescent acquisition is superimposed to f = 8 photographic image of the setup from above. Color bars are in logarithm of camera analog/digital units (ADU). (b) Luminescence intensity profiles of the light emission in the two blocks, normalized to the maximum intensity. Measurements of spatial distribution of light production are in Table 1. The profiles are measured corresponding to the dashed lines in (a).

We acquired images of the samples from above using long photographic exposures. We found the radioluminescence efficiency of the materials (the amount of light generated when exposed to the same source) to be strongly dependent on the type of radiant source used. In the case of the acrylic block we found a high response to 32P irradiation as opposed to a low signal detected when 99mTc is used. Using the glass block, the response is relatively stronger with 99mTc respect to 32P source and, thus, the induced radioluminescence efficiency appears inverted. The two materials display an opposite efficiency of light emission when we switch between the two sources, as shown in Fig. 3.


image file: c3ra47102k-f3.tif
Fig. 3 Comparison of the recorded luminescent intensities in the broad 500–840 nm spectral window by summing 18 spectral points. Results are normalized to the maximum for each source and presented in arbitrary units (A.U.).

We found that switching source results also in a very different spatial extent of the light-emitting region inside of each block. In Fig. 2a three segments (represented as dashed lines) have been drawn superimposed to the co-localization of luminescence for two different experiments: when 32P source is in place (left) and when 99mTc source is used (right). The three lines intersected the maximum intensity pixel for each block. The light emission profiles in Fig. 2b were measured by sampling the value of the pixels that these lines are crossing on the luminescent images. By comparing the distances from the border of the sample at which light production reaches the 90% of the maximum (l90%, see Table 1), we found that irradiation by 99mTc gamma radiation causes the production of light in glass to happen at about 1 order of magnitude greater distance from the source with respect to the case in which 32P is used. Light emission from 99mTc in acrylic was too low in intensity to allow for meaningful representation of a profile along aligned pixels.

Table 1 Spatial extent of the production of light in the two materials exposed to different radiation
  l90% Isotope, material
A 1.41 ± 0.08 mm 32P, glass
B 2.70 ± 0.06 mm 32P, acrylic
C 12.4 ± 1.2 mm 99mTc, glass


Spectral analysis of emission

Spectral measurement are resolved over 18 points corresponding each to 20 nm wide band-pass optical acquisition filters of the IVIS Spectrum system. Filters are placed in front of the lens and automatically switched. Emission from the two blocks exhibits a low relative variability in the red part of the spectrum as shown in Fig. 4a. On the other hand, it is evident that spectra are different in the two blocks when a technetium source is used at long wavelengths (λ > 700 nm). We focused on NIR spectral region as it has been shown to be of great interest for optimized Cerenkov imaging due to the relative transparency of tissue in this region of the spectrum.19 The differences between the spectrum of the optical radiation of the two blocks are within 20% for the irradiation by 32P, while they can reach 200% when gamma radiation from 99mTc is used.
image file: c3ra47102k-f4.tif
Fig. 4 (a) Comparison of the light emission spectra of acrylic and glass when exposed to different sources of ionizing radiation. Spectral points are normalized and shown for the red and NIR part of the spectrum only (λ > 700 nm). (b) Residuals obtained by comparing the emissions of acrylic and glass for two different sources of radiation.

The background signal was measured by not placing sources between the blocks and by performing a spectral acquisition, keeping the same acquisition parameters. We show in Fig. 5 that the measured signal from acrylic when 99mTc is uses as a source, hence the faintest source of light investigated, is still clearly distinguishable from the background.


image file: c3ra47102k-f5.tif
Fig. 5 Comparison of the measured light emission of acrylic using 99mTc as a source and the background obtained repeating the experiment with no radioactive source. Error bars for the background display statistical dispersion of the measured background intensity at 3 standard deviations (3σ) and 1 standard deviation (1σ), respectively.

We found a smaller relative difference in the spectral response among the blocks to 32P irradiation in the spectral region of interest (Fig. 4a). It is evident that NCR spectrum is strongly dependent on the choice of the radiator material, while for Cerenkov this dependence is considerably reduced. For λ > 700 nm, the NCR emission of acrylic has been found to increase at longer emission wavelength. This can be clearly seen in Fig. 4a. Spectrum of NCR from 99mTc is clearly radiator-dependent, while this does not hold when 32P is used. This finding is in agreement with the theory of Cerenkov radiation, in which the power spectrum of the emission is independent on the material and monotonically decreasing with increasing wavelength. This evidence suggests that NCR is due at an atomic scale to de-excitation of matter after the absorption of energy from ionizing radiation source. A very similar behaviour was seen in optical fibres for scintillation light collection in the work of Therriault-Proulx and co-workers.20 NCR emission phenomenon may be present even for the case of radiation from 32P, superimposed to Cerenkov radiation, as a less efficient mechanism of radioluminescence.

Radioluminescence efficiencies

Optical emission induced by the two sources is due to different mechanisms that take place at atomic scale and that are responsible for the opposite behaviour of the same material when it is exposed to different radiating sources. Radioluminescence light yield is, both for 32P and 99mTc, proportional to the activity of the source.3,4 This was initially considered as a way to estimate the activity of the sample. This measurement would anyway pose other technical issues: for example Cerenkov radiation has a preferential direction of emission that can lead to underestimate the Cerenkov emission in a setup in which the radiator, the source and the detector are not optically aligned.

The measurement was repeated with the 99mTc source in place by blinding the lens while performing photographic acquisition with the same acquisition parameters. No light that may come from the interaction of radiation with the lenses was detected.

Spatial distribution of light production in blocks

By comparing our results with both experimental and simulated data found in the literature21 the extent of the light production was found compatible with the range of over-the-threshold electrons from β-decay for 90Y which has a comparable endpoint energy. NCR optical emission is an effect of the interaction of gamma radiation with the radiating material. Therefore, its intensity is expected to scale with the attenuation length across the sample. The photon attenuation coefficient for 140 keV gammas is expected to vary between glass and acrylic with a good approximation in a way that is proportional to their densities.22 On the other hand, Cerenkov light yield varies depending on both refractive index and electron stopping power of the material. A higher refractive index corresponds to a lower energy threshold for emission, so more electrons will contribute to emission. This behaviour is more evident for radionuclides which have low endpoint energy beta spectra. In this case many particles are likely to be emitted with under-the-threshold energy, while the particles that are emitted with sufficient energy to generate Cerenkov see their energies rapidly reaching under-the-threshold values due to interactions with the material. On the other hand, lower electron stopping power will result in electrons being over-the-threshold for a longer path, so they will emit a higher quantity of photons according to Frank & Tamm's theory. Acrylic and glass have very similar refractive indices. Acrylic has a lower attenuation coefficient for β radiation, and it was found in fact to emit more Cerenkov light than glass. Moreover, glass exhibits a five-fold higher density with respect to acrylic and we believe this is the reason of its higher radioluminescence efficiency when exposed to gamma radiation form 99mTc.

An efficient Cerenkov optical radiator for low energy beta-decaying radionuclides to be used to enhance light emission in biological applications would therefore be a high refractive index, low electron stopping power material. Acrylic would be a better choice than glass; it also minimizes the NCR component.

Light production in tissue

In two other experiments we recorded light after replacing a block with a slice of chicken breast and removing the other block. We then switched the radioactive source as described before acquiring each time spectral measurements. We found strong differences in the power spectrum of emission by plotting the total flux of luminescent photons excited by 32P or 99mTc (Fig. 6). The chicken breast tissue is a scattering and absorbing medium. Thus, unlike the other setup, in which transparent glass or acrylic blocks were used, we cannot assume that the power spectrum of the light reaches the surface of the blocks unperturbed.
image file: c3ra47102k-f6.tif
Fig. 6 Light emission spectra in two experiments on a chicken breast sample using 32P and 99mTc as sources of radiation. The 18 spectral measurements were normalized to the value corresponding to 500 nm light emission wavelength.

We found that the spectrum of light emission varies significantly by alternating irradiation sources. However, this phenomenon strongly depends on the optical transmission properties of tissue, which are more complex to model with respect to transparent, organic or inorganic materials used as radiators in the other experiments. Characteristics of the setup like the depth of production of light following radioluminescent phenomena are harder to monitor in tissue and may affect strongly the spectral outcome, as the assumption that we record all the radioluminescence emission is no longer valid. For example, photons produced deeper inside the sample cannot emerge unperturbed from the tissue due to attenuation and coherent scattering, and emission spectrum gets distorted by colour-selective attenuation. Spectral differences are induced by the chromatic attenuation properties of tissue. Using the same tissue sample with different sources in place we give evidence that spectral analysis offers a way to discern NCR from Cerenkov also in in vivo applications.

Experimental

Source and target

Identical 0.5 ml vials (Eppendorf), containing 100 μL of two different radiotracers in physiological solution were placed in two separated experiments between two blocks of transparent material and optically shielded by using sheets (500 μm thick) of black paper. We repeated the experiments switching between the sources. We used 99mTc-Methylene Diphosphate (99mTc-MDP) and Adenosine 5′-Triphosphate[γ-32P] (32P-ATP), (Perkin-Elmer) as sources. The materials used as radiators, which are in order glass, acrylic and a sample of chicken breast, where arranged in three acquisition setups. For the first setup, we used two identical blocks, shaped as right isosceles triangular based prisms of 3.75 cm3 volume and 6 mm height. They were made of acrylic plastic and glass. Refractive indices of this two materials are n = 1.48 and n = 1.49 and densities are 1.18 g cm−3 and 6 g cm−3, respectively. In a second setup, a slice of uniform chicken breast, 6 mm thick, was cut with the same shape of the blocks. In a third setup that was used for control, we repeated the measurements substituting for each experiment the vial containing the source with an empty one. We measured the signal from the plastic and glass blocks keeping the same exposure parameters. These measurements are used as dark measurements and finalized to determine the noise floor of the system.

Image acquisition

Images were acquired by using a small animal optical imaging system (IVIS Spectrum, Perkin-Elmer). The instrument is equipped with a cooled (−90 °C) back-thinned, back-illuminated CCD camera. The CCD has an active array of 1920 × 1920 pixels with a dimension of 13 microns. All the materials used here as optical radiators, with the exception of the chicken slab, were chosen to be transparent. The focus was set on the top of each sample. The lens aperture diaphragm was set full open (f = 1) for the spectral images. A long exposure time of 300 s was used for each acquisition. For spectral measurements 18 interchangeable, non-overlapping filters were used to cover the 500 nm to 840 nm spectral window of the visible spectrum obtaining 18 images. For each filter the optical band-pass window was 20 nm wide. Each image was corrected for dark current and reading bias by the Living Image 4.3.1 software (Perkin & Elmer). Correction for cosmic rays and gamma rays from the sample and flat field and background subtraction were also performed. Binning was set to “high”, corresponding to a binning index of 16. Field of view was set to 65 × 65 mm in order to completely cover the two blocks (see Fig. 2a). Two triangular ROIs were drawn on each image corresponding to the two blocks. The sums of the signals of the binned pixels in each ROI are then displayed corresponding to the centre of the band-pass window of the filter.

Conclusion

The spectral analysis of NCR excited by technetium was found to be strongly material-dependent, as shown by comparing in the red and NIR spectral region the emission spectra of an organic material as acrylic glass and an inorganic one as glass. To the best of our knowledge this measurement has never been recorded for radionuclide decay.

Differently from NCR, Cerenkov radiation from over the threshold electrons originated by beta decay displays an emission power spectrum less dependent on the material used as a radiator, in agreement with the Frank and Tamm's formula. While the overall intensity of the NCR, in this case, depends mainly on the attenuation coefficient of the material with respect to 140 keV photons, i.e. on the material density, the Cerenkov emission efficiency is more complex to estimate a priori. In fact it depends on the refractive index as well as on the stopping power of the charged electrons and positrons.

We conclude that NCR and Cerenkov from nuclear decays are coexisting phenomena. They can be separated with a spectral characterization of the emitted light while engineering the radiating material. This knowledge will allow for a better understanding on how to choose an efficient Cerenkov radiator for in vivo Cerenkov luminescence imaging studies.

Acknowledgements

This work has been funded by the Italian ministry of health grant no. GR-2010-2309585. The authors would also like to acknowledge the Cariverona Foundation.

References

  1. A. E. Spinelli, D. D'Ambrosio, L. Calderan, M. Marengo, A. Sbarbati and F. Boschi, Phys. Med. Biol., 2010, 55, 483–495 CrossRef PubMed .
  2. R. Robertson, M. S. Germanos, C. Li, G. S. Mitchell, S. R. Cherry and M. D. Silva, Phys. Med. Biol., 2009, 54, N355–N356 CrossRef CAS PubMed .
  3. F. Boschi, L. Calderan, D. D'Ambrosio, M. Marengo, A. Fenzi, R. Calandrino, A. Sbarbati and A. E. Spinelli, Eur. J. Nucl. Med. Mol. Imaging, 2011, 38, 120–127 CrossRef PubMed .
  4. A. E. Spinelli, F. Boschi, D. D'Ambrosio, L. Calderan, M. Marengo, A. Fenzi, M. Menegazzi, A. Sbarbati, A. Del Vecchio and R. Calandrino, Nucl. Instrum. Methods Phys. Res., Sect. A, 2011, 648, S310–S312 CrossRef CAS PubMed .
  5. A. E. Spinelli, M. Marengo, R. Calandrino, a. Sbarbati and F. Boschi, Q J Nucl Med Mol Imaging, 2012, 56, 279–289 Search PubMed .
  6. H. Liu, G. Ren, Z. Miao, X. Zhang, X. Tang, P. Han, S. S. Gambhir and Z. Cheng, PLoS One, 2010, 5, e9470 Search PubMed .
  7. A. E. Spinelli and F. Boschi, J. Biomed. Opt., 2011, 16, 120507 CrossRef PubMed .
  8. H. H. Ross, Anal. Chem., 1969, 41, 1260–1265 CrossRef CAS .
  9. A. E. Spinelli, S. Lo Meo, R. Calandrino, A. Sbarbati and F. Boschi, J. Biomed. Opt., 2011, 16, 116023 CrossRef PubMed .
  10. F. Boschi, S. Lo Meo, P. L. Rossi, R. Calandrino, A. Sbarbati and A. E. Spinelli, J. Biomed. Opt., 2011, 16, 126011–126015 CrossRef PubMed .
  11. F. Boschi, M. Pagliazzi, B. Rossi, M. P. Cecchini, G. Gorgoni, M. Salgarello and A. E. Spinelli, J. Biomed. Opt., 2013, 18, 76005 CrossRef PubMed .
  12. D. N. Sitharamarao and J. F. Duncan, J. Phys. Chem., 1963, 67, 2126–2132 CrossRef CAS .
  13. M. A. Greenfield, A. Norman, A. H. Dowdy and P. M. Kratz, J. Opt. Soc. Am., 1953, 43, 42–43 CAS .
  14. M. D. Tarasov, S. L. El'yash, V. F. Goncharova, O. N. Petrushin, Y. a. Savel'ev, M. Y. Tarakanov and Y. S. Shigaev, Instrum. Exp. Tech., 2007, 50, 761–763 CrossRef CAS .
  15. S. F. de Boer, A. S. Beddar and J. A. Rawlinson, Phys. Med. Biol., 1993, 38, 945–958 CrossRef .
  16. F. Therriault-Proulx, L. Beaulieu, L. Archambault and S. Beddar, Med. Phys., 2012, 39, 3967 Search PubMed .
  17. A. E. Spinelli, C. Kuo, B. W. Rice, R. Calandrino, P. Marzola, A. Sbarbati and F. Boschi, Opt. Express, 2011, 19, 12605–12618 CAS .
  18. LBNL Isotopes Project – LUNDS Universitet, http://ie.lbl.gov/toi/, accessed 27 Oct 2013.
  19. A. E. Spinelli and F. Boschi, J. Biomed. Opt., 2012, 17, 0405061–0405063 Search PubMed .
  20. F. Therriault-Proulx, L. Beaulieu, L. Archambault and A. S. Beddar, Phys. Med. Biol., 2013, 58, 2073 CrossRef CAS PubMed .
  21. B. J. Beattie, D. L. J. Thorek, C. R. Schmidtlein, K. S. Pentlow, J. L. Humm and A. H. Hielscher, PLoS One, 2012, 7, e31402 CAS .
  22. M. J. Berger, J. H. Hubbell, S. M. Seltzer, J. Chang, J. S. Coursey, R. Sukumar, D. S. Zucker, and K. Olsen, XCOM: Photon Cross Sections Database, NIST Standard Reference Database 8 (XGAM), 2010 Search PubMed .

This journal is © The Royal Society of Chemistry 2014
Click here to see how this site uses Cookies. View our privacy policy here.