Facile hydrothermal synthesis and electrochemical properties of orthorhombic LiMnO2 cathode materials for rechargeable lithium batteries†
Shulin Chena,
Feifei Caob,
Fan Liua,
Quanjun Xianga,
Xionghan Fenga,
Lihu Liua and
Guohong Qiu*a
aCollege of Resources and Environment, Huazhong Agricultural University, Wuhan, 430070, P. R. China. E-mail: qiugh@mail.hzau.edu.cn; Fax: +86 (0)27 87280271; Tel: +86 (0)27 87280271
bCollege of Sciences, Huazhong Agricultural University, Wuhan, 430070, P. R. China
First published on 26th February 2014
Abstract
Pure-phase, LiMn2O4-mixed and aluminum-doped orthorhombic LiMnO2 (o-LiMnO2) cathode materials with high discharge capacity and excellent cyclic stability were prepared by one-step hydrothermal reaction of MnCl2, EDTA, LiOH, AlCl3 and NaClO solutions. Chemical composition and aluminum content were affected by temperature and the concentration of LiOH, NaClO and AlCl3. A mixed phase of Mn3O4 and o-LiMnO2, pure-phase o-LiMnO2, and a mixed phase of o-LiMnO2 and LiMn2O4 were formed with increasing the concentration of NaClO from 0.08 to 0.25 mol L−1 at 180 °C for 24 h. Adding EDTA and NaClO facilitated the formation of o-LiMnO2. Al/Mn molar percent ratios in doped o-LiMnO2 were 0.34, 0.58, 0.91, and 1.22 when Al/Mn molar ratios in hydrothermal system were controlled at 0.05, 0.10, 0.15, and 0.20, respectively. Mixing LiMn2O4 and doping Al improved the discharge capacity and cyclic stability of o-LiMnO2. o-LiMnO2, the mixture with an o-LiMnO2/LiMn2O4 mass ratio of 2.45, and doped o-LiMnO2 with an Al/Mn molar percent ratio of 0.58 exhibited initial discharge capacities of 76, 139, and 82 mA h g−1, and cycling capacities of 124, 144, and 156 mA h g−1 after 100 cycles, respectively. This work facilitates the preparation and electrochemical performance improvement of o-LiMnO2.
1. Introduction
Lithium ion batteries have been widely investigated for high-power applications including electric vehicles, plug-in hybrid electric vehicles, and hybrid electric vehicles.1,2 For the first commercially successful cathode materials of lithium batteries, LiCoO2 needs to be substituted due to its high cost, toxicity, and low discharge capacity of 140–150 mA h g−1.3–5 Alternatively, o-LiMnO2 and spinel LiMn2O4 composites have been considered as promising cathode materials for rechargeable lithium ion batteries owing to their abundant resources, low cost, environmental friendship, safety, high voltage, and good rate capability, which has been a hot research topic in the field of chemical power source.6,7 However, LiMn2O4 exhibits lower discharge capacity of 110–120 mA h g−1 and cyclic stability due to accelerated Mn dissolution at an elevated temperature cycling and structural instability for Jahn–Teller distortion.4,5,7–9 o-LiMnO2 shows a higher theoretical discharge capacity of 285 mA h g−1, which is almost twice that of spinel LiMn2O4.10 Additionally, o-LiMnO2 shows a lower capacity fade rate, which is commonly affected by chemical structures and composition. Therefore, much effort has been devoted to the fabrication of pure-phased and doped o-LiMnO2 particles for cathode materials of lithium batteries.4,10–12At present, o-LiMnO2 samples are usually prepared by high temperature solid-state reactions,4,11 sol–gel process,13 ion exchange,7 and hydrothermal method.3,10,14 As for the above methods, micro-structured precursors including Mn2O3, MnCO3, NaMnO2, and γ-MnOOH should be first fabricated for the consequent transformation of o-LiMnO2. Multi-step and high temperature reactions will increase the energy consumption and cost. Recently, o-LiMnO2 nano-particles were prepared under mild hydrothermal conditions from KMnO4, MnCl2, and LiOH sources, but too much lithium source, Li/Mn molar ratio more than 30, was used.15 One-step hydrothermal method was used to prepare uniform nano-sized LiMnO2 with low energy consumption, and the morphologies could be easily controlled, and the as-obtained LiMnO2 showed excellent electrochemical performance.3,16 Generally, for the hydrothermal synthesis of o-LiMnO2, a high concentration of LiOH was required, and Li/Mn molar ratio in raw materials was usually larger than 13.15–17 In order to reduce cost for industrial application, the preparation of o-LiMnO2 using low Li/Mn molar ratio is highly desirable.
The weak cyclic stability of o-LiMnO2 is associated with Jahn–Teller distortion for the change of manganese oxidation states during charge–discharge process, and the partial substitution of Mn by metal ions is commonly used to stabilize the layered structure.11,12,18 Cr3+ and Al3+ ions prevent manganese ion migration during cycling, reducing the tendency of the layered structure converting to the more stable spinel.11 Cr substitution decreases the capacity fade rate of o-LiMnO2, and the reversible capacity maintains 160 mA h g−1 after 50 cycles with C/5 rate.18 Co doped LiMnO2 was formed using ion exchange of NaMnO2 synthesized by a solid state reaction, and kept 200 mA h g−1 even after 20 cycles at 0.1 mA cm−2 over the potential range of 2.6–4.85 V.7 Ni doped LiMnO2 also showed 198 mA h g−1 with retention ratio of 96% after 25 cycles at C/3, and the layered structures exhibited no phase change during charge–discharge process.19 The indium- and sulfur-doped LiMnO2 samples with orthorhombic structure as cathode materials of lithium batteries showed excellent electrochemical capacity of 267.9 mA h g−1.20 In other words, doping would remarkably improve LiMnO2 electrochemical performance including specific capacity and cyclic stability. Hydrothermal synthesis of doped LiMnO2 was usually conducted using the as-prepared precursors, such as MnCO3 (ref. 11 and 18) and Mn2O3.18–20 To the authors' knowledge, there was no facile one-step hydrothermal process to prepare metal doped o-LiMnO2.
As for hydrothermal synthesis, pure-phased LiMnO2 was difficult to synthesize likely due to the further oxidation of LiMnO2 to form Li2MnO3.21 An appropriate redox rate should be controlled to obtain single-phased LiMnO2 with low-valent manganese. Under refluxing conditions, sodium hypochlorite (NaClO) could oxidize Mn(II) source to form uniform ramsdellite-type manganese oxide with various morphologies.22 MnPO4·H2O and hureaulite containing low-valent Mn(III/II) can also be fabricated by adjusting reactant ratios and reaction temperatures.22,23 Our previous studies have suggested that manganese minerals with different oxidation states of manganese could be formed when NaClO worked as oxidant.
In this work, pure-phased, LiMn2O4-mixed and aluminum-doped LiMnO2 cathode materials were hydrothermally fabricated using 0.1 mol L−1 MnCl2 and NaClO solutions. Complexant EDTA was used to chelate Mn2+ to adjust the reaction rate to obtain single-phased o-LiMnO2. The effect of reactant concentration and temperature on the chemical composition of products was studied. The influence of composition and Al doping on the unit cell parameters and the corresponding electrochemical performance of o-LiMnO2 was investigated by X-ray diffraction spectrometry, Rietveld structure refinement, Fourier transform infrared spectroscopy, cyclic voltammetry, and electrochemical impedance spectroscopy.
2. Materials and methods
2.1. Materials and chemicals
MnCl2·4H2O (AR, ≥99.0%), ethylene diamine tetraacetic acid tetrasodium salt (C10H12N2O8Na4·4H2O, EDTA, AR, ≥40%), AlCl3·6H2O (AR, ≥97.0%), LiOH·H2O (AR, >99.0%), anhydrous ethyl alcohol (AR, ≥99.7%) and NaClO solution (AR, available chlorine content ≥5.2%) were all purchased from China National Medicine Group Shanghai Chemical Reagent Company. High purity metallic lithium pellets (99.9%) were supplied by Wuhan Newthree Technology Co. Ltd., China. All reagents used were of analytical grade, unless otherwise noted.2.2. Preparation and characterization of o-LiMnO2
MnCl2·4H2O (0.989 g) and EDTA (2.262 g) were first dissolved in distilled deionized water (DDW) in a beaker, and NaClO solution (6.717 g) and LiOH·H2O (1.253 g) were then added to the above solution system. The suspended solution was adjusted to 50 mL by adding DDW and subsequently transferred into a Teflon-lined stainless steel autoclave with a volume of about 100 mL, sealed and maintained at 120, 150, and 180 °C, respectively, for 24 h. The concentration of MnCl2, EDTA, LiOH, and NaClO was controlled as 0.1, 0.1, 0.6, and 0.1 mol L−1, respectively. The suspension was then cooled to room temperature and washed by repeated filtration until the conductivity of filtrate was below 20.0 μS cm−1, and then dried in an oven at 60 °C for 24 h.In order to synthesize Al doped o-LiMnO2, AlCl3·6H2O was added to the above reaction system, and the concentration of LiOH and NaClO was slightly changed accordingly. When the concentration of AlCl3 was 0.005, 0.010, 0.015, and 0.020 mol L−1, LiOH concentration was controlled as 0.6, 0.6, 0.6, and 0.8 mol L−1, and NaClO concentration was adjusted as 0.10, 0.11, 0.12, and 0.12 mol L−1, respectively. The as-prepared Al doped LiMnO2 samples were washed and dried as above.
The as-obtained products were identified by X-ray diffraction spectrometry (XRD, Bruker D8 Advance diffractometer with Cu Kα) at a scan rate of 1° per min with a step of 0.02°. Structure refinement of XRD data was carried out by Rietveld method using TOPAS software (Bruker). The micro-morphologies of samples were characterized by scanning electron microscopy (FE-SEM, JEOL, JSM-6700F) and transmission electron microscopy (TEM, Hitachi-7650). The particle size distribution of the as-obtained samples was analyzed using software ImageJ 1.46 (National Institutes of Health, USA) by SEM images. Fourier transform infrared spectroscopy (FTIR, Nicolet 8700) was carried out using a DTGS detector by making pellets with KBr powder and LiMnO2/KBr mass ratio about 1![[thin space (1/6-em)]](https://www.rsc.org/images/entities/char_2009.gif) :50, and the resolution was set at 4 cm−1 with a scan number of 64. BET surface area of LiMnO2 was tested with a Quantachrome Autosorb-1-C automated N2 gas adsorption system. The concentration of Al and Mn was measured using an inductively coupled plasma atomic emission spectrometry (ICP-AES, Varian Vista-MPX), and further examined by Varian AAS 240FS atomic absorption spectrometer (Varian, Australia).
:50, and the resolution was set at 4 cm−1 with a scan number of 64. BET surface area of LiMnO2 was tested with a Quantachrome Autosorb-1-C automated N2 gas adsorption system. The concentration of Al and Mn was measured using an inductively coupled plasma atomic emission spectrometry (ICP-AES, Varian Vista-MPX), and further examined by Varian AAS 240FS atomic absorption spectrometer (Varian, Australia).
2.3. Electrochemical measurements of o-LiMnO2
The electrochemical characteristics of the synthesized materials were evaluated by galvanostatic charge–discharge using 2032 coin-type cells assembled in an argon-filled glove box, and the simulated battery test controlled by a battery testing system (Shenzhen Neware Electric Co. Ltd., China). The cathode mixtures consisted of 75 wt% active materials (including o-LiMnO2, a mixture of o-LiMnO2 and LiMn2O4, and Al doped o-LiMnO2) dried at 110 °C for 12 h, 15 wt% acetylene black and 10 wt% polytetrafluoroethylene binder on an aluminum mesh. The anode and reference electrodes were the same lithium foil. The electrolyte was 1 mol L−1 LiClO4 in a mixture of EC, DMC, and EMC with equal volume in this work. Celgard 2400 membrane worked as a separator. The charge–discharge cycles were carried out between 4.3 V and 2.4 V (vs. Li+/Li) at a current density of 100 mA g−1 at 25 ± 1 °C. The cathode foils were characterized by XRD after different cycles of charge–discharge test.The electrochemical behaviors of active materials including o-LiMnO2 and the mixture of o-LiMnO2 and LiMn2O4 were studied by cyclic voltammetry in the above electrolyte at a scan rate of 0.1 mV s−1. Electrochemical impedance spectroscopy (EIS) was used to characterize the interface properties of the modified electrodes. EIS was employed using a 5 mV rms AC perturbation voltage of frequencies ranging from 0.01 Hz to 100 kHz. EIS data were analyzed by fitting to equivalent circuit models using ZSimpWin 3.10 software package (EChem Software). Electrochemical control was achieved by a computer assisted CHI660B electrochemical system (Shanghai Chenhua Instrument Co. Ltd., China).
3. Results
3.1. The preparation of o-LiMnO2
Hydrothermal reactions were conducted in different solution systems containing MnCl2, LiOH, EDTA, and NaClO at 120, 150, and 180 °C, respectively, for 24 h. As shown in Fig. 1a, a mixture of Mn3O4 (JCPDS: 01-1127), o-LiMnO2 (JCPDS: 86-0352), and Li2MnO3 (JCPDS: 73-0152) was formed when 0.08–0.10 mol L−1 NaClO was used in the presence of 0.1 mol L−1 MnCl2, 0.6 mol L−1 LiOH, and 0.1 mol L−1 EDTA at 120 °C. A mixed phase of birnessite (JCPDS: 87-1749) and Li2MnO3 was obtained when the concentration of NaClO was increased to 0.15 mol L−1. That is, high concentration of NaClO facilitates the formation of high valent manganese oxides. The influence of hydrothermal temperature on the product composition was also investigated. When reaction temperature was increased to 150 °C, a mixed phase of Mn3O4, o-LiMnO2, LiMn2O4 (JCPDS: 88-1026) and Li2MnO3 was formed using 0.08 mol L−1 NaClO solution as exhibited in Fig. 1b. When NaClO concentration was increased to 0.1 mol L−1, a mixture of o-LiMnO2 and LiMn2O4 was formed, which are both active cathode materials for rechargeable lithium batteries.6,7 Fortunately, when hydrothermal reaction was conducted at 180 °C, pure-phased o-LiMnO2 was achieved if NaClO concentration was kept at 0.10 mol L−1. However, a mixture of o-LiMnO2 and Mn3O4 was formed in the presence of 0.08 mol L−1 NaClO. Moreover, a mixture of o-LiMnO2 and LiMn2O4 was formed when NaClO concentration was further increased to 0.15 and 0.25 mol L−1 (Fig. 1c). In another word, hydrothermal temperature and enough NaClO supply played critical roles in the formation of pure o-LiMnO2. | ||
| Fig. 1 XRD patterns of products synthesized in hydrothermal systems containing 0.1 mol L−1 MnCl2, 0.1 mol L−1 EDTA, LiOH and NaClO for 24 h: 0.6 mol L−1 LiOH with different concentration of NaClO at 120 °C (a), 150 °C (b), and 180 °C (c); 0.1 mol L−1 NaClO with different concentration of LiOH at 180 °C (d). | ||
Decreasing hydrothermal temperature and increasing the concentration of NaClO facilitate the formation of lithium-manganese-oxide compounds with higher-valent manganese. Only when the hydrothermal reaction was conducted by using 0.1 mol L−1 NaClO at 180 °C for 24 h, could pure-phased o-LiMnO2 be formed, and it was represented as M0. When hydrothermal reaction was performed at 150 °C with the same reagent compositions as above, a mixture of o-LiMnO2 and LiMn2O4 was obtained with o-LiMnO2/LiMn2O4 mass ratio of 2.45:1 analyzed by XRD (Fig. 1b), which was designated as Mm.
Above results suggested that Mn3O4 and o-LiMnO2 were first formed, and then LiMn2O4 and Li2MnO3 were formed with increasing the concentration of NaClO. Diffraction peak at 18.5°, 2θ, can be assigned to Li2MnO3, the common impurity phase in o-LiMnO2 materials.5,13–15,24 Although the diffraction peaks of Li2MnO3 and LiMn2O4 overlap at about 18.5°, the chemical compositions can be identified by other peaks. LiMn2O4 exhibits a relative strong diffraction peak at 63.8°, which is observed in the XRD patterns of products as shown in Fig. 1b and c. Li2MnO3 shows a relative weak diffraction peak at 20.8°, however, there is no diffraction peaks at this diffraction angle in this work. Therefore, it could be safely concluded that a mixture of o-LiMnO2 and LiMn2O4 was formed when 0.1 mol L−1 NaClO was used at 150 °C (Fig. 1b). When hydrothermal reaction was conducted at 180 °C by using 0.15 and 0.25 mol L−1 NaClO, the diffraction peaks for the impurity phase in o-LiMnO2 materials could also be ascribed to LiMn2O4 (Fig. 1c).
The effect of LiOH concentration on the formation process of o-LiMnO2 was investigated in hydrothermal system containing 0.1 mol L−1 MnCl2, 0.1 mol L−1 NaClO, 0.1 mol L−1 EDTA at 180 °C for 24 h. As shown in Fig. 1d, pure-phased Mn3O4 was formed when LiOH concentration was controlled as in the range of 0.1–0.2 mol L−1, and a mixture of Mn3O4 and o-LiMnO2 was formed when LiOH concentration was increased to 0.4 mol L−1. Single-phased o-LiMnO2 was formed when LiOH concentration was increased to 0.6 and 0.8 mol L−1.
EDTA affected the reaction process possibly due to the complexation reaction with Mn2+. As for the hydrothermal reaction of 0.1 mol L−1 MnCl2, 0.1 mol L−1 NaClO, 0.6 mol L−1 LiOH at 180 °C for 24 h, a mixture o-LiMnO2, Mn3O4, and Li2MnO3 was formed rather than pure-phased o-LiMnO2 (Fig. S1†), indicating a definite necessity of EDTA for the formation of pure-phased o-LiMnO2. Fig. 2a and b show the SEM images of M0 and Mm, respectively. As a mixture of o-LiMnO2 and LiMn2O4, Mm exhibited a non-uniform size distribution, and the bigger particles were likely due to o-LiMnO2 since similar morphologies were observed for the pure-phased o-LiMnO2 (Fig. 2a).
 | ||
| Fig. 2 SEM images of M0 (a), Mm (b), M3 (c), M6 (d), M9 (e) and M12 (f). | ||
3.2. The preparation of aluminum doped o-LiMnO2
In order to prepare aluminum doped o-LiMnO2, AlCl3 was added to the hydrothermal system, in which pure-phased o-LiMnO2 (M0) was formed at 180 °C for 24 h. When Al(III)/Mn(II) molar ratio in reaction system was increased, the concentration NaClO and LiOH should be slightly increased to fabricate single-phased aluminum doped o-LiMnO2 samples. Single-phased aluminum doped o-LiMnO2 samples could be formed when Al/Mn molar ratios in reaction system were controlled as 0, 0.05, 0.10, 0.15, and 0.20 under the following conditions: LiOH concentration was 0.6, 0.6, 0.6, 0.6, and 0.8 mol L−1, and NaClO concentration was 0.1, 0.1, 0.11, 0.12 and 0.12 mol L−1, respectively. Al/Mn molar percent ratios in o-LiMnO2 samples were determined to be 0.34, 0.58, 0.91, and 1.22 when Al/Mn molar ratios in hydrothermal system were controlled as 0.05:1, 0.10:1, 0.15:1, and 0.20:1, respectively. Fig. S2† shows the XRD patterns of the as-obtained samples, and they were designated as M3, M6, M9 and M12 according to Al/Mn molar ratios in doped o-LiMnO2 being 0.34, 0.58, 0.91, and 1.22, respectively. It was noted that the Al/Mn molar ratios in o-LiMnO2 phase were significantly positively correlated with those in hydrothermal system, and linearly dependent coefficient R2 was 0.9971. Fig. 2c–f shows the SEM images of M3, M6, M9 and M12, and flake-like structures were observed. The content of doped aluminum had no obvious effect on the micro-morphologies of o-LiMnO2.
The particle size distribution of the as-obtained samples was further analyzed using software ImageJ as shown in Fig. S3.† Mm shows a particle distribution range from 50 to 150 nm. M0 was formed with bigger particles in the range of 100–200 nm owing to the higher hydrothermal temperature. Aluminum doped o-LiMnO2 samples exhibit a broad range of particle sizes, which increased with an increase of aluminum content in doped o-LiMnO2. The micromorphologies and particle size were further characterized by TEM as shown in Fig. S4.† After aluminum doping, the particle size slightly increased with an increase in the content of aluminum in o-LiMnO2 likely due to that adding AlCl3 changed the complex state of Mn2+ for the formation of Mn2+ complexes of chlorides, such as [MnCl3]−, [MnCl4]2−, and [MnCl6]4−. As for the aluminum doped o-LiMnO2 powder, the particles had remarkable difference in size, but similar micromorphologies were observed (Fig. 2 and S4†). The influence mechanism of AlCl3 on the micromorphology and particle size of o-LiMnO2 needs to be further studied in future.
Fig. 3 illustrates the FTIR spectra of M0, Mm, M3, M6, M9, and M12. Most of the bands in the low wave-number region of 400–800 cm−1 are attributed to the vibrations of MnO6 octahedra, and they are main fingerprints of o-LiMnO2 and LiMn2O4.25,26 The dominant absorption peaks for pure-phased o-LiMnO2 (M0) at 487 and 633 cm−1 were assigned to the asymmetry (νas) and symmetry stretching modes (νs) of Mn–O,4 respectively. A smaller feature at 439 cm−1 was likely owing to LiO6 octahedra.27,28 Absorption peak at 1636 cm−1 was assigned to the adsorbed water molecules. As for LiMn2O4, the high frequency bands of the FTIR spectra located at 516 and 632 cm−1 are attributed to the asymmetric stretching modes of the MnO6 group.26,28,29 Doping Al affected the absorption bands for the symmetry stretching of o-LiMnO2, and red shifts occurred from 633 cm−1 for M0 to 623, 603, 613, and 617 cm−1 for M3, M6, M9, and M12, respectively. The shift for the absorption peak in FTIR spectra is usually associated the change of interatomic distance in crystal structures, and the similar change was observed in high-frequency components in the band of MO6 vibration around 600 cm−1 when Ni was substituted for cobalt in LiCoO2.30
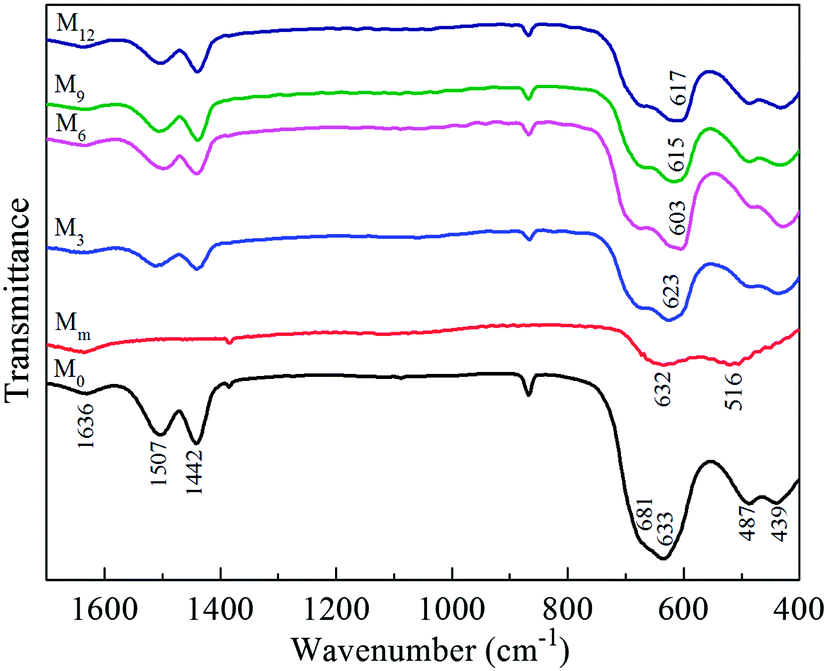 | ||
| Fig. 3 FTIR spectra of M0, Mm, M3, M6, M9, and M12. | ||
Table 1 shows cell parameters obtained by Rietveld structure refinement, and specific surface area (SSA) for M0, Mm, M3, M6, M9, and M12. As the content of doped Al in o-LiMnO2 increasing, parameter a decreased, while b increased. Moreover, parameter c was first slightly decreased and then increased, and cell volume slightly shrinked with increasing the content of doped aluminum due to that Al3+ ionic radius (0.0535 nm) is smaller than that of Mn3+ (0.0645 nm).5,31 The most significant decrease along a axis occurred after substitution, which would possibly improve the electrochemical stability due to that the Jahn–Teller distortion of the [Mn3+O6] octahedra induces an elongation along the a direction.5
| Samples | a (nm) | b (nm) | c (nm) | Cell volume (nm3) | Rwp (%) | SSA (m2 g−1) | Al/Mn molar ratio (%) |
|---|---|---|---|---|---|---|---|
| M0 | 0.4577 | 0.5751 | 0.2811 | 0.07398 | 12.6 | 9.1 | 0 |
| Mm | — | — | — | — | — | 21.3 | — |
| M3 | 0.4569 | 0.5756 | 0.2811 | 0.07392 | 13.5 | 9.7 | 0.34 |
| M6 | 0.4561 | 0.5759 | 0.2810 | 0.07383 | 13.6 | 10.2 | 0.58 |
| M9 | 0.4548 | 0.5764 | 0.2813 | 0.07373 | 14.7 | 10.6 | 0.91 |
| M12 | 0.4542 | 0.5764 | 0.2812 | 0.07362 | 13.5 | 13.5 | 1.22 |
It should be pointed out that these experiments have been repeated more than three times for that sufficient active materials should be supplied for the characterization of electrochemical performance. The as-prepared powder samples were characterized by XRD and FTIR each time, and same results were obtained. The SEM images also showed the uniform morphologies, which further suggested that the pure products were synthesized. The composition of Al doped o-LiMnO2 was also analyzed by Varian AAS 240FS atomic absorption spectrometer (Varian, Australia), besides the ICP-AES as mentioned above. That was to say, the composition of Al doped o-LiMnO2 was confirmed by two analysis techniques, further suggesting that the experiments were repeatable.
3.3. The electrochemical performance of o-LiMnO2
Fig. 4 shows discharge specific capacity and cyclic stability of M0, M3, M6, M9, M12, and Mm at a current density of 100 mA g−1. M0 had a relatively low initial discharge specific capacity of 76 mA h g−1, and increased to about 139 mA h g−1 after 25 cycles. The cyclic capacity was kept stable, and discharge specific capacity was about 124 mA h g−1 after 100 cycles. Among the as-obtained samples, Mm showed the largest discharge specific capacity. The initial discharge capacity of Mm was 139 mA h g−1, and increased to 171 mA h g−1 after 25 cycles, and retained about 144 mA h g−1 after 100 cycles. As reported, a mixture of LiMnO2 and Li2MnO3 with mass ratio of 1.40:1 exhibited the best electrochemical performance.32 In this work, the mixture of o-LiMnO2 and LiMn2O4 with o-LiMnO2/LiMn2O4 mass ratio about 2.45:1 exhibited excellent electrochemical performance.
 | ||
| Fig. 4 Discharge specific capacity vs. cycle number at the current density of 100 mA g−1 for M0, M3, M6, M9, M12, and Mm after heat-treatment at 110 °C for 12 h. | ||
Doping aluminum improved the electrochemical performance of o-LiMnO2 as displayed in Fig. 4. The discharge capacity increased at the initial few cycles and then kept steady after 25 cycles. The increase of discharge capacity in the first few cycles was likely due to the electrochemical activation of cathode materials and the improvement of lithium ion diffusion channels in active materials, resulting in higher lithium utilization during initial cycling stage. The cyclic capacity of doped o-LiMnO2 was first increased and then decreased with an increase in the content of aluminum. The initial discharge capacity of M6 was 82 mA h g−1, and kept steady at about 160 mA h g−1 after 25 cycles, and slightly decreased to 156 mA h g−1 after 100 cycles. The as-obtained o-LiMnO2 samples exhibited better electrochemical performance than those synthesized by other methods.5,7,33
Intermediate products in charge–discharge processes were studied using XRD after different cycles. As illustrated in Fig. 5a, a mixed phase of o-LiMnO2 and LiMn2O4 was formed after charge–discharge test of the first cycle. o-LiMnO2 was almost completely transformed into LiMn2O4 after five cycles, and a mixture of LiMn2O4, monoclinic LiMnO2 (m-LiMnO2, JCPDS: 87-1255) and γ-MnO2 was formed after 100 cycles. The similar results were obtained for the aluminum doped o-LiMnO2 sample of M6 after 100 cycles as shown in Fig. 5b. Li2Mn2O4 (JCPDS: 84-1523) was also formed in this process. As reported, o-LiMnO2 was converted to other manganese oxides, such as LixMn2O4,7,33,34 which was then gradually transformed into m-LiMnO2 and MnO2.35 In this work, similar intermediate products were also observed.
 | ||
| Fig. 5 XRD patterns of intermediate products after different cycles of charge–discharge test for M0 (a), and 100 cycles of charge–discharge test for M0 and M6 (b). | ||
Electrochemical impedance spectroscopy was collected to analyze the change trend of electrical conductivity and ionic migration rate. The semicircle at the high frequency region was related to the solid electrolyte interface film of the newly assembled cell. The curve at low frequency region can be explained as the diffusion-controlled process in the electrolytes. Fig. 6 shows the typical families of Nyquist plots obtained from electrodes of M0, Mm, M3, M6, M9, and M12 and measured using 3.15 V of open circuit voltage at 25 °C before charge–discharge test. The particle size, morphologies and specific surface area of the above samples were similar as shown in Fig. 2, S3,† and Table 1, and the same electrochemical reaction mode R(QR)WC was used to compare their reaction impedance (Rct) and lithium ion diffusion rates in this work.36 As shown in Table 2, Rct of Mm was higher than that of M0. It was found that doping aluminum improved conductivity and the corresponding Rct was decreased. A Warburg type element in the low frequency region corresponded to solid-state diffusion of lithium ions and a steep line at the lower frequencies. Diffusion rate of lithium ions in solid phase could be reflected by the linear slope in the low frequency region, and the Zw values for all the samples were compared as shown in Table 2. As for M0, M3, M6, M9, and M12, the diffusion rate of lithium ions increased with a decrease in the cell volume of Al doped o-LiMnO2.
 | ||
| Fig. 6 Electrochemical impedance spectra of M0, M3, M6, M9, M12, and Mm as Nyquist plots measured at 25 °C before charge–discharge test. | ||
| Samples | M0 | Mm | M3 | M6 | M9 | M12 |
|---|---|---|---|---|---|---|
| Rct (Ω) | 229.4 | 297.9 | 176.1 | 145.0 | 252.5 | 203.0 |
| Error (%) | 1.246 | 0.935 | 0.779 | 0.913 | 1.357 | 0.982 |
| Zw (S s−1/2) | 0.011 | 0.009 | 0.015 | 0.015 | 0.007 | 0.009 |
| Error (%) | 5.387 | 3.685 | 3.663 | 3.559 | 5.111 | 3.173 |
4. Discussion
4.1. The influence on o-LiMnO2 formation process
Hydrothermal reactions have been widely conducted to synthesize o-LiMnO2 from different low-valent manganese oxide precursors including Mn3O4, Mn2O3 and MnOOH, whose micro-morphologies could possibly be preserved during the transformation of target products.3,10,14,17,20,24 In the present work, Mn3O4 was found to be one of the intermediate products in the formation process of o-LiMnO2. When the concentrations of MnCl2, LiOH, and EDTA were controlled as 0.1, 0.6, and 0.1 mol L−1, respectively, Mn3O4 was first formed, and then oxidized to Li2MnO3 and birnessite-type manganese oxides with increasing the concentration of NaClO at 120 °C (Fig. 1a). The formation of layered birnessite was attributed to the high concentration of Na+, which participated in the reaction and intercalated into the interlayer to support the layered structure. When hydrothermal temperature was increased to 150 °C, the content of Li2MnO3 in solid products increased with increasing the concentration of NaClO (Fig. 1b). Li2MnO3 was formed and transformed into LiMnO2 at a higher hydrothermal temperature.15,21 Birnessite was not formed likely due to the formation of Li2MnO3 and LiMn2O4 at 150 °C.21 These results suggested that birnessite could be used as precursor to prepare nano-sized Li2MnO3, LiMn2O4 and LiMnO2 with various morphologies because the morphologies and particle size of birnessite could be controlled easily as reported in our previous work.37 The transformation of LiMnO2 was a complicated multi-step process, and influencing factors included hydrothermal temperature, LiOH concentration, the additives of organics and cation, etc.Hydrothermal temperature plays an important role in the formation of LiMnO2. Different temperatures were needed when Mn3O4, Mn2O3 and MnOOH worked as precursors. For example, LiMnO2 samples were hydrothermally synthesized using Mn2O3 precursor at 150 °C,20 160 °C (ref. 10, 14 and 24) and 170 °C.17 When MnOOH was used instead, the hydrothermal reaction was conducted at 200 °C.3 In the case of Mn3O4 used as a precursor, hydrothermal treatment was performed with high concentration of LiOH at 170 °C for 4 days.38 Hydrothermal temperature was somewhat higher when Mn3O4 was used likely due to its lower reaction activity than that of Mn2O3, and oxidant was needed to prepare o-LiMnO2. In this work, pure-phased o-LiMnO2 was formed by adding oxidant NaClO at 180 °C for 24 h. Hydrothermal temperature should be elevated to synthesize the target product of o-LiMnO2 possibly due to the further redox reactions between organics and manganese oxides, such as birnessite, Li2MnO3 and LiMn2O4.39
In order to save raw materials and manufacturing cost, the dosage of LiOH was concerned in the preparation process of LiMnO2. Only Mn3O4 was formed when LiOH of low concentration (≤0.2 mol L−1) was used, and a mixture of Mn3O4 and LiMnO2 was formed when LiOH was 0.4 mol L−1. Pure-phased target product was formed when 0.6 mol L−1 LiOH was used, and crystallinity was increased when 0.8 mol L−1 LiOH was used instead (Fig. 1d). LiOH was reacted with Mn3O4 and Mn2O3 to form o-LiMnO2, and high concentration reactant facilitated this transformation process.17,24,38 High concentration of LiOH was usually supplied to fabricate o-LiMnO2 when low-valent manganese oxides were used as precursor for hydrothermal reaction. It was possible due to that water molecules were produced during the formation of o-LiMnO2, which reduced the formation rate of the o-LiMnO2 phase and increased the reaction time,17 particularly for the mass transport of Li+ in the pores of manganese oxides during the hydrothermal process. As for the one-step synthesis of LiMnO2, a mixture of LiMnO2 and Li2MnO3 was formed when LiOH/MnSO4 molar ratio was less than 4:1.21 Although Li/Mn molar ratio was increased to 30, the final product was a o-LiMnO2 crystalline phase with trace amounts of Li2MnO3,15 and the mixture was also observed as intermediate product in this work (Fig. 1a and b). The rapid generation of manganese oxides was unfavorable to the formation of target product due to that big crystal particle would inhibit the further reaction. As reported, LiMnO2 crystal grain would not be formed when hydrothermal temperature was too high.24 High concentration of Li+ facilitated the formation of o-LiMnO2 mostly due to an increase in Li+ mobility, which accelerated its reaction with Mn(III/II) source to form lithium manganese oxides, and was also beneficial to the formation of a layered structure. In the present work, Li/Mn molar ratio could be controlled as 6:1, which was lower than those as reported.3,15,24 Low concentration of Li+ was performed to reduce cost, and complexation reaction resulted in a slow crystallization process and decreased the negative influence of low mass transfer rate of Li+ on the formation of o-LiMnO2. When EDTA was not added to the reaction system, pure phased LiMnO2 was not formed, and a mixed phase of o-LiMnO2, Mn3O4, and Li2MnO3 was generated instead (Fig. S1†). The formation rate of manganese oxides would be remarkably decreased due to the complexation reaction of EDTA and Mn2+ before hydrothermal reaction. As reported in our previous work, rapid transformation from Mn(OH)2 precipitate to Mn3O4 occurred in air.40 However, Mn3O4 was not formed in alkali solution after adding EDTA into the hydrothermal system in the present work. The formation rate of manganese oxides would be remarkably decreased due to the formation of the Mn2+ complexes of EDTA before hydrothermal reaction. The formation of complexes by adding organics tetrabutylammonium bromide and tetraoctylammonium bromide into MnSO4 solution could prevent its rapid reaction with KMnO4 to form cryptomelane-type manganese oxides with different degrees of crystallinity.39 LiMnO2 was formed with Li/Mn molar ratio as low as 1.05 when Mn2O3 precursor was used in miscible solvents with a low reaction rate.17 In order to further reduce cost, some cheaper complexant would be used to substitute EDTA in future work.
The addition of AlCl3 consumed OH− to form AlO2−, and also affected the oxidation capacity of NaClO in strong alkaline solution systems.22,23 The preparation of doped o-LiMnO2 by one-step hydrothermal synthesis was seldom reported, which was likely due to the precipitation reaction of metal cations and hydroxide ions. In this work, soluble AlO2− was formed using AlCl3 in LiOH solution of high concentration. In order to adjust the alkalinity and oxidation capacity of NaClO, the concentrations of LiOH and NaClO were slightly increased when AlCl3 concentration was increased. LiOH concentrations were controlled as 0.6, 0.6, 0.6, 0.6, and 0.8 mol L−1, and NaClO concentrations were controlled as 0.1, 0.1, 0.11, 0.12, and 0.12 mol L−1, when Al/Mn molar ratios in reaction system were controlled as 0, 0.05, 0.10, 0.15, and 0.20, respectively. When the concentrations of LiOH and NaClO were not adjusted accordingly, a mixture of Mn3O4 and o-LiMnO2 with a small amount of LiMn2O4 was formed (figure not given). It should be pointed out that Al/Mn molar percent ratios in o-LiMnO2 phase were only 0.34, 0.58, 0.91, and 1.22 when Al/Mn molar ratios in reaction system were controlled as 0.05:1, 0.10:1, 0.15:1, and 0.20:1, respectively. The formation of anion AlO2− did not well facilitate the formation of doped LiMnO2 with high content of Al3+ ions. The detailed reaction processes and influence mechanisms are currently underway.
4.2. The effect on o-LiMnO2 electrochemical performance
Chemical composition, crystal structure, crystallinity and cell parameters possibly affected the electrochemical performance of active electrode materials. The cyclic voltammetric behavior of M0 and Mm was studied after two cycles of charge–discharge activation. As shown in Fig. 7, oxidation/reduction current peaks A/A′ (3.9 V) and B/B′ (4.1 V) were associated with the reversible deinsertion/insertion processes of lithium ion between LiMn2O4 and MnO2, and a pair of peaks C/C′ (3.2 V/2.7 V) corresponded to the insertion/extraction of lithium between cubic LiMn2O4 and tetragonal Li2Mn2O4,5,41 and these intermediate products could be determined (Fig. 5). More than 50% Jahn–Teller ions (Mn3+) presented in Li2Mn2O4 participated in the transformation process of cubic LiMn2O4 to tetragonal Li2Mn2O4, and the phase transformation results in the volume shrinkage of unit cell that imparts a high degree a stress in grains. Grain fracture may occur with the repeating insertion/extraction of Li+ in this process, which finally results in the capacity loss.9,41 The reduction current peak intensity of Mm was stronger than that of M0 likely due to the participation of LiMn2O4 in Mm, which worked as an intermediate product after a few charge–discharge cycles (Fig. 5). The discharge capacity of Mm was higher than that of M0 because the former needed not to be activated in the initial stage (Fig. 4). Small particle size and large specific surface area facilitate the high electrochemical performance of LiMnO2 and LiMn2O4 cathode materials.13,42 It was noted that the specific surface area of Mm was about 21.3 m2 g−1, two times larger than that of M0 (9.1 m2 g−1), and it may lead to a better electrochemical performance. As a fact, the as-obtained o-LiMnO2 would be oxidized and transformed into LiMn2O4 through heat-treatment at 300–600 °C in air for 2 h (Fig. S5†). LiMn2O4, M600, from the transformation of o-LiMnO2 using heat treatment at 600 °C with specific surface area about 12.6 m2 g−1, exhibited an initial discharge capacity of 134 mA h g−1, and kept steady at about 120 mA h g−1 after 20 cycles, and decreased to 117 mAh g−1 after 100 cycles (Fig. S6†). The decrease of electrochemical performance further indicated the influence of specific surface area. Specific surface area, particle size, and theoretical specific capacity all affect the electrochemical lithium storage performance. Mixing o-LiMnO2 also improved the electrochemical performance of LiMn2O4 in the present work. Therefore, forming a mixed phase of LiMn2O4 and o-LiMnO2 would improve the electrochemical performance of single o-LiMnO2 and LiMn2O4, which was another highlight of this work. | ||
| Fig. 7 Cyclic voltammograms of M0 and Mm in 1.0 mol L−1 LiClO4 +EC + DMC + EMC with equal volume within potential range of 2.0–4.3 V (vs. Li/Li+) with a scan rate of 0.1 mV s−1. | ||
The influence of cell parameters on the electrochemical performance of LiMnO2 was further analyzed by discharge–charge profiles at a current density of 100 mA g−1. A remarkable discharge voltage plateau at 3.3–2.4 V was observed for pure-phased M0 (Fig. 8). Plateau at 3.3–2.4 V was owing to the discharge of orthorhombic LiMnO2 or tetragonal Li2Mn2O4.3,4 A new voltage plateau at 4.3–3.6 V was formed and kept stable after 20 cycles, likely due to the formation of spinel LiMn2O4, which was further transformed into tetragonal Li2Mn2O4 (Fig. 5), and LixMn2O4 (0 < x < 2) was also could be formed.4,7,20,35,41 The discharge capacity increased with an increase in the cyclic number during the charge–discharge test, and kept stable after 20 cycles likely due to the activation process.3 After 100 cycles, the discharge voltage at 4.3–3.6 V was remarkably lowered for M0 and Mm possibly due to the disproportionation of Li2Mn2O4 to Mn2+ and MnO2, resulting in capacity fade.35,41,43 However, there is no obvious change for the discharge plateau of M6 (Fig. 8c), which was attributed to that aluminum doping affected the crystal lattice and electrochemical performance of LiMnO2.5 The Jahn–Teller distortion of the [Mn3+O6] octahedra induces an elongation along the a direction.5 However, parameter a decreased with an increase in the content of doped Al in LiMnO2 (Table 1). The distorted axial Mn3+–O bond length of 0.229 nm is greater than the typical Al3+–O bond length (0.19 nm) in octahedral coordination,5 and the most significant changes due to substitution were expected to occur along a axis. These changes inhibited the shrinkage distortion during charge–discharge process, and excellent cyclic stability was achieved.4,5,44 In this work, appropriate content of doped aluminum with Al/Mn molar percent ratio about 0.58 exhibited the best electrochemical performance. It should be pointed out that the appropriate decrease in cell volume with compression along a axis and stretch along b axis facilitated the cyclic stability of o-LiMnO2 by Al doping due to the shrinkage of cell volume for the formation of LiMn2O4 during the charge–discharge process.31 However, an increase in cell volume facilitated the electrochemical stability of LiMn2O4 owing to the expansion of cell volume for the formation of Li2Mn2O4 during the charge–discharge process.44,45 Aluminum doping decreases Jahn–Teller distortion and improves the cyclic stability due to that the phase transformation from o-LiMnO2 to LiMn2O4 occurs in the charge–discharge test. In this work, although LiMn2O4 was formed as an intermediate product during the charge–discharge test, the discharge capacity of o-LiMnO2 was about 160 mA h g−1, which was much higher than that of LiMn2O4.4,5,7–9
 | ||
| Fig. 8 Discharge–recharge profiles of M0 (a), Mm (b), and M6 (c) for different cycles at a current density of 100 mA g−1. | ||
During the charge–discharge processes, lithium ions migrate out of the lattice along c axis, and oxygen position does not change with Li+ extraction, resulting in the formation of vacant octahedral sites.43,46 Subsequently, half of the manganese ions migrate statistically into the vacant octahedral sites along b axis, and the migration of metal ions is accompanied by a slight shift for oxygen atoms to the ideal cubic closest packing positions with cubic symmetry.9,46,47 From the results of FTIR (Fig. 3) and Rietveld refinement (Table 1), it could be concluded that the bond energy of Mn–O towards the equatorial plane of MnO6 octahedron was lowest in M6, which facilitated the migration of manganese ions into the vacant octahedral sites.46,47 The transformation of o-LiMnO2 to spinel LiMn2O4 easily occurred in the initial stage of charge–discharge test (Fig. 5a). To a certain degree, electrochemical reaction impedance in the initial stage positively correlated with the difficulty of phase change. In this work, M6 had the lowest reaction impedance before charge–discharge test (Fig. 6, Table 2). Phase transformation easily occurred in the electrochemical process, and exhibited stable electrochemical lithium storage performance after activation of a few cycles.
As for the charge processes of M0, pure-phased LiMnO2, a short charging voltage plateau at about 3.15 V was observed at the first cycle. The similar results were also reported in the literature.5,7,14 The presence of the short charge plateau was possibly due to the activation of o-LiMnO2 and the formation of LiMn2O4 in this process. As seen from the multi-cycle charge curves of M0 and M6, voltage plateau at about 3.15 V was extended due to the increase of the content of LiMn2O4 formed in charge–discharge test.9 As for Mm, this charge plateau was more obvious after charge–discharge activation of five cycles for the high content of LiMn2O4 in cathode materials (Fig. 8b). These results were consistent with the cyclic voltammograms as shown in Fig. 7. The formation of LiMn2O4 could be further confirmed by the XRD analysis of electrode materials as illustrated in Fig. 5 after charge–discharge test of the first cycle. To further improve the electrochemical cyclic stability of o-LiMnO2, the phase transition from layered to spinel structure might be remarkably retarded by doping other metal ions, such as Ni.19 This hydrothermal method also provides the possibility for the preparation of other metal doped o-LiMnO2.
Decreasing reaction impedance (Rct) may effectively improve the electrochemical performance of o-LiMnO2 and LiMn2O4 cathode materials. As seen in Fig. 6, the Rct values of the as-obtained samples were greater than 200 Ω. In order to improve the electrochemical performance, carbon materials, such as carbon nanotube and graphene, modified o-LiMnO2 might be directly synthesized using this hydrothermal system, and this study is currently underway.
5. Conclusions
Pure-phased, LiMn2O4-mixed, and aluminum-doped o-LiMnO2 cathode materials of rechargeable lithium batteries with high discharge capacity and excellent cyclic stability have been successfully fabricated using Mn(II) salt by a facile one-step hydrothermal treatment at 180 °C for 24 h. The molar ratio of Li+/Mn2+ can be controlled as low as 6, and the complexation reaction of EDTA and Mn2+ facilitates the formation of o-LiMnO2. Al/Mn molar percent ratio in aluminum-doped LiMnO2 is in the range of 0 to 1.22 when AlCl3/MnCl2 molar ratio is controlled from 0 to 20% in reaction system. LiOH and NaClO concentration should be slightly increased to obtain single-phased aluminum-doped o-LiMnO2 when Al/Mn molar ratio increased in hydrothermal system. Mixing LiMn2O4 and doping aluminum improve the electrochemical lithium storage capacity and cyclic stability of o-LiMnO2. Aluminum doped LiMnO2 with Al/Mn molar percent ratio of 0.58 shows the best electrochemical performance. Pure-phased o-LiMnO2, a mixture of o-LiMnO2 and LiMn2O4 (LiMnO2/LiMn2O4 mass ratio = 2.45:1), and aluminum doped LiMnO2 (Al/Mn molar ratio = 0.58%) exhibits the initial discharge capacity of 76.0, 139.1 and 81.8 mA h g−1, and cycling capacity of 124.1, 143.7 and 155.8 mA h g−1 after 100 cycles, respectively. This preparation method and the study on the electrochemical properties widen the potential application of pure-phased and doped o-LiMnO2 in the field of rechargeable lithium-ion battery.
Acknowledgements
The authors thank the National Natural Science Foundation of China (Grant nos: 41171375 and 20807019), the Program for New Century Excellent Talents in University of China (no. NCET-12-0862), the Young Outstanding Talent Foundation of Hubei Province of China (no. 2012FFA031), and the Fundamental Research Funds for the Central Universities (Program no.: 2013PY029, 2013PY030, 2011PY015, 2009SC007, 2012SC31 and 2013QC016) for financial support. The authors also gratefully acknowledge Dr Wenfeng Tan at Huazhong Agricultural University and Dr Xiaoqing Qiu at Fuzhou University for useful suggestions.References
- M. Armand and J.-M. Tarascon, Nature, 2008, 451, 652–657 CrossRef CAS PubMed
.
- H. Nishide and K. Oyaizu, Science, 2008, 319, 737–738 CrossRef CAS PubMed
- X. L. Xiao, L. Wang, D. S. Wang, X. M. He, Q. Peng and Y. D. Li, Nano Res., 2009, 2, 923–930 CrossRef CAS
- C. Liu, J. M. Nan, X. X. Zuo, X. Xiao and D. Shu, Int. J. Electrochem. Sci., 2012, 7, 7152–7164 CAS
- J. B. Cook, C. Kim, L. P. Xu and J. Cabana, J. Electrochem. Soc., 2013, 160, A46–A52 CrossRef CAS PubMed
- J. B. Goodenough and Y. Kim, Chem. Mater., 2010, 2, 587–603 CrossRef
- P. G. Bruce, A. R. Armstrong and R. L. Gitzendanner, J. Mater. Chem., 1999, 9, 193–198 RSC
- J. Cho, Y. J. Kim, T.-J. Kim and B. Park, Chem. Mater., 2001, 13, 18–20 CrossRef CAS
- Y.-I. Jang, B. Y. Huang, H. F. Wang, D. R. Sadoway and Y.-M. Chiang, J. Electrochem. Soc., 1999, 146, 3217–3223 CrossRef CAS PubMed
- H. Xu, J. Sun and L. Gao, Ionics, 2013, 19, 63–69 CrossRef CAS PubMed
- Z. P. Guo, S. Zhong, G. X. Wang, H. K. Liu and S. X. Dou, J. Alloys Compd., 2003, 348, 231–235 CrossRef CAS
- G. Ceder and S. K. Mishra, Electrochem. Solid-State Lett., 1999, 2, 550–552 CrossRef CAS PubMed
- Z. P. Guo, K. Konstantinov, G. X. Wang, H. K. Liu and S. X. Dou, J. Power Sources, 2003, 119–121, 221–225 CrossRef CAS
- H. M. Ji, G. Yang, X. W. Miao and A. Q. Hong, Electrochim. Acta, 2010, 55, 3392–3397 CrossRef CAS PubMed
- J. L. Xie, X. Huang, Z. B. Zhu and J. H. Dai, Ceram. Int., 2011, 37, 419–421 CrossRef CAS PubMed
- R. I. Walton, Chem. Soc. Rev., 2002, 31, 230–238 RSC
- Y. He, Q. Feng, S. Q. Zhang, Q. L. Zou, X. L. Wu and X. J. Yang, ACS Sustainable Chem. Eng., 2013, 1, 570–573 CrossRef CAS
- Z. P. Guo, G. X. Wang, H. K. Liu and S. X. Dou, Solid State Ionics, 2002, 148, 359–366 CrossRef CAS
- K. S. Park, M. H. Cho, S. H. Park, K. S. Nahm, Y. K. Sun, Y. S. Lee and M. Yoshio, Electrochim. Acta, 2002, 47, 2937–2942 CrossRef CAS
- Z. Su, Z. W. Lu, X. P. Gao, P. W. Shen, X. J. Liu and J. Q. Wang, J. Power Sources, 2009, 189, 411–415 CrossRef CAS PubMed
- X. K. Huang, Q. S. Zhang, H. T. Chang, J. L. Gan, H. J. Yue and Y. Yang, J. Electrochem. Soc., 2009, 156, A162–A168 CrossRef CAS PubMed
- G. H. Qiu, J. Wang, W. Zhao, X. H. Feng, W. F. Tan, Q. Zhang and F. Liu, Chin. J. Chem., 2010, 28, 2301–2307 CrossRef CAS
- H. Yin, F. Liu, X. H. Chen, X. H. Feng, W. F. Tan and G. H. Qiu, Microporous Mesoporous Mater., 2012, 153, 115–123 CrossRef CAS PubMed
- Q. Liu, Y. X. Li, Z. L. Hu, D. L. Mao, C. K. Chang and F. Q. Huang, Electrochim. Acta, 2008, 53, 7298–7302 CrossRef CAS PubMed
- R. Chitrakar, K. Sakane, A. Umeno, S. Kasaishi, N. Takagi and K. Ooi, J. Solid State Chem., 2002, 169, 66–74 CrossRef CAS
- Y. M. Hon, S. P. Lin, K. Z. Fung and M. H. Hon, J. Eur. Ceram. Soc., 2002, 22, 653–660 CrossRef CAS
- L. A. Riley, S. V. Atta, A. S. Cavanagh, Y. F. Yan, S. M. George, P. Liu, A. C. Dillon and S.-H. Lee, J. Power Sources, 2011, 196, 3317–3324 CrossRef CAS PubMed
- S. Chitra, P. Kalyani, T. Mohan, R. Gangadharan, B. Yebka, S. Castro-Garcia, M. Massot, C. Julien and M. Eddrief, J. Electroceram., 1999, 3, 433–441 CrossRef CAS
- C. Wu, Z. X. Wang, F. Wu, L. Q. Chen and X. J. Huang, Solid State Ionics, 2001, 144, 277–285 CrossRef CAS
- D. Ostrovskii, F. Ronci, B. Scrosati and P. Jacobsson, J. Power Sources, 2001, 94, 183–188 CrossRef CAS
- W.-H. Ryu, J.-Y. Eom, R.-Z. Yin, D.-W. Han, W.-K. Kim and H.-S. Kwon, J. Mater. Chem., 2011, 21, 15337–15342 RSC
- G. Yang, H. M. Ji, P. Gao, A. Q. Hong, H. R. Ding, S. Roy, J. Pinto and X. F. Jiang, J. Electrochem. Soc., 2011, 158, A1071–A1078 CrossRef CAS PubMed
- Y.-J. Gu, Y.-B. Chen, H.-K. Wu, Y.-M. Wang, L. Chen, M. Wang, X.-W. Huang, H. Zheng, X.-B. Liu, Ch. Lu and Y. Hu, Energy Materials, 2009, 4, 40–43 CrossRef CAS PubMed
- C.-H. Lu and H.-C. Wang, J. Eur. Ceram. Soc., 2004, 24, 717–726 CrossRef CAS
- J. Cho, T.-J. Kim and B. Park, J. Electrochem. Soc., 2002, 149, A288–A292 CrossRef CAS PubMed
- L. L. Xiong, Y. L. Xu, C. Zheng, Z. W. Zhang and J. B. Li, J. Solid State Electrochem., 2011, 15, 1263–1269 CrossRef CAS PubMed
- H. J. Cui, G. H. Qiu, X. H. Feng, W. F. Tan and F. Liu, Clays Clay Miner., 2009, 57, 715–724 CrossRef CAS
- S.-T. Myung, S. Komaba and N. Kumagai, Electrochim. Acta, 2002, 47, 3287–3295 CrossRef CAS
- G. H. Qiu, H. Huang, S. Dharmarathna, E. Benbow, L. Stafford and S. L. Suib, Chem. Mater., 2011, 23, 3892–3901 CrossRef CAS
- Q. H. Qiu, Q. Li, Y. Yu, X. H. Feng, W. F. Tan and F. Liu, J. Soils Sediments, 2011, 11, 1323–1333 CrossRef PubMed
- S. B. Tang, M. O. Lai and L. Lu, J. Power Sources, 2007, 164, 372–378 CrossRef CAS PubMed
- Y. C. Chen, K. Xie, Y. Pan and C. M. Zheng, J. Power Sources, 2011, 196, 6493–6497 CrossRef CAS PubMed
- J. Cho and M. M. Thackeray, J. Electrochem. Soc., 1999, 146, 3577–3581 CrossRef CAS PubMed
- Y. Shin and A. Manthiram, Chem. Mater., 2003, 15, 2954–2961 CrossRef CAS
- Y. Shin and A. Manthiram, J. Electrochem. Soc., 2004, 151, A204–A208 CrossRef CAS PubMed
- W. P. Tang, H. Kanoh and K. Ooi, J. Solid State Chem., 1999, 142, 19–28 CrossRef CAS
- J. Akimoto, Y. Takahashi, Y. Gotoh, K. Kawaguchi, K. Dokko and I. Uchida, Chem. Mater., 2003, 15, 2984–2990 CrossRef CAS
Footnote |
| † Electronic supplementary information (ESI) available. This includes the effect of EDTA on product composition, the preparation of Al doped o-LiMnO2, the micromorphology, particle size distributions of the as-obtained pure and Al doped o-LiMnO2, the heat treatment of as-obtained o-LiMnO2 in air, and the electrochemical performance of the as-obtained o-LiMnO2 and LiMn2O4. See DOI: 10.1039/c3ra47932c |
| This journal is © The Royal Society of Chemistry 2014 |