In situ synthesis of protein-resistant poly(oligo(ethylene glycol)methacrylate) films in capillary for protein separation
Rong Huang†
a,
Abdul Rahim Ferhan†b,
Longhua Guo*a,
Bin Qiua,
Zhenyu Lina,
Dong-Hwan Kim*b and
Guonan Chena
aMinistry of Education Key Laboratory of Analysis and Detection Technology for Food Safety, Department of Chemistry, Fuzhou University, Fuzhou, 350002, China. E-mail: guolh@fzu.edu.cn
bSchool of Chemical and Biomedical Engineering, Nanyang Technological University, 637457, Singapore. E-mail: dhkim@ntu.edu.sg
First published on 9th December 2013
Abstract
We report a method to modify a silica capillary with poly(oligo(ethylene glycol)methacrylate) (POEGMA) and its performance for protein separation. We optimized the grafting density and thickness of the POEGMA film and investigated the effect of running buffer pH, ionic strength, separation voltage, and sample injection time. The POEGMA-coated capillary was successfully utilized for the separation of six model proteins. Under optimized conditions, the resolution was found to be much better than a bare capillary, and even better than a widely used, commercially available PEG-modified capillary.
Introduction
Protein separation represents the most critical aspect of separation techniques. Capillary electrophoresis (CE), in particular, has become one of the most effective and widely used methods for protein separation in the last twenty years. Several advantages of CE include high efficiency and capacity, high sensitivity, quick turnaround time and low sample volume requirement.1–4 However, the interaction (e.g., hydrophobic, electrostatic interactions) between proteins and the capillary wall5,6 leads to the non-specific adsorption of proteins onto the capillary wall. This kind of non-specific binding severely degrades capillary electrophoretic performance, resulting in sample loss, peak broadening, poor resolution, unstable electroosmotic flow (EOF), and long migration times.7,8 To make CE a more practical technique suitable for protein analysis, various attempts have been made to eliminate this protein adsorption and to stabilize EOF, e.g. the use of extreme pH,9,10 high ionic strength11,12 and the introduction of zwitterionic additives.13,14 However, these approaches have the tendency to cause protein denaturation. Surface modification of the capillary wall is by far the most efficient and commonly used approach.15,16 Ideally, the modification should allow for the separation of a mixture of acidic and basic proteins without significant non-specific adsorption to the wall. Covalent attachment of a polymer utility to a capillary for protein separation was first demonstrated by Hjertén in 1985.17 Over the years, various capillary coatings for peptide and protein analysis have been reported and summarized in several reviews.18–20Various materials have been studied to eliminate nonspecific adhesion of proteins. Among these materials, poly(ethylene glycol) (PEG) and its derivatives are the most distinguish ones, which exhibit low toxicity, little antigenicity and/or immunogenicity, and an strong ability to prevent protein adsorption. Many derivatives of PEG, such as PEG methyl ether methacrylate (PEGMA), are well known to be amongst the most desirable and effective polymeric molecules for the reduction of non-specific protein adsorption.21–23 However, there are still drawbacks associated with PEG and its derivatives, such as a narrow pH application range, poor repeatability, and attachment instability. The polymer molecules are most often coated to the capillary wall via physical adsorption (the so-called dynamic coating). Although dynamic coating is relatively simple, the coated polymer layer is unstable at high pH and is easily to be rinsed away. More hydrophobic polymers such as PDMA form very stable coating due to excellent adsorptive property but are more likely to interact with hydrophobic patches of proteins during separation, reducing separation efficiency and repeatability.24
Recently, Chilkoti and co-workers25–27 presented a route to create protein resistant surfaces by growing poly(oligo(ethylene glycol)methacrylate) (POEGMA) brushes from a glass surface through surface-initiated atomic transfer radical polymerization (SI-ATRP). These brushes exhibit similar surface properties to self-assembled monolayers containing ethylene glycol moieties. More importantly, they provide mechanically and chemically robust protein resistant surfaces that can reduce nonspecific adsorption of proteins from complex mixtures, such as blood, sera and plasma. Recently, POEGMA-based polymer brush has shown great potential in biosensing applications owing to its ability to produce large signal-to-noise ratio, achieved not only through the minimization of nonspecific binding but also through maximization of specific binding of target to the biosensing interface.26,28–35 More interestingly, capture moeties such as antibodies could be conveniently physically immobilized on the brush without compromising its detection performance.26,33 Our work found that there exist a non-linear yet predictable relationship between the density of physically immobilized capture antibodies and the thickness of the brush.33 We also incorporated gold nanoparticles into POEGMA brush31,32 and found that when gold nanoparticle-incorporated POEGMA was used for lead detection from serum, POEGMA still retained its non-fouling property.32 Despite the predominance of chromatographic approaches for protein separation, hitherto, there is still no attention paid to the use of POEGMA polymer brushes for preventing nonspecific binding problems in chromatography.
In this contribution, we demonstrate a relatively straightforward methodology for growing POEGMA brushes via SI-ATRP on the interior of fused-silica capillaries as well as the first application of surface-grown POEGMA brushes in capillary electrophoretic protein separation. We expect POEGMA brush grafted from the surface to significantly minimize, if not eliminate, the adventitious protein adsorption in chromatographic processes, and eventually produce an ultra-selective protein separation platform.
Materials and methods
Materials
Ethanol (EtOH), 3-aminopropyl triethoxysilane (APTES), 3-mercaptopropyl trimethoxysilane (MPTES), bromoisobutyryl bromide, triethylamine, 2,2′-bipyridyl, copper(I) bromide and poly(ethylene glycol) methacrylate (average Mn 500) were all purchased from Sigma Aldrich. Methanol (MeOH) and dichloromethane (DCM) were purchased from Fisher Scientific. Cytochrome C (Cyt C), lysozyme (Lyz), ribonuclease A (RNAse A), porcine hemoglobin (PHb), muscle hemoglobin (MHb), Bovine Serum Albumin (BSA), were all purchased from Sigma. The bare fused-silica capillaries were obtained from Yongnian Optic Fiber Plant (China), with effective/total length of 32/42 cm, 75 μm i.d. 375 μm o.d. The commercially available, PEG coated capillary was purchased from Sepax Technologies Inc. (China) with effective/total length of 42 cm, 75 μm i.d.Synthesis of POEGMA in capillary tubes
The capillary tube was first inserted into a syringe needle and fixed tightly using epoxy. This syringe needle-capillary fixture was maintained throughout the entire preparation procedure until synthesis is completed. Between every step, it was exchangeably screwed onto different syringes containing the different solutions before securing it to the syringe pump. All the following steps, except drying and baking, were conducted with the fixture attached to the syringe, which was fastened to the pump. In every surface modification step involving a fixed flow rate, the tube was first quickly primed at a flow rate of 1 mL min−1 up to 0.05 mL before maintaining a constant flow rate of 10 μL min−1. For all washing steps, the tube was primed at a flow rate of 1 mL min−1 up to ∼0.5 mL. The pressurized washing solution/solvent was then left to bleed.Firstly, diluted H2SO4 (1 mol L−1) was made to flow through the tube for 2 h. It was then thoroughly washed in DI water overnight followed by EtOH for 30 min. Next, a solution of varying volume-to-volume ratios of APTES-to-MPTES (1![[thin space (1/6-em)]](https://www.rsc.org/images/entities/char_2009.gif) :
:![[thin space (1/6-em)]](https://www.rsc.org/images/entities/char_2009.gif) 9, 5
9, 5![[thin space (1/6-em)]](https://www.rsc.org/images/entities/char_2009.gif) :
:![[thin space (1/6-em)]](https://www.rsc.org/images/entities/char_2009.gif) 5 and 10
5 and 10![[thin space (1/6-em)]](https://www.rsc.org/images/entities/char_2009.gif) :
:![[thin space (1/6-em)]](https://www.rsc.org/images/entities/char_2009.gif) 0%) in EtOH was made to flow through the tube for 3 h. It was then thoroughly washed in EtOH overnight, before drying in the oven at 60 °C for 1 h followed by baking at 120 °C for 2 h. After that, a solution of 41 μL triethylamine and 37 μL bromoisobutyryl bromide in 6 mL DCM was made to flow through the tube for 1 h. It was then washed in DCM for 2 h followed by MeOH overnight.
0%) in EtOH was made to flow through the tube for 3 h. It was then thoroughly washed in EtOH overnight, before drying in the oven at 60 °C for 1 h followed by baking at 120 °C for 2 h. After that, a solution of 41 μL triethylamine and 37 μL bromoisobutyryl bromide in 6 mL DCM was made to flow through the tube for 1 h. It was then washed in DCM for 2 h followed by MeOH overnight.
Meanwhile, the POEGMA synthesis solution was prepared as follows. First 1.5 mL DI water was added to 6 mL MeOH in a round bottom flask and the solvent mixture was bubbled in N2 for 10 min. Then, 180 mg 2,2′-bipyridyl, 75 mg copper(I) bromide and 4.3 mL of OEGMA monomer were quickly added to the mixture while stirring. The resulting brown solution was bubbled in N2 for another 15 min before immediately retrieved using the syringe.
Finally, the POEGMA synthesis solution was made to flow through the tube for a specified duration (1, 6 and 12 h). During synthesis, the free end of the tube was immersed in MeOH, which was kept in N2 environment. The tube was then washed in MeOH for 1 h followed by N2-saturated DI water for another 1 h. The capillary tube containing N2-saturated DI water was eventually cut off from the syringe needle. Both its ends were wrapped in parafilm and stored before usage.
EOF measurement
The EOF mobilities in bare and POEGMA-coated capillaries were used for the estimation of EOF. All EOF measurements were carried out at 25 °C and were determined with dimethylsulfoxide as a neutral marker at pH 3.5–9.0 according to the protocol developed by Williams and Vigh.36 Each EOF value were taken three replicates.Instrumentation and analytical conditions for protein separation
Protein separation was performed on a Beckman P/ACE MDQ capillary electrophoresis system (Beckman Coulter Instruments, USA) equipped with a UV-vis detector (214 nm) at 25 °C.Results and discussion
Non-fouling property of POEGMA-modified capillary
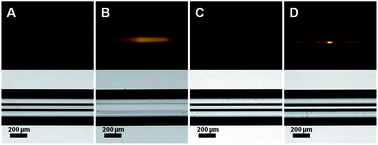
The non-fouling property of POEGMA-modified capillaries with brush grown for 12 h was first checked by flowing through a solution of AlexaFluor 546-tagged Anti-Human Immunoglobulin G (IgG) followed by a brief incubation period of 1 h. The same procedure was also performed on a pristine capillary to serve as a control. After rinsing with washing buffer, we observed no fluorescence on the wall of the POEGMA-modified capillary, implying the significantly low level of non-specific protein adsorption. In contrast, fluorescence was clearly observed in pristine capillary (Fig. 1). This indicates that (1) the inner wall of a capillary tube can be conveniently modified with POEGMA via in situ synthesis and (2) a POEGMA grown on the inner wall of a capillary tube maintain its non-fouling property.Suppression of EOF in coated capillaries at different pH buffer
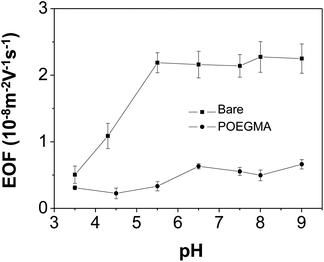
The EOF was used as an indirect measure to demonstrate the completeness of the coating. Fig. 2 compares the EOF mobilities in bare capillary with those in POEGMA-coated capillaries at different pH values (3.5–9.0). The results show that only slight EOF increase is observed for the coated capillaries. As comparison, the EOF in bare capillary shows a strong and typical dependence on pH. These results indicated that POEGMA coating is stable under low pH and nearly completely covered the capillary surface.36Performance of POEGMA-modified capillary for protein separation
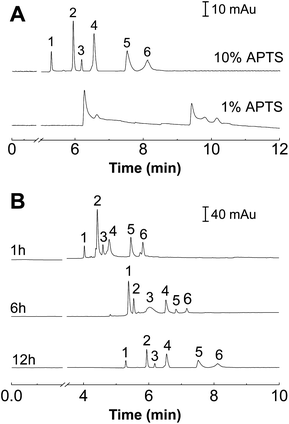
The suppression of EOF by uncharged silane reagents and covalently bound polymers has been mainly attributed to the following three effects:19 (i) the modification of the potential by elimination of ionizable Si–OH groups on the fused-silica surface; (ii) “shielding” of remaining charged groups on the surface by polymer or substituents on the alkylsilane reagent; and (iii) the increase in viscosity in the layer of coating near the wall. The contribution of all of these effects for EOF suppression should be related to both the thickness and density of the covalently bounded layer. To investigate the interactions between the proteins and the polymer coatings, the separation of model proteins in capillaries coated with different graft density and the brush thickness of the POEGMA film was systematically evaluated for subsequent applications in the proteins separation.Since POEGMA is grafted from the substrate via a bromo-initiator group obtained through the esterification of bromoisobutyryl bromide with an amino group, reducing the amount of amino groups present on the surface would lead to lower grafting densities. Therefore, we use MPTES, which is an alkylsilane variant to APTES, as a diluent. Unlike APTES, MPTES has a thiol group in place of the amino group. Different grafting densities of POEGMA were obtained by varying the ratio of APTES to MPTES. Using a synthesis time of 12 h, the POEGMA brushes with an increasing grafting density were grown from substrates pre-modified with 1% APTES + 9% MPTES and 10% APTES without MPTES. As shown in Fig. 3A, the increase in grafting density of the POEGMA resulted in an improvement in separation efficiency.
For the case of 1% APTES, the grafting density was not sufficient to ensure full coverage of POEGMA on the capillary tube. Therefore, the capillary wall does not possess good non-fouling properties. Thus the elution peaks of the six proteins merged together (Fig. 3A). We infer that the low POEGMA grafting density is not enough to completely cover the inner wall of the capillary. The uncovered (bare) capillary wall is positively charged in electrophoretic buffer so that it could seriously adsorb proteins. This kind of protein adsorption decreased with the increase of APTES concentration, and best separation performance was observed when the APTES concentration was 10%. More importantly, the relative high grafting density resulted in the extension of the polymer chains and the formation of a polymer brush configuration. The non-fouling properties of the polymer brush enabled the baseline separation of the six proteins (Fig. 3A).
The thickness of the polymer brush was controlled by the polymerization time. Different polymerization time was carried out during the capillary modification process. Fig. 3B shows the electropherograms of the separation of six proteins using POEGMA-modified capillaries with different polymerization time (1, 6 and 12 h). It is clear seen that better resolution was achieved with longer polymerization time, which indicated that better separation performance can be achieved with a longer polymer brush.
Optimization of separation conditions for CE
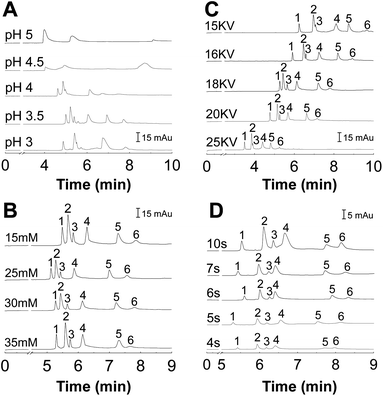
It is important to study the effect of pH on protein separation because pH strongly affects the net charge of proteins and thus affect the interaction between proteins and the capillary wall.37 In addition, pH can affect the EOF as well as the migration time. A series of experiments were carried out using 10 mmol L−1 phosphate buffers of different pH to find an optimum pH. As shown in Fig. 4A, the resolution of peaks was improved with increasing the pH from 3.0 to 3.5. When the pH value was higher than 3.5, the peaks of some proteins merged together and some proteins even cannot migrate to the detection cell. Under pH 3.5, the proteins can be baseline separated and the peak was sharp without tailing.It is well-known that the concentration of buffers plays an important role in the thermodynamics of protein adsorption.11 While high buffer concentration can eliminate the protein absorption to some degree and reduce the EOF, it causes high currents and high Joule heating due to the high conductivity of the salt solution.38 The influence of PBS concentration on resolutions of the six proteins was studied with PBS concentration ranging from 15 mmol L−1 to 35 mmol L−1. As shown in Fig. 4B, the results demonstrate that the resolutions increase with PBS concentration in the range of 10 to 30 mmol L−1. However, there is little increase in resolutions when the PBS concentration was above 30 mmol L−1. On the other hand, the analysis was frequently interrupted because of the excessive Joule effect (working current was around 100 μA) when PBS concentration was equal or higher than 35 mmol L−1. Thus, 30 mmol L−1 was selected as the optimal PBS concentration.
The influence of separation voltage on the analysis of the standard proteins was also studied by varying the voltage from 15 to 25 kV (Fig. 4C). Experimental results indicated that increasing the separation voltage would get shorter overall migration time of the analysts in the capillary; however, amplified baseline noise and lowered resolution of peaks were observed. On the other hand, if the separation voltage was too low, it would increase the analysis time and consequently cause peak broadening. After optimization, the best voltage was 18 kV, at which the six proteins were perfectly baseline separated.
The sample injection volume was optimized by varying the injection time at a fixed inlet pressure of 0.5 psi. Generally, high sample injection volume could improve the detection sensitivity but result in poor resolution due to peak broadening. Fig. 4D shows that peak resolution decreased with an increase in injection time. The proteins were effectively separated at the injection time of 5 s. Hence, the injection time of 5 s was used to obtain a reliable separation.
Comparison of protein separations in bare, POEGMA-coated and commercialized capillaries
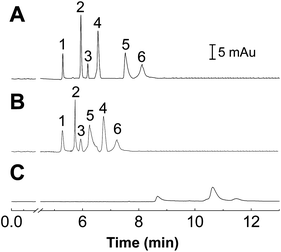
The performance of the POEGMA-coated capillary for protein separation was compared with a bare fused silica capillary and a commercially available, PEG coated capillary (Fig. 5). Both the POEGMA-coated and commercial capillaries can distinctively separate the six proteins. In contrast, only three weak peaks were observed in the bare capillary (Fig. 5C), indicating that a high degree of nonspecific adsorption occurred in the bare capillary, and the six proteins can't be completely separated in this capillary.It should be noted that, though both the commercial capillary and the proposed POEGMA modified capillary can separate the six proteins completely, the migration time of proteins in the two capillaries were different, suggesting that different mechanisms were responsible for the protein separation in the two capillaries. The difference probably comes from the variation in molecular structure between PEG and POEGMA. As POEGMA presents multiple PEG groups as side chains extending from a methacrylate backbone, there would be additional forms of interactions between the POEGMA film and the proteins during the separation process. In addition, the calculated separation efficiencies for lysozyme were as high as 394![[thin space (1/6-em)]](https://www.rsc.org/images/entities/char_2009.gif) 743 plates per m, which was even better than those PEG-modified capillaries reported in previous literatures.39,40
743 plates per m, which was even better than those PEG-modified capillaries reported in previous literatures.39,40
Stability and reproducibility of the POEGMA coating
The POEGMA-coated capillary was evaluated by the analysis of six proteins with regard to migration times and the separation efficiency. The relative standard deviation (RSD) is shown in Table 1. The results showed that the POEGMA coated capillary could be used for an extended period of time without a noticeable loss in separation efficiency. After the capillary has been used for 3 months, it can still give successful separation of proteins (data not shown).| Compounds | Run no. 1–3 | Run no. 300–303 | ||
|---|---|---|---|---|
| RSD of migration time (%) | RSD of theoretical plate number (%) | RSD of migration time (%) | RSD of theoretical plate number (%) | |
| Cyt C | 0.39 | 0.52 | 1.52 | 1.72 |
| Lyz | 0.45 | 0.37 | 1.41 | 1.91 |
| RNAse A | 0.65 | 0.31 | 1.93 | 2.16 |
| PHb | 0.34 | 0.64 | 1.23 | 1.73 |
| MHb | 0.54 | 0.78 | 1.77 | 1.47 |
| BSA | 0.61 | 0.83 | 2.25 | 2.12 |
Quantitative analysis of standard proteins using POEGMA-coated capillaries
The quantitative analysis of protein was investigated by the separation of six mode proteins using the POEGMA-coated capillary under the optimal conditions. The calibration curves were constructed by plotting electrophoretic response (i.e. peak area) against concentration. The limit-of-detection (LOD) was determined as the concentration of a standard solution which generates an electrophoretic response three times greater than baseline (S/N = 3). As shown in Table 2, the LOD were in the range of 0.8–2 μg mL−1. The linear ranges had linear coefficients (R2) between 0.9926 and 0.9993, indicating a high degree of correlation between concentration and peak area.| Compounds | Linear range (mg mL−1) | Regression Line | LOD (mg mL−1) | ||
|---|---|---|---|---|---|
| Slope | Intercept | R2 | |||
| Cyt C | 0.0024–0.15 | 573![[thin space (1/6-em)]](https://www.rsc.org/images/entities/char_2009.gif) 351 351 |
235.26 | 0.9993 | 0.0008 |
| Lyz | 0.005–0.3125 | 926![[thin space (1/6-em)]](https://www.rsc.org/images/entities/char_2009.gif) 732 732 |
−3197.5 | 0.9991 | 0.0015 |
| RNAse A | 0.005–0.3125 | 59![[thin space (1/6-em)]](https://www.rsc.org/images/entities/char_2009.gif) 474 474 |
445.61 | 0.9941 | 0.0019 |
| PHb | 0.0036–0.225 | 2![[thin space (1/6-em)]](https://www.rsc.org/images/entities/char_2009.gif) 000 000![[thin space (1/6-em)]](https://www.rsc.org/images/entities/char_2009.gif) 000 000 |
10![[thin space (1/6-em)]](https://www.rsc.org/images/entities/char_2009.gif) 399 399 |
0.9926 | 0.0012 |
| MHb | 0.006–0.375 | 732![[thin space (1/6-em)]](https://www.rsc.org/images/entities/char_2009.gif) 722 722 |
−4273.6 | 0.9989 | 0.002 |
| BSA | 0.0048–0.3 | 489![[thin space (1/6-em)]](https://www.rsc.org/images/entities/char_2009.gif) 264 264 |
−2451.8 | 0.9993 | 0.0016 |
Conclusions
In conclusion, we have synthesized protein-resistant POEGMA film in the inner wall of fused silica capillary. The POEGMA-coated capillary was successfully utilized for the CE separation of six mode proteins. The separation performance (e.g. resolution and separation efficiency) of the proposed POEGMA-coated capillary was better than a commercial capillary, with the additional potential application to be developed for affinity capillary electrophoresis due to the easy chemistry of the POEGMA. In view of the low nonspecific binding, high binding capacities for target biomolecules, and excellent physical and chemical stability of the POEGMA film, we believe the successful introduction of POEGMA to CE separation of proteins will provide new and useful platforms for proteomics study.Acknowledgements
The authors gratefully acknowledge the financial support of the National Natural Science Foundation of China (21277025, 21205017, and 21275031), National Science Foundation of Fujian Province (2012J01036, 2011J01035), the Foundation of Fujian Educational Committee (JA12039, JA13024), and the Scientific Research Foundation for the Returned Overseas Chinese Scholars, State Education Ministry. DHK acknowledges the financial support of Ministry of Education of Singapore (MOE2012-T2-1-058).Notes and references
- L. Zhao, J. Zhou, H. Zhou, Q. Yang and P. Zhou, Electrophoresis, 2012, 33, 1703 CrossRef CAS PubMed.
- Z. Zhu, J. J. Lu and S. Liu, Anal. Chim. Acta, 2012, 709, 21 CrossRef CAS PubMed.
- L. Guo, F. Fu and G. Chen, Anal. Bioanal. Chem., 2011, 399, 3323 CrossRef CAS PubMed.
- L. Guo, H. Yang, B. Qiu, X. Xiao, L. Xue, D. Kim and G. Chen, Anal. Chem., 2009, 81, 9578 CrossRef CAS PubMed.
- A. Staub, S. Comte, S. Rudaz, J. L. Veuthey and J. Schappler, Electrophoresis, 2010, 31, 3326 CrossRef CAS.
- L. Guo, Y. Huang, Y. Kikutani, Y. Tanaka, T. Kitamori and D. H. Kim, Lab Chip, 2011, 11, 3299 RSC.
- M. R. Schure and A. M. Lenhoff, Anal. Chem., 1993, 65, 3024 CrossRef CAS.
- J. K. Towns and F. E. Regnier, Anal. Chem., 1992, 64, 2473 CrossRef CAS.
- R. M. McCormick, Anal. Chem., 1988, 60, 2322 CrossRef CAS.
- H. H. Lauer and D. McManigill, Anal. Chem., 1986, 58, 166 CrossRef CAS.
- J. S. Green and J. W. Jorgenson, J. Chromatogr. A, 1989, 478, 63 CAS.
- L. Guo, B. Qiu, L. Xue and G. Chen, Electrophoresis, 2009, 30, 2390 CrossRef CAS PubMed.
- M. M. Bushey and J. W. Jorgenson, J. Chromatogr., A, 1989, 480, 301 CrossRef CAS.
- L. Guo, B. Qiu, M. Chen and G. Chen, Electrophoresis, 2009, 30, 1355 CrossRef CAS PubMed.
- S. de Jong, N. Epelbaum, R. Liyanage and S. N. Krylov, Electrophoresis, 2012, 33, 2584 CrossRef CAS PubMed.
- R. Nehmé and C. Perrin, in Capillary Electrophoresis of Biomolecules, Springer, 2013, p. 191 Search PubMed.
- S. Hjerten, J. Chromatogr., A, 1985, 347, 191 CrossRef CAS.
- C. A. Lucy, A. M. MacDonald and M. D. Gulcev, J. Chromatogr., A, 2008, 1184, 81 CrossRef CAS PubMed.
- E. A. Doherty, R. J. Meagher, M. N. Albarghouthi and A. E. Barron, Electrophoresis, 2003, 24, 34 CrossRef CAS PubMed.
- J. Horvath and V. Dolnik, Electrophoresis, 2001, 22, 644 CrossRef CAS.
- J. K. Towns and F. E. Regnier, Anal. Chem., 1991, 63, 1126 CrossRef CAS.
- N.-P. Huang, J. Vörös, S. M. De Paul, M. Textor and N. D. Spencer, Langmuir, 2002, 18, 220 CrossRef CAS.
- S. K. Wiedmer, T. Andersson, M. Sündermann, M. L. Riekkola and H. Tenhu, J. Polym. Sci., Part B: Polym. Phys., 2007, 45, 2655 CrossRef CAS.
- M. N. Albarghouthi, T. M. Stein and A. E. Barron, Electrophoresis, 2003, 24, 1166 CrossRef CAS PubMed.
- H. Ma, J. Hyun, P. Stiller and A. Chilkoti, Adv. Mater., 2004, 16, 338 CrossRef CAS.
- A. Hucknall, D. H. Kim, S. Rangarajan, R. T. Hill, W. M. Reichert and A. Chilkoti, Adv. Mater., 2009, 21, 1968 CrossRef CAS.
- R. Ferris, A. Hucknall, B. S. Kwon, T. Chen, A. Chilkoti and S. Zauscher, Small, 2011, 7, 3032 CrossRef CAS PubMed.
- B. S. Lee, O. J. Yoon, W. K. Cho, N.-E. Lee, K. R. Yoon and I. S. Choi, J. Biomater. Sci., Polym. Ed., 2009, 20, 1579 CrossRef CAS PubMed.
- O. J. Y. Bong Soo Lee, W. K. Cho, N.-E. Lee, K. R. Yoon and I. S. Choi, J. Biomater. Sci., Polym. Ed., 2009, 20, 1579 CrossRef PubMed.
- J. E. Gautrot, B. Trappmann, F. Oceguera-Yanez, J. Connelly, X. He, F. M. Watt and W. T. Huck, Biomaterials, 2010, 31, 5030 CrossRef CAS PubMed.
- A. R. Ferhan and D.-H. Kim, J. Mater. Chem., 2012, 22, 1274 RSC.
- A. R. Ferhan, L. Guo, X. Zhou, P. Chen, S. Hong and D.-H. Kim, Anal. Chem., 2013, 85, 4094 CrossRef CAS PubMed.
- A. R. Ferhan and D.-H. Kim, RSC Adv., 2013, 3, 9785 RSC.
- J. Trmcic-Cvitas, E. Hasan, M. Ramstedt, X. Li, M. A. Cooper, C. Abell, W. T. Huck and J. E. Gautrot, Biomacromolecules, 2009, 10, 2885 CrossRef CAS PubMed.
- J. E. Gautrot, W. T. Huck, M. Welch and M. Ramstedt, ACS Appl. Mater. Interfaces, 2009, 2, 193 Search PubMed.
- B. A. Williams and G. Vigh, Anal. Chem., 1996, 68, 1174 CrossRef CAS PubMed.
- M. Bonoli, S. J. Varjo, S. K. Wiedmer and M.-L. Riekkola, J. Chromatogr., A, 2006, 1119, 163 CrossRef CAS PubMed.
- C. J. Evenhuis, R. M. Guijt, M. Macka, P. J. Marriott and P. R. Haddad, Electrophoresis, 2006, 27, 672 CrossRef CAS PubMed.
- R. J. Meagher, J. Seong, P. E. Laibinis and A. E. Barron, Electrophoresis, 2004, 25, 405 CrossRef CAS PubMed.
- J. Xu, L. Yang, Z. Luo and Y. Wang, Electrophoresis, 2010, 31, 1713 CrossRef CAS PubMed.
Footnote |
| † These authors contributed equally. |
| This journal is © The Royal Society of Chemistry 2014 |

