A dual-chamber reactor to assess the saccharification capability of the cellulytic microflora from straw waste

Cheng-Jiao Xuab, Guang-Li Cao*ac, Lei Zhaoa, Ai-Jie Wanga, Lin-Na Chena and Nan-Qi Ren*a
aState Key Laboratory of Urban Water Resource and Environment, School of Municipal and Environmental Engineering, Harbin Institute of Technology, P.O. Box 2614, 202 Haihe Road, Harbin 150090, China. E-mail: rnq@hit.edu.cn; Fax: +86-0451-86418180; Tel: +86-0451-86418180
bCollege of Resources and Environment, Northeast Agricultural University, Harbin 150030, China
cDepartment of Life Science and Technology, Harbin Institute of Technology, Harbin 150008, China

Received 22nd November 2013 , Accepted 27th January 2014

First published on 28th January 2014


Abstract

An enriched and serially diluted method was developed to screen efficient consortia to degrade straw for reducing sugar accumulation. The consortium MX with highest saccharification efficiency was selected. Then a dual-chamber reactor was designed to evaluate the saccharification capability of the screened target functional consortium.
Utilization of lignocellulosic material as feedstock for bioenergy production has aroused great interest in recent years.1 Lignocellulose derived saccharides, such as glucose, xylose, and cellobiose can be fermented into hydrogen, ethanol and other bioenergy products by microorganisms. However, the matrix hemicellulose and lignin structure envelops the cellulose, which results in low specific growth rates of the microorganisms and inhibits the cellulolytic activity. To make use of lignocellulosic biomass for biofuel production, efficient microorganisms/communities capable of effectively hydrolyzing cellulosic biomass for saccharides accumulation should be developed.

Lignocellulosic biomass can be hydrolyzed into reducing sugars by aerobic or anaerobic microorganisms. For aerobic microorganisms, filamentous fungi are preferred for commercial enzyme production, because the activities of enzymes are higher than those obtained from yeasts and bacteria.2–5 While some anaerobic bacteria like Clostridia also perform great potential in lignocellulose saccharification, because the cellulosomes, a multi-enzyme complex compound, which produced by these bacteria could provide synergy and close proximity of enzymes to substrate. The existence of cellulosomes could increase the saccharification efficiency and decrease the crystalline of the lignocellulose simultaneously.6–8 On the other hand, anaerobic saccharification can coupling with anaerobic fermentation process, which will be more conducive to maintain the anaerobic condition.

Compared with mesophilic condition, degradation of lignocellulosic biomass under thermophilic condition offers several potential advantages, such as higher substrate conversion, lower contamination risk, and higher process efficiency.9–12 As a result, thermophilic microorganisms or enzymes isolated from various environments, have huge potential in lignocellulosic biomass saccharification. Compared to pure cultures, mixed cultures are more suitable for hydrolysis of lignocellulosic feedstock, due to their better adaptation to environmental changes, wider carbon sources utilization spectra, and higher conversion rate.13,14 However, to obtain the consortium with the target function is still difficult. First, reducing sugar is hard to accumulate because of the expenditure of sugar-consuming bacteria. Second, the end-products produced during the saccharification process inhibit the activity of cellulases. The last and the most important is the low level of reducing sugar in the cellulose bioconversion system makes it difficult to identify the saccharification capacity of consortia. Therefore, accurate and sensitive detect strategy for lignocellulose saccharification should be explored.

This study in general aims to establish an efficient functional consortium for cellulose degradation and saccharides accumulation from rice straw. A serially dilution approach was applied to select the cellulolytic saccharification consortium. In order to assess the saccharification capability of the screened target functional consortium, a dual-chamber reactor was designed, in which the cellulolytic saccharification consortium and hydrogen-producing strain Thermoanaerobacterium thermosaccharolyticum W16 isolated by Ren et al. (2008, 2010)15,16 were inoculated separately, hence the saccharification ability of MX could be calculated based on the hydrogen produced by W16.

Different seed microflora sources, soil (FS), decay wood (XF), decay bark (FC), sub lacustrine decay branch (YH) in Yichun city, anaerobic composting in the suburb of Harbin city (MX), and hot spring sludge in Benxi city (BW) were used as sources of inoculum. The different seed microflora sources were continuously transferred into the rice straw medium until steady state was achieved. Table 1 summarizes the parameter values of enriched cultures from rice straw medium on different transfer times. It can be obtained from Table 1 that the fermentation products were mainly ethanol, short chain fatty acids such as acetate, propionate and butyrate accompanied with a little amount of H2. The values of VFAs, hydrogen production yield, and substrate degradation ratio fluctuated during the transfers. However, they became gradually stabilized as the transfer times increased up to the 14th generation, which suggested that microbial structure and the incorporated reaction pathway from the enriched microflora were tended to stable along with transfers. Consistent with other studies,17 the degradation rate of rice straw by the enriched culture was higher than the original. For example, when using the 12th generation enriched cultures as inoculum, the rice straw degradation increased by 198.5%, 236.2% and 176.7% for BW, MX, and XF, respectively. In other words, enriched cultures could enhance the cellulose digestion, which attributed to the acclimatization of the microflora to the cellulose during subculture. Among the tested seed samples, MX microflora performed better on straw degradation. After 16th generation, enriched MX microflora reached the maximum rice straw degradation with the level of 55.88%, which resulted in 2.36 times enhancement over the original. The high cellulytic activity of MX microflora may be due to its composition of microbial community, suggesting that the selection of seeds can dramatically affect the seed microbial community's ability to degrade substrate. The 16th generation enriched MX microflora showed the highest bioactivity on rice straw degradation and was therefore selected for further study.

Table 1 Fermentation parameters of different microflora during transfer cultures
Sample Generations EtOH (ml g−1 straw) VFAs (mg g−1 straw) H2 (ml g−1 straw) Degradation rate (%)
HAc HPr HBu HVa
FS Original 10.13 5.98 35.22 20.14 6.85 7.55 17.56
9th 18.83 12.22 69.4 33.06 11.94 11.44 38.83
12th 11.98 16.35 133 36.71 0.00 9.29 36.38
14th 16.92 19.98 135.9 19.76 0.36 7.15 35.99
16th 16.35 20.49 137.1 20.07 0.38 7.13 36.79
YH Original 12.15 47.34 50.71 24.78 30.65 0.21 14.53
9th 20.49 89.51 84.34 46.59 55.91 0.49 24.43
12th 89.51 36.36 38.94 49.67 3.48 0.73 30.46
14th 35.62 63.08 52.59 48.84 0.16 0.50 33.55
16th 36.36 62.01 53.36 48.42 0.00 0.43 34.23
FC Original 19.93 18.56 23.42 9.57 2.12 0.88 12.45
9th 62.01 42.40 63.75 25.05 4.29 1.98 39.86
12th 42.40 30.14 50.94 55.34 12.28 16.13 43.27
14th 31.12 99.28 47.77 24.78 0.09 16.79 47.63
16th 30.14 100.22 49.16 23.44 0.00 17.71 48.10
BW Original 18.12 10.99 17.87 12.33 0.79 4.66 15.64
9th 30.22 19.31 25.26 27.44 2.32 14.64 39.84
12th 19.31 45.61 43.47 41.62 3.16 19.60 42.29%
14th 44.77 43.39 49.53 45.88 0.00 16.33 45.07
16th 45.61 42.50 48.99 46.63 0.00 18.14 46.68
MX Original 14.86 6.88 31.43 25.12 0.00 5.45 16.62
9th 42.5 49.36 99.61 69.92 0.00 12.39 39.56
12th 49.36 52.54 94.56 25.50 0.00 5.31 48.24
14th 53.85 24.56 98.49 28.21 0.06 5.97 54.47
16th 52.54 23.40 97.76 27.05 0.00 5.92 55.88
XF Original 17.53 18.48 27.69 20.44 0.05 10.96 14.12
9th 23.4 27.94 72.11 39.56 0.00 11.21 23.24
12th 27.94 62.34 68.48 114.70 8.65 29.21 30.93
14th 54.05 59.37 84.02 115.16 0.00 36.88 38.69
16th 52.34 58.94 82.57 114.70 0.00 38.10 39.07


The enriched MX microflora was serially diluted to screen the microbial consortium that has the simplest biological structure and exhibits high capability of saccharide-accumulation. As shown in Table 2, the accumulation of reducing sugars reached the maximum of 0.0958 mg ml−1 at 10−6 dilution ratio from original MX mixed culture. Subsequently, the fermentation broth of 10−6 dilution was diluted again for the 2nd time from 10−3 to 10−9, the reducing sugar rapidly increased to the maximum of 0.1459 mg ml−1 at 10−6 dilution ratio for cultured 48 h, but decreased to 0.1198 mg ml−1 after 72 h culture. The result indicated that there must be sugar consumption strains in the consortium. In order to obtain stable and high efficient saccharification consortium, the 10−6 diluted culture was diluted for the 3rd time, and the result showed that the reducing sugar content increased to the highest value of 0.1501 mg ml−1 at 10−5 dilution ratio after 48 h fermentation, 72.93% higher than the control. Further prolonged the fermentation time to 72 h has little effect on sugars concentration. Apparently, after 3 times of gradient dilution, the consortium MX was considered with stable and higher saccharide-accumulation ability.

Table 2 Changes in the amount of reducing sugar from rice straw saccharification during 3 times dilution (mg ml−1)
Dilution 1st dilution from enriched microflora MX 2nd dilution from 1st 10−6 dilution 3rd dilution from 2nd 10−6 dilution
24 h 48 h 72 h 24 h 48 h 72 h 24 h 48 h 72 h
Original 0.0872 0.0868 0.0882 0.0868 0.0885 0.0875 0.0921 0.0868 0.0887
10−3 0.0919 0.0798 0.0737 0.1059 0.1076 0.1012 0.1008 0.1025 0.0995
10−4 0.0890 0.0871 0.0828 0.1047 0.1113 0.1079 0.1076 0.1008 0.0991
10−5 0.0923 0.0856 0.0774 0.0944 0.1025 0.0875 0.1059 0.1501 0.1446
10−6 0.0825 0.0635 0.0958 0.1178 0.1459 0.1198 0.1110 0.0991 0.0956
10−7 0.0837 0.0719 0.0854 0.0996 0.0838 0.0898 0.1133 0.1059 0.0894
10−8 0.0905 0.0841 0.0791 0.0986 0.0976 0.0934 0.1144 0.0956 0.0856
10−9 0.0934 0.0836 0.0823 0.0978 0.0983 0.0876 0.0959 0.1014 0.0955


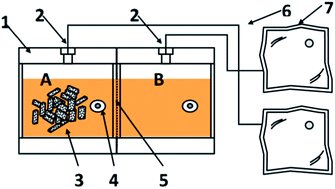
For construction of the regression equations reflecting the relationship between hydrogen production and sugars consumption, a dual-chamber reactor (as shown in Fig. 1) was designed for sugar accumulation by consortium and hydrogen-production by strain Thermoanaerobacterium thermosaccharolyticum W16 to determine the ability of saccharification. The two chambers were separated by 0.45 μm liquid phase microfiltration membrane, through which the reducing sugars could pass freely excluding bacteria. The screened saccharification consortium was inoculated into the sugar production chamber referred as chamber A and W16 was inoculated into hydrogen production chamber referred as chamber B. 0.30 g rice straw was added into chamber A as the sole carbon source of the whole reactor. Prior to evaluation of the saccharification for screened consortium, the regression curve equations for consortium and W16 with respect to the relationship between hydrogen production and consumed sugars were constructed, respectively. Afterwards, the hydrogen production produced by consortium and W16 from rice straw was substituted into the respective regression curve equations and calculated into sugars, this in turn reflect the saccharification ability from rice straw degradation. The cumulative hydrogen production and glucose consumption were recorded and fitted in a regression curve. The equations of YMX = −0.421X2 + 6.944X (R2 = 0.993) (Fig. 2) and YW16 = −0.008X2 + 1.196X (R2 = 0.953) (Fig. 3) were formed for consortium MX and W16, respectively. It can be seen from Fig. 2 that consortium MX consumed large quantity of reducing sugars, but produced low amount of hydrogen compared with W16 (Fig. 3). This suggested that low bioactivity of hydrogen-producing microorganisms presented in the consortium MX culture.


image file: c3ra46948d-f1.tif
Fig. 1 Schematic diagram of dual chamber reactor. (1) Dual-chamber reactor; (2) gas outlet; (3) straw segment; (4) sampling ports; (5) microfiltration membrane; (6) airway; (7) gasbags.

image file: c3ra46948d-f2.tif
Fig. 2 Regression curve equations fitted from cumulative hydrogen production and glucose consumption of MX.

image file: c3ra46948d-f3.tif
Fig. 3 Regression curve equations fitted from cumulative hydrogen production and glucose consumption of W16.

The hydrogen fermentation from consortium MX and strain W16 was shown in Fig. 4. It can be observed that the hydrogen production from W16 appeared two peaks, one was at about 20 h, and the other was at around 64 h. The reason for this phenomenon may be attributed to the difference in the sugar consumption rate and formation rate. Before 20 h fermentation, the utilization of reducing sugars increased gradually along with the saccharification of rice straw. As a consequence, the hydrogen production increased gradually. While after 20 h fermentation, the decomposition rate of rice straw for sugar accumulation was lower than the sugars consumption rate for hydrogen production, this in turn resulted in the delay of H2 production. Afterwards, the consumption of produced sugars from the saccharification of rice straw increased with fermentation time, which thereby brought about increasing in the hydrogen production. The maximum accumulated hydrogen production for W16 was 6.206 ± 0.057 ml at 64 h. While the hydrogen production for consortium MX occurred after 52 h, and showed a low level of 1.078 ± 0.021 ml up to 76 h. Based on the regression equations of consortium MX and strain W16, the amount of sugar consumed in chamber A was 0.4194 mmol glucose, and 0.4428 mmol glucose in chamber B (Fig. 5). So the total amount of reducing sugar produced by MX was 0.8622 mmol glucose, corresponding to 0.1552 g glucose. At the end of fermentation, the residue rice straw was 0.1464 g, implying 0.1592 g rice straw was degraded by consortium MX, which was close to the amount of reducing sugar produced (0.1552 g glucose). This result indicated this method can well predict the cellulolytic saccharification for consortium MX.


image file: c3ra46948d-f4.tif
Fig. 4 Hydrogen productions of W16 and MX in the dual-chamber reactor scheme.

image file: c3ra46948d-f5.tif
Fig. 5 Consumed sugars from rice straw saccharification calculated from cumulative hydrogen production.

In this study, a serially diluting method was applied to screen a functional consortium for straw degradation and reducing sugar accumulation. After 3 times gradient dilution acclimatization, the consortium MX at dilution of 10−5 was found to have the highest saccharification efficiency. A dual-chamber reactor including sugar-producing chamber and hydrogen-producing chamber was then designed to evaluate the capability of saccharification, in which the consortium MX and hydrogen-producing strain W16 were simultaneously inoculated into different chambers and cultured. Based on the hydrogen vs. glucose regression curve equations, the total amount of reducing sugar produced by MX was determined to be 0.1552 g glucose, almost equivalent to the loss of rice straw during saccharification.

Acknowledgements

This research was supported by National Natural Science Foundation of China (no. 51178140, no. 30870037, no. 51111140388, and no. 31100095), Academician Workstation Construction in Guangdong Province (2012B090500018), China Postdoctoral Science Foundation (20110491053), Heilongjiang Postdoctoral Science Foundation (LBH-Z11133), and State Key Laboratory of Urban Water Resource and Environment (Harbin Institute of Technology) (2014TS07).

Notes and references

  1. N. Q. Ren, A. J. Wang, G. L. Cao, J. F. Xu and L. F. Gao, Biotechnol. Adv., 2009, 27(6), 051–060 CrossRef PubMed.
  2. M. Jeya, Y. W. Zhang, I. W. Kim and J. K. Lee, Bioresour. Technol., 2009, 100, 5155–5161 CrossRef CAS PubMed.
  3. F. Xu, H. S. Ding and A. Tejirian, Enzyme Microb. Technol., 2009, 45, 203–209 CrossRef CAS PubMed.
  4. C. H. Kuo and C. K. Lee, Carbohydr. Polym., 2009, 77, 41–46 CrossRef CAS PubMed.
  5. Y. Sun and J. Y. Cheng, Bioresour. Technol., 2002, 83, 1–11 CrossRef CAS.
  6. E. Morag, S. Yaron, R. Lamed, R. Kenig, Y. Shoham and E. A. Bayer, J. Biotechnol., 1996, 51(3), 235–242 CrossRef CAS.
  7. R. Waeonukul, K. L. Kyu, K. Sakka and K. Ratanakhanokchai, J. Biosci. Bioeng., 2009, 107(6), 610–614 CrossRef CAS PubMed.
  8. M. Desvaux, Enzyme Microb. Technol., 2005, 37(4), 373–385 CrossRef CAS PubMed.
  9. J. H. Youn and H. S. Shin, Waste Manage. Res., 2005, 23(1), 32–38 CrossRef CAS PubMed.
  10. I. Valdez-Vazquez, E. Ríos-Leal, F. Esparza-García, F. Cecchi and H. M. Poggi-Varaldo, Int. J. Hydrogen Energy, 2005, 30(13–14), 1383–1391 CrossRef CAS PubMed.
  11. Y. Akutsu, Y. Y. Li, H. Harada and H. Q. Yu, Int. J. Hydrogen Energy, 2009, 34, 2558–2566 CrossRef CAS PubMed.
  12. G. Rastogi, A. Bhalla, A. Adhikari, K. M. Bischoff, S. R. Hughes, L. P. Christopher and R. K. Sani, Bioresour. Technol., 2010, 101, 8798–8806 CrossRef CAS PubMed.
  13. J. B. Liu, W. D. Wang, H. Y. Yang, X. F. Wang, L. J. Gao and Z. J. Cui, J. Environ. Sci., 2006, 18(6), 142–146 Search PubMed.
  14. N. Narisawa, S. Haruta, Z. J. Cui, M. Ishii and Y. Igarashi, J. Biosci. Bioeng., 2007, 104(5), 432–434 CrossRef CAS PubMed.
  15. N. Q. Ren, G. L. Cao, A. J. Wang, D. J. Lee, W. Q. Guo and Y. H. Zhu, Int. J. Hydrogen Energy, 2008, 33, 6124–6132 CrossRef CAS PubMed.
  16. N. Q. Ren, G. L. Cao, W. Q. Guo, A. J. Wang, Y. H. Zhu, B. F. Liu and J. F. Xu, Int. J. Hydrogen Energy, 2010, 35(7), 2708–2712 CrossRef CAS PubMed.
  17. C. Y. Lin and W. C. Hung, Int. J. Hydrogen Energy, 2008, 33, 3660–3667 CrossRef CAS PubMed.

Footnote

Electronic supplementary information (ESI) available. See DOI: 10.1039/c3ra46948d

This journal is © The Royal Society of Chemistry 2014