Bench-scale demonstration of CO2 capture with electrochemically-mediated amine regeneration

Michael C. Stern and T. Alan Hatton*
Department of Chemical Engineering, Massachusetts Institute of Technology, 77 Massachusetts Ave., 66-325, Cambridge, MA 02139, USA. E-mail: tahatton@mit.edu; Tel: +1 617 253-4588

Received 9th October 2013 , Accepted 27th November 2013

First published on 29th November 2013


Abstract

Electrochemically-Mediated Amine Regeneration (EMAR) is a new strategy for CO2 separations that uses industrially relevant amine sorbents in a nearly isothermal capture process. The electric nature of the EMAR system offers significant practical advantages in retrofit applications and for installation in non-power generating facilities. EMAR systems are based on an electrochemical copper cycle where desorption is facilitated by oxidation of a copper anode to generate cupric ions that displace CO2 from the polyamine sorbents. The CO2 capacity of the sorbent solution is regenerated through electroplating of the cupric ions onto a separate copper cathode. Results from a bench-scale system demonstrate the potential of the technology for efficient low-energy capture of CO2. The importance of current density and sorbent flow rate are measured. The work of capture increases linearly with current density. For flow rate, however, there is an optimum value of about 1 cm s−1 of superficial velocity through the device. Different electrode geometries and different electrolytes are also examined. At ambient pressure and temperature, which are far from the ideal operating conditions, CO2 can be captured for 100 kJ per mol−1 at a membrane current density of 50 A m−2. The Faradaic (current) efficiencies reach 80% under some conditions with only minimal optimization of the design and materials. This level of performance already meets or exceeds the performance of other electrochemical systems.

Introduction

With the increasing evidence of global warming and its correlation to anthropogenic carbon dioxide (CO2) emissions,1–3 organizations such as the Intergovernmental Panel on Climate Change and the National Research Council are strongly advocating reductions in carbon emissions.4–6 Currently, there exists 500 GW of coal-based electricity generating capacity under 10 years old; this represents over a third of the world's total coal-based capacity. Over the next two decades an additional 1000 GW of coal-based capacity will be installed.7,8 This surge in new coal-fired power plants necessitates development of post-combustion carbon capture technologies that can be added to new plants and retrofitted to existing plants. Thermal amine scrubbing, which is the current state-of-the-art technology,9 performs significantly worse in retrofit applications than in new power plants specifically designed with carbon capture capability.10 The decreased performance in retrofits is caused by the mismatch in steam availability between what can be easily accessed and what is needed for the capture plant.11

In addition to their role in carbon sequestration strategies, carbon capture technologies will be required over the coming decades for enhanced oil recovery as natural CO2 reservoirs are depleted.12 Carbon capture for use in photosynthetic biofuels or bio-derived electro-fuels may also create new CO2 markets.13,14 Finally, carbon capture from non-power generating industrial processes, such as cement, steel, and aluminum manufacture, which account for nearly 10 percent of global carbon emissions, is impractical with most technologies.15–17 These plants do not possess the same low pressure steam utilities available in power plants that are necessary to operate a thermal swing system.

Electrically driven, rather than steam driven, processes such as oxy-fuel, vacuum swing, and chemical looping are under development, and could offer better performance in retrofit and non-power plant applications.18–20 Since these systems do not require steam to operate, their efficiencies do not decline significantly when installed on existing plants. These technologies, however, are generally incapable of achieving the extremely high output purities of amine scrubbing systems. This may be a significant concern as even a small amount of nitrogen in the outlet stream can dramatically affect the supercritical fluid properties that are essential for transport and sequestration.21

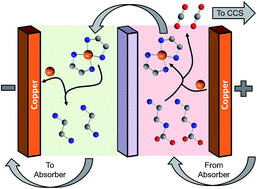
Electrochemically-Mediated Amine Regeneration (EMAR) is a new technology that has the potential to combine the high removal efficiencies of amine scrubbing, the logistical advantages of an electrical process, and the high efficiency of electrochemical system.22,23 The EMAR system uses a copper cycle to facilitate the desorption of CO2 from the amine sorbent. The cycle with ethylenediamine (EDA) sorbent and a schematic of the overall process are depicted in Fig. 1. EDA was chosen because it is an effective CO2 sorbent and possesses an even stronger affinity for cupric ions.24,25


image file: c3ra46774k-f1.tif
Fig. 1 (a) The chemical reactions of the EMAR cycle with EDA. (b) A schematic diagram of the EMAR process.22

The CO2 is first scrubbed from the flue gas in an absorber similar to those used in traditional thermal scrubbing systems. The CO2-saturated sorbent solution is then sent to the anode chamber of the EMAR system where a copper electrode is oxidized to form cupric ions. These ions complex with the EDA molecules and displace the CO2 from the amine binding sites, thereby causing the CO2 desorption from the solution. The gas/liquid mixture is then separated into a pure CO2 stream and the copper-saturated sorbent stream is directed to the cathode, where the cupric ions are electroplated onto a separate copper electrode, which regenerates the sorbent stream CO2 absorbing capacity.

The EMAR process has several substantial advantages over traditional thermal scrubbing systems. Because the powerful driving force for desorption is obtained through the generation of cupric ions, CO2 can be easily desorbed at pressure with no need for a sweep gas. This can alleviate over 50% of the downstream compression necessary for either sequestration or utilization of the CO2. The EMAR system should also be capable of removing over 90% of the absorbed CO2 in the desorption step, which is significantly better than the 50% removal achieved in a typical thermal scrubbing process.26 Higher CO2 removal from the loaded sorbent translates to lower sorbent flow rates and smaller absorbers. The absorbers can be smaller because the incoming sorbent is leaner, and therefore, has higher driving forces for CO2 absorption.27 For an EMAR system using EDA at the correct operating conditions, it was shown that 70% open-circuit efficiency should be achievable if operated at 75 °C.

Initial results from a proof-of-concept system demonstrated that CO2 could be generated at 42% Faradaic efficiency consistently for 7 hours.22 These experiments were done at a current density of 25 A m−2; other electrochemical technologies can often operate at current densities an order of magnitude greater. We believe a current density of 500 A m−2 for an industrial scale EMAR system will be high enough to keep the overall system size at or below the size of a current thermal scrubber but low enough to avoid significant kinetic overpotentials, which lower the overall system efficiency.

In this article, a more thorough experimental investigation of the bench-scale apparatus is presented that considers the effects of current density, flow rate, electrode geometry and chloride salts. Additionally, results are presented for the system stability during repeated polarization switches, where the polarity and solution flows between the electrodes of the device are switched. These polarity switches are necessary for long term operation to prevent significant copper buildup on the cathode and complete dissolution of the anode. The results are very encouraging despite the limitations of the initial bench-scale system, which include the inability to operate outside of ambient temperature and pressure conditions.

Experimental methods

Materials

Solutions were prepared with distilled and deionized 18 MΩ water (Milli-Q). All chemicals used were purchased from Sigma-Aldrich. The background electrolyte used was sodium nitrate (NaNO3, purity >99%). Cupric ions were added to solutions through the addition of copper nitrate semi(pentahydrate) (Cu(NO3)2, purity >98%) or copper chloride (CuCl2, purity >97%). The ethylenediamine was 99% purity.

System design

The bench-scale system was composed of the electrochemical EMAR cell, a dual-channel L/S Masterflex digital pump, a BK Precision 9110 variable power supply, and two three-neck flasks. One flask was used as the absorber and was agitated vigorously using a magnetic stir plate. The other flask was used as a flash tank to separate the pure CO2 gas phase from the liquid sorbent exiting the anode. The outlet of the flash tank first went to a digital flow meter that recorded the rate of CO2 generation and then to a gas chromatogram that also was used to determine the CO2 output. Flow meters were used to measure the inlet and outlet flow to and from the absorption flask, respectively, during operation. The voltage across the system during constant current operation was measured and recorded. A schematic diagram and a photograph of the system can be seen in Fig 2.
image file: c3ra46774k-f2.tif
Fig. 2 (a) Schematic diagram of the EMAR setup. (b) Photograph of the bench-scale EMAR setup with key elements labeled.

The electrochemical cell was a sandwich structure consisting of two aluminum chassis pieces, two copper electrodes, two gaskets, and a membrane. The aluminum piece acted as both a current collector and a rigid support to prevent any flexing of the device. The copper plates inside the aluminum chasses were alloy 101 ultra-high purity copper (>99.99% purity). Flow channels are created by cutting out a 20 cm × 5 cm rectangle in the 0.8 mm thick Teflon gaskets. The membrane layer consisted of three sheets of Celgard 3501 surfactant-coated microporous polypropylene. Pieces of cheesecloth were inserted in the flow channels to prevent the membrane from contacting the copper electrode. If the membrane and electrode were allowed to touch, the copper dendrites could grow through the membrane and short circuit the system.

When porous electrodes were used, the 0.8 mm Teflon gaskets were replaced with 3.2 mm silicone gaskets and the 3.2 mm thick porous electrode was placed in flow channel gap. Except for the results in the Porous Electrodes section, all experiments were performed with only the flat plate electrodes and the 0.8 mm Teflon gaskets.

Operating procedure

All experiments were operated under ambient temperature and pressure conditions. The solutions for experiments without porous electrodes contained 1 M EDA, 1 M NaNO3 and either 0.25 M Cu(NO3)2 or 0.25 M CuCl2. Approximately 300 mL of solution were recirculated through the system during an experiment. After the system was charged with a fresh EDA solution, CO2 was bubbled into the system overnight to saturate the amine solution completely. Solutions were used for approximately two weeks before there were replaced with a fresh solution. No deterioration in performance was noted due to the age of a solution.

Before the start of an experiment, both the absorber and gas/liquid separator flasks were purged with CO2. During operation of the system, the absorber was constantly saturated using a pure stream of CO2. Dilute CO2 streams were not used in the absorber because of physical solubility concerns. Because the physical solubility is proportional to CO2 partial pressure, operating the absorber and flash tank at different partial pressures would lead to a reduction in CO2 output, which is exacerbated at the ambient conditions under which these experiments were conducted.

The reduction in output is caused by the increase in physical CO2 solubility countering a significant fraction of the decrease in chemical CO2 solubility induced by the copper cycling in the EMAR cell. For full-size systems operating at elevated temperatures, the reduction in CO2 output would be less than 1% of the expected output in most cases.22

In the bench-scale system, the expected reduction in CO2 output due to physical solubility, QP, can be calculated as a function of the liquid flow rate fL, the partial pressure of CO2 entering the absorber, PF, and the partial pressure of CO2 in the anode, PA.

 
image file: c3ra46774k-t1.tif(1)

HCO2 is the Henry's Law coefficient,28 assumed to be near that for CO2 in pure water, and vm is the molar volume of the solution, which can also be approximated with the pure water value. eqn (1) shows that if the partial pressures in the absorber and anode were equal, there would be no loss of CO2 flow from the gas/liquid separator.

If, however, a 15% CO2 stream were used with a liquid flow rate of 20 mL min−1, the expected output would be reduced by 12.5 sccm, which is greater than the highest output generated with the proof-of-concept device. Therefore, the performance of the EMAR system would be overshadowed if the system were operated with dilute CO2 inlets. The short length of the device also contributed significantly to the physical solubility issues as there was insufficient residence time to allow for a substantial fraction of the of CO2 to release from the EDA–CO2 complexes.

While the bench-scale system operated at a maximum of 1 Amp, a full length system would operate at a current sufficient to achieve 90% desorption efficiency, εD; i.e., sufficient cupric ions would be generated in the anode to desorb 90% of the CO2 bound to the amines, assuming 100% saturation. The required full length system current, IF, can be defined as:

 
IF = DCEDAfL (2)

The required current for a full-sized system analogous to the bench-scale apparatus with 1 M EDA and a sorbent flow rate of 20 mL min−1 would be 29 Amps. At this current, the output reduction due to physical solubility would be less than 5% of the expected CO2 generation rate.

The expected rate of generation of CO2, QE, can be calculated as a function of the current, I, assuming each electron releases one molecule of CO2 from its chemical bond with EDA. This corresponds to the rate of generation in an ideal system of,

 
image file: c3ra46774k-t2.tif(3)

The Faradaic efficiency, εF, which defines the efficiency with which electrons release molecules of CO2, is calculated by dividing the observed rate of CO2 generation, QCO2, by the expected value.

 
image file: c3ra46774k-t3.tif(4)

The work of capture, WCO2, which is calculated in units of kJ mol−1, is calculated by dividing the electrical power requirement of the system, IV, by the observed rate of CO2 generation.

 
image file: c3ra46774k-t4.tif(5)

The RT/PA term is required to convert the volumetric measurement of CO2 generation to a molar flow rate. Note that V represents the applied voltage, not a volume. The efficiency cannot be calculated for the work of capture since the inlet gas stream into the absorber and the outlet from the flash tank are both pure CO2. Therefore, no thermodynamic work is being performed, and hence, the efficiency, with respect to work, would be zero.

Despite the zero efficiency, the work of capture results are useful and representative. In a larger system, the composition of the flue gas would not have a significant impact on the required work of capture provided that the sorbent leaving the absorber is almost fully saturated with CO2. Therefore, the work of capture of the small system with a 100% CO2 gas feed is a reasonable approximation of the work of capture of a large system with a more dilute flue gas.

Results and discussion

The resistances across the channels and membrane were measured using electrochemical impedance spectroscopy (EIS). The results are shown in the form of a Nyquist plot in Fig. 3. The measurements were taken with no gas or liquid flow through the system. The amplitude of the applied sinusoidal voltage waves was 25 mV and the waves were centered on the open-circuit potential. The frequency was varied from 10 kHz to 1 Hz. At high frequencies, the impedance approaches 0.6 Ohms (6 mΩ m−2), which represents the resistance of ion transport offered by the solution and membrane. This value also includes any contact resistances that may have existed within the system. At low frequencies the slope of the Nyquist plot approached 0.6, which is expected for a transport limited system.
image file: c3ra46774k-f3.tif
Fig. 3 Nyquist plot of EIS results for the flat-plate EMAR system with no flow. Solution was CO2-saturated with 1 M EDA, 0.25 M Cu(NO3)2, and 1 M NaNO3. Impedances are in units of Ohms.

Current density

Experiments with varying flow rates and current densities were performed to determine their effect on Faradaic efficiency and the work of capture, defined in eqn (4) and (5), respectively.

Fig. 4 shows results from an experiment where the current was altered every 45 minutes and the CO2 output was measured in two ways. The outlet gas from the flash tank was combined with a nitrogen sweep gas and sent to a GC for composition analysis. A volumetric flow meter (VFM) was also placed at the exit of the absorber, and the change in CO2 leaving the absorber was measured over time. Both methods yielded similar results, as would be expected from a mass balance on CO2 in the system. The liquid flow rate for this experiment was 20 mL min−1.


image file: c3ra46774k-f4.tif
Fig. 4 Measured CO2 flow rates (a) and voltage (b) of the bench-scale system at different currents over time. The CO2 output was measured with a GC, and the change in CO2 absorbance was measured with a volumetric flow meter (VFM).

Based on the VFM measurements, the Faradaic efficiency and work of capture were calculated for each current. The results are shown in Fig. 5.


image file: c3ra46774k-f5.tif
Fig. 5 Faradaic efficiency (a) and work of CO2 capture (b) of the bench-scale system based on the data from Fig. 4.

The Faradaic efficiency declined linearly with increasing current, though only from 70% at 0.2 A to 60% at 0.6 A. The work of capture increased linearly from 41 kJ mol−1 at 0.2 A to 133 kJ mol−1 at 0.6 A. These results show that the EMAR system, with very little optimization, can capture CO2 for 100 kJ mol−1 at a current density of 50 A m−2, which is an order of magnitude below the target current density for an industrial EMAR system.

Flow rate

Further experiments were run at different flow rates and current densities. The results can be seen in Fig. 6, where the Faradaic efficiency and work of capture are plotted as functions of CO2 capture rate to highlight the relationship between energy consumption and CO2 flux.
image file: c3ra46774k-f6.tif
Fig. 6 Faradaic efficiency (a) and work of CO2 capture (b) as a function of CO2 generation rate for 1 M EDA, 0.25 M Cu(NO3)2, 1 M NaNO3 systems.

Fig. 6 shows that at flow rates from 5 to 30 mL min−1, the Faradaic efficiencies remained above 60% and even exceeded 80% at very low CO2 fluxes and moderate flow rates. The lower flow rates showed exceptionally good performance at low currents, but their performance declined significantly as the current was increased. At the higher flow rates, a nearly constant Faradaic efficiency was observed.

Experiments conducted at 20 mL min−1 showed the lowest required work of CO2 capture for a given CO2 flux. The work of capture for lower flow rates increased more rapidly with CO2 output owing to the increased transport resistances and greater concentration polarization between the two sides of the electrochemical cell at lower flow rates.

To further investigate the performance of the proof-of-concept EMAR system as a function flow rate, experiments were run with constant currents, and the flow rates were varied over time. The results from these experiments can be seen in Fig. 7.


image file: c3ra46774k-f7.tif
Fig. 7 Faradaic efficiency (a) and work of CO2 capture (b) as a function of the sorbent flow rate for a EMAR system with 1 M EDA, 0.25 M Cu(NO3)2, and 1 M NaNO3. Numbers represent the applied current during the experiment. Lines for efficiency and work of capture are linear regressions and 2nd order regressions, respectively.

The parabolic shape of the work of capture curve reflects the trend in Fig. 6 that showed the best performance for moderate flow rates. In contrast to the data given in Fig. 6, however, the ideal flow rates are in the range of 30 to 40 mL min−1, rather than 20 mL min−1. This difference is most likely a consequence of the experimental variability of the bench-scale system.

The higher performance at moderate flow rates compared to low or high flow rates can be explained in terms of the competition between transport effects and inefficiencies due to low loadings. Higher velocities improved transport to the surface, reducing concentration overpotentials. Increasing the velocity also decreased the difference between copper and amine concentrations across the system, which reduced open-circuit potential differences. For both of these reasons, as the liquid flow rate increased, the required voltage was reduced for a given current density.

However, at very high flow rates, change in the copper loading from the inlet to the outlet of the anode became quite small. Eventually, the release of CO2 was so slight that the level of supersaturation was metastable, and hence, bubbles did not form spontaneously. The expected change in CO2 concentration, Δ[CO2], can be calculated as a function of the volumetric liquid flow rate and the current via

 
image file: c3ra46774k-t5.tif(6)

The expected supersaturation, σ, of the aqueous solution was estimated by dividing the expected change in CO2 concentration by the CO2 physical solubility at the anode pressure and temperature.29

 
image file: c3ra46774k-t6.tif(7)

At room temperature and pressure, the expected supersaturation dropped below 10% at liquid flow rates of 50 mL min−1 when running at 0.25 A. At such low supersaturations, it is not surprising that the CO2 release from the solution was inefficient. Fig. 8 shows all of the Faradaic efficiencies determined from the data in Fig. 6 and 7 as a function of the expected system supersaturation. The trend of decreasing Faradaic efficiency for supersaturations below 10% is statistically significant.


image file: c3ra46774k-f8.tif
Fig. 8 Faradaic efficiency as a function of supersaturation.

Stability

The stability of the flat plate electrode system was tested with polarization reversal experiments, in which the polarity and liquid flows were reversed repeatedly with respect to the sides of the electrochemical cell. In a real EMAR system, polarity reversal would be necessary to prevent accumulation of copper on the cathode and loss of copper from the anode. Results for experiments with Cu(NO3)2 and CuCl2 are shown in Fig. 9. Each dip in the CO2 output and voltage represents one reversal of the polarity.
image file: c3ra46774k-f9.tif
Fig. 9 Polarity cycling experiments at 0.25 A and 10 mL min−1 liquid flow rate for solutions of 1 M EDA, 1 M NaNO3, and 0.25 M Cu(NO3)2 (a) or 0.25 M CuCl2 (b).

Systems with both nitrate and chloride salts appeared to be relatively stable over 5 to 10 polarity reversals. While the nitrate system demonstrates higher Faradaic efficiency, the chloride system shows reduced operating potentials; this is expected based on our electrochemical kinetics measurements performed.30 In CO2-saturated solutions, the addition of chloride salts led to an increase in the exchange current density of the electrode reaction by orders of magnitude, which reduced required overpotentials substantially.

Porous electrodes

In addition to the experiments with the flat plate electrode system in 0.8 mm flow channels, porous electrodes purchases from the aerospace company, ERG, were used in 3.2 mm flow channels. The porous electrodes were purchased from the aerospace company, ERG. The 3.2 mm thick foams were the thinnest available and had a pore density of 20 pores per inch. Their porosity was over 90% with a surface area of approximately 1000 m2 m−3.

The porous electrodes were tested using EIS, as shown in Fig. 10, with EDA and Cu(NO3)2 concentrations 10 times less than used in the flat plate experiments. The NaNO3 concentration was half of the concentrations used in the flat plate experiments.


image file: c3ra46774k-f10.tif
Fig. 10 Nyquist plots of 0.1 M EDA, 0.025 M Cu(NO3)2, 0.5 M NaNO3 solutions under air and CO2-saturated conditions. Impedances in units of Ohms.

Despite the significantly lower ionic strength, the solution resistance, which is equal to the x-intercept in the Nyquist diagram, is significantly less than the solution resistance in the flat plate system. This demonstrates the superior properties (i.e., lower resistances) of the porous electrode system. At lower frequencies, the EIS experiments with dilute solutions in porous electrodes still indicated lower resistances because the higher surface area reduced transport limitations. The increase in Ohmic resistance of the CO2-saturated system results from increase in solution viscosity due to saturation.24

Fig. 11 shows results from an on/off cycling experiment with porous electrodes in the EMAR system. This is different from the polarity reversal experiment, because the system was only turned on and off, and the polarity was not switched. The results show quite high current efficiencies that, in some cases, approached unity. Unfortunately, the performance of the porous electrode system declined significantly over time.


image file: c3ra46774k-f11.tif
Fig. 11 Faradaic efficiency as a function of supersaturation.

It was determined that the electrochemical cell filled with gas bubbles during the course of the experiment because the liquid levels elsewhere in the system increased during this time frame. Several strategies were tested to reduce bubble entrapment including faster flow rates and pulsating flow; none of these approaches proved to be successful.

Manipulation of some of the operating conditions, such as increasing the temperature, or operating at pressures over 50 bar may allow operation with minimal bubble formation. Finally, different types of high surface area copper structures may provide some advantages in this regard.

Comparison with other electrochemical technologies

The results for flat plate systems demonstrate stable CO2 capture at 100 kJ mol−1 at a capture rate of 800 sccm m−2. With higher temperatures, which will reduce overpotentials associated with electrode kinetics, solution resistances, and transport limitations, the performance can be enhanced significantly. The target performance of this system based on our thermodynamics, kinetics, and transport analyses is capture of CO2 and compression to 150 bar for 50 kJ mol−1 at 10[thin space (1/6-em)]000 sccm m−2.

Comparison of the results obtained in this investigation to other electrochemical capture technologies demonstrates the significant potential of the EMAR technology. Eisaman developed a bipolar membrane based system and achieved CO2 capture energies of approximately 100 of kJ mol−1 for desorption and regeneration of bicarbonate solutions and 200 kJ mol−1 for carbonate solutions.31 Bicarbonate and carbonate are weaker sorbents for CO2 than primary amines, and therefore, should be regenerated more easily. Eisaman was also able to demonstrate desorption at pressure, which future EMAR systems are expected to match.32

Pennline demonstrated CO2 capture at 116 kJ mol−1 using an ambient temperature carbonate concentration cell with nickel catalysts.33 In this system, oxygen and carbon dioxide were transported together, necessitating a downstream oxy-fired combustion process to produce pure CO2. The ability to capture the CO2 from the flue gas in a fuel-cell design is a tremendous challenge due to the quantity of flue gas generated by a power plant. Nalco and Argonne National Lab were unable to solve this problem in their attempt to create an electrodialysis system for carbon capture.34

While these and other electrochemical carbon capture systems based on quinones,35 large binuclear complexes,36 and disulfides, may achieve similar desorption and regeneration energies, only the EMAR system uses a widely-available, low cost, and industrially proven sorbent.

EMAR compares favorably with conventional thermal amine scrubbing systems, especially in retrofit applications and when installed at non-power generating facilities. In both these cases, obtaining the large quantity of low pressure steam is inefficient because the required steam utilities are not available. In these applications, parasitic energy losses can reach 40% with extremely high capital investments that could lead to a 133% increase in the levelized cost of electricity (COE).10

A techno-economic analysis of the EMAR system, which considered the kinetics, transport, thermodynamics, and capital expenses of the capture technology, showed significantly lower increases in the COE compared to the conventional system. Depending on the capital cost of the system, which is still subject to high uncertainty, the application of an EMAR system to a supercritical power plant is expected to cause a 62% to 95% increase in COE.30

Conclusions

Bench scale results for an EMAR system highlight the effects of flow rate and current density on the system performance in terms of its Faradaic efficiency and work of CO2 capture. A preliminary investigation of porous electrode geometries and chloride salts has also been provided. The systems were shown to be stable through several polarization reversals, but longer tests will be required in the future.

Future experiments will also need to include larger systems at elevated temperatures and pressures, which are predicted to improve performance dramatically. Even at the present level of performance, 100 kJ mol−1 of CO2 captured, EMAR is an attractive new technology because it uses industrially relevant sorbents and can be applied as a ‘drop-in’ carbon capture system with no need for steam utilities.

Acknowledgements

This work was supported financially by Siemens AG and the Advanced Research Projects Agency for Energy (ARPA-E) division of the United States Department of Energy through grant DE-AR0000083. The authors would also like to thank MIT undergraduates Rebecca Han, Michaelann Rodriguez, and Jackie Brew for their contributions.

References

  1. NOAA National Climatic Data Center, State of the Climate: Global Analysis for Annual 2012, 2012 Search PubMed .
  2. R. Rohde, R. A. Muller, R. Jacobsen, E. Muller, S. Perlmutter, A. Rosenfeld, J. Wurtele, D. Groom and C. Wickham, Geoinfor Geostat, 2013, vol. 1, pp. 1–7 Search PubMed .
  3. S. A. Marcott, J. D. Shakun, P. U. Clark and A. C. Mix, Science, 2013, 339, 1198–1201 CrossRef CAS PubMed .
  4. Climate Change 2007: Mitigation of Climate Change, Contribution of Working Group III to the Fourth Assessment Report of the IPCC, ed. B. Metz, O. R. Davidson, P. R. Bosch, R. Dave and R. Meyer, Cambridge University Press, Cambridge, 2007 Search PubMed .
  5. National Research Council, America's Climate Choices, 2011 Search PubMed .
  6. NCADAC, Federal Advisory Committee Draft Climate Assessment Report Released for Public Review, 2013 Search PubMed .
  7. M. Finkenrath, J. Smith and D. Volk, CCS Retrofit: Analysis of the Globally Installed Coal-Fired Power Plant Fleet, 2012 Search PubMed .
  8. International Energy Agency, Energy Technology Perspectives 2010: Scenarios and Strategies to 2050, 2010 Search PubMed .
  9. G. T. Rochelle, Science, 2009, 325, 1652–1654 CrossRef CAS PubMed .
  10. J. Katzer, E. Moniz, J. Deutch, S. Ansolabehere, J. Beer, and others, The future of coal: an interdisciplinary MIT study, 2007 Search PubMed .
  11. MIT, Retrofitting of Coal-Fired Power Plants for CO2 Emissions Reductions, An MIT Energy Initiative Symposium, 2009 Search PubMed .
  12. P. DiPietro, P. Balash and M. Wallace, A Note on Sources of CO2 Supply for Enhanced Oil Recovery Operations, 2012 Search PubMed .
  13. S. Amin, Energy Convers. Manage., 2009, 50, 1834–1840 CrossRef CAS PubMed .
  14. R. J. Conrado, C. A. Haynes, B. E. Haendler and E. J. Toone, Advanced Biofuels and Bioproducts, Springer, New York, NY, 2013 Search PubMed .
  15. L. Hanle, K. Jayaraman and J. Smith, CO2 emissions profile of the US cement industry, 2004 Search PubMed .
  16. D. Gielen, Energy Convers. Manage., 2003, 44, 1027–1037 CrossRef CAS .
  17. J. Harnisch, I. S. Wing, H. Jacoby and R. Prinn, Policy Anal., 1998 Search PubMed .
  18. B. J. P. Buhre, L. K. Elliott, C. D. Sheng, R. P. Gupta and T. F. Wall, Prog. Energy Combust. Sci., 2005, 31, 283–307 CrossRef CAS PubMed .
  19. M. Ho, G. Allinson and D. Wiley, Ind. Eng. Chem. Res., 2008, 47, 4883–4890 CrossRef CAS .
  20. E. J. Granite and T. O'Brien, Fuel Process. Technol., 2005, 86, 1423–1434 CrossRef CAS PubMed .
  21. P. N. Seevam, J. M. Race, M. J. Downie and P. Hopkins, Proc. IPC2008, 2008, pp. 1–13 Search PubMed .
  22. M. C. Stern, F. Simeon, H. Herzog and T. A. Hatton, Energy Environ. Sci., 2013, 6, 2505–2517 CAS .
  23. M. C. Stern, F. Simeon, H. Herzog and T. A. Hatton, Energy Proc., 2013, 37, 1172–1179 CrossRef CAS PubMed .
  24. S. Zhou, X. Chen, T. Nguyen, A. K. Voice and G. T. Rochelle, ChemSusChem, 2010, 3, 913–918 CrossRef CAS PubMed .
  25. S. Aksu and F. M. Doyle, J. Electrochem. Soc., 2002, 149, B340–B347 CrossRef CAS PubMed .
  26. R. Idem, M. Wilson, P. Tontiwachwuthikul, A. Chakma, A. Veawab, A. Aroonwilas and D. Gelowitz, Ind. Eng. Chem. Res., 2006, 45, 2414–2420 CrossRef CAS .
  27. J. H. Meldon and M. a. Morales-Cabrera, Chem. Eng. J., 2011, 171, 753–759 CrossRef CAS PubMed .
  28. J. Carroll, J. Slupsky and A. Mather, J. Phys. Chem. Ref. Data, 1991, 20, 1201–1209 CrossRef CAS PubMed .
  29. S. Jones, G. Evans and K. Galvin, Adv. Colloid Interface Sci., 1999, 80, 27–50 CrossRef CAS .
  30. M. C. Stern, Doctoral Thesis, Massachusetts Institute of Technology, 2013 .
  31. M. D. Eisaman, L. Alvarado, D. Larner, P. Wang, B. Garg and K. a. Littau, Energy Environ. Sci., 2011, 4, 1319 CAS .
  32. M. D. Eisaman, L. Alvarado, D. Larner, P. Wang and K. a. Littau, Energy Environ. Sci., 2011, 4, 4031 CAS .
  33. H. W. Pennline, E. J. Granite, D. R. Luebke, J. R. Kitchin, J. Landon and L. M. Weiland, Fuel, 2010, 89, 1307–1314 CrossRef CAS PubMed .
  34. ARPA-E, OPEN 2009, 2011 Search PubMed .
  35. P. Scovazzo, D. L. Dubois, J. Poshusta, C. A. C. Koval and R. D. Noble, J. Electrochem. Soc., 2003, 150, D91 CrossRef CAS PubMed .
  36. A. M. Appel, R. Newell, D. L. DuBois and M. Rakowski DuBois, Inorg. Chem., 2005, 44, 3046–3056 CrossRef CAS PubMed .

This journal is © The Royal Society of Chemistry 2014
Click here to see how this site uses Cookies. View our privacy policy here.