Self-assembled monolayer for AFM measurements of Tobacco Mosaic Virus (TMV) at the atomic level†
Matthieu Meillana,
Michaël A. Ramina,
Thierry Buffeteauab,
Sophie Marsaudonc,
Michaël Odoricod,
Shu-wen W. Chene,
Jean-Luc Pellequerd,
Marie Degueilab,
Karine Heuzéab,
Luc Vellutiniab and
Bernard Bennetau*ab
aUniv. Bordeaux, ISM, UMR 5255, F-33400 Talence, France. E-mail: b.bennetau@ism.u-bordeaux.fr
bCNRS, ISM, UMR 5255, F-33400 Talence, France
cUniv. Bordeaux, CBMN, UMR 5248, F-33600 Pessac, France
dCEA, iBEB, Service de Biochimie et Toxicologie Nucléaire, F-30207 Bagnols sur Cèze, France
e13 Avenue de la Mayre, F-30200 Bagnols sur Cèze, France
First published on 17th February 2014
Abstract
Biosensors are based on the conversion of a biological response to an electrical signal. One of the major challenges is to ascertain that the receptor is not denatured when immobilised (covalently or not) on the device. In this work, a protein receptor (virus) was immobilised on two different surfaces, mica and self-assembled monolayer (SAM), and its height was determined by atomic force microscopy measurements at the atomic level. Results clearly showed that expected dimensions of Tobacco Mosaic Virus (TMV) are obtained after immobilisation onto a soft organic SAM.
Self-assembled monolayers provide a simple way to functionalise a solid surface and play a key role in the development of biotechnology such as biosensors.1–3 SAMs present a sum of qualities: chemically stable, low roughness, provide a suitable orientation of biomolecules, and maintain the structural integrity of receptors. In this work, we focused on the latter characteristic using the paradigm that if a molecule is covalently immobilised on SAM, its three-dimensional structure (3D) should be preserved as evidence by its molecular height measurement with atomic force microscopy (AFM). During the last decade, Atomic Force Microscopy (AFM) proved to be a commonly used technique for imaging in the field of biophysical research and it is clear now that AFM is much more than a high resolution microscope.4–7 Many parameters influence the quality of AFM data, in particular the characteristics of the tip, the measurement modes (contact mode, oscillating mode, tapping mode, etc.), the preparation of the sample and of course, the type of immobilisation (physi- or chemisorption) to which the sample is immobilised.8 For example, the measured heights of single antibody molecules, physisorbed on mica, were found around 2 nm whereas the expected value measured by X-rays is around 4 nm.
To explain this experimental result, it is generally argued that biological samples may be crushed by the AFM tip during imaging or distorted by the adsorption forces of mica. It is obvious that a hard and highly charged mineral substrate (such as mica) creates difficulties during the adsorption of molecules on which they tend to partially denature.9 To overcome these drawbacks, systems for depositing molecules such as functionalised self-assembled monolayers are emerging.10
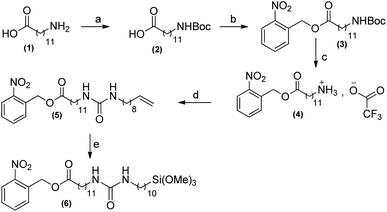
For this purpose, a new ureido silylated compound (6) was prepared in a readily accessible way (Scheme 1) via a coupling between a functional amine and an unsaturated isocyanate.11 It is noteworthy that this strategy has been previously used in our previous work for the formation of vinyl-terminated monolayer.12 The amino group of the amino carboxylic acid (1) was protected by tert-butoxycarbonyl group (Boc) to afford compound (2) then the carboxylic acid group was protected by o-nitrobenzyl alcohol to yield compound (3). After deprotection of the amino group, the condensation of the resulting ammonium (4) with unsaturated 10-isocyanatodec-1-ene yielded to ureido compound (5). Finally, the ureido silylated compound (6) was obtained in the last step after silylation of compound (5) with trimethoxysilane with an overall yield of 60%. For spectroscopic data of compounds (2)–(6), see ESI.†
The alkoxysilane (6) was chemisorbed onto SiO2 surface (Scheme 2) in optimised conditions (see ESI†) in order to obtain a homogeneous and smooth surface.
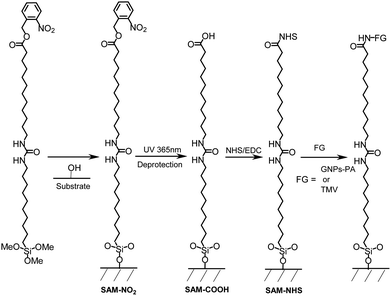 | ||
| Scheme 2 Representation of the silanisation of the surface and immobilisation of GNPs-PA or TMV on SAM-COOH. | ||
The topography of the surface was analysed by AFM measurements. The identification of the protected carboxylic acid groups-terminated monolayers onto the surface as well as the subsequent chemical surface modifications were performed using contact angles measurements and Polarisation Modulation Infrared Reflection Adsorption Spectroscopy (PM-IRRAS).
Due to its high sensitivity in surface absorption detection, PM-IRRAS has been used successfully to obtain vibrational spectra of Langmuir–Blodgett (LB) monolayers, lipid bilayers and SAMs deposited onto metal oxide substrates.13–16 In our case, we have used PM-IRRAS to monitor the chemical reactions of the terminal functions of the surface (Fig. 1). The very high sensibility of PM-IRRAS allowed us to characterise easily each step. Spectra were recorded with a very good signal-to-noise ratio, allowing each time the identification of the different functional groups of the investigated molecules (alkyl chains, urea and terminal functional groups).
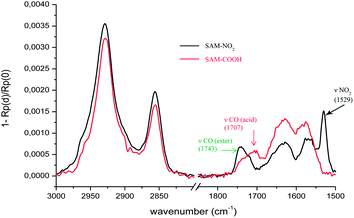 | ||
| Fig. 1 PM-IRRAS spectra of SAM-NO2 and SAM-COOH, in the 3000–2800 cm−1 and 1850–1500 cm−1 spectral ranges. | ||
Among the photolabile groups, (o-NB) alcohol is widely used in polymer and material sciences.17 The removal of the nitrobenzyl moiety was achieved by ultraviolet light (365 nm). The successful chemical reaction was analysed by PM-IRRAS revealing the complete disappearance of the nitro band (νas NO2 = 1529 cm−1) and the appearance of a new broad band around 1707 cm−1 characteristic of acid groups as previously reported.18 For SAM-NO2 and SAM-COOH the methylene stretching bands are observed in similar positions at 2927 and 2855 cm−1 respectively for the antisymmetric (νas(CH2)) and symmetric (νs(CH2)) modes. The high wavenumbers of these modes indicates that the alkyl chains were disordered in the grafted molecules whereas similar intensities do not reveal any degradation of the monolayer during the photochemical cleavage.
Average roughness of this new SAM-COOH was found (Fig. 2) similar to that of the bare substrate (Rq = 0.48 nm over 25 μm2) at the difference of normally used or commercially available SAM-COOH. The roughness is a crucial parameter for measuring TMV at the atomic level by AFM. Water contact angles were found around 71° for the SAM-NO2 and 55° for the SAM-COOH, after deprotection of the acid groups. These values are consistent with those reported in the literature,19,20 revealing the presence of more polar groups at the surface.
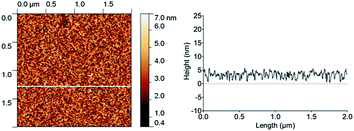 | ||
| Fig. 2 AFM height image (2 × 2 μm2) in the tapping mode of SAM-COOH (left) with a cross-section profile (right). | ||
Immobilisation of biomolecules onto a carboxylic acid terminated monolayer is usually achieved by activation of COOH groups with N-ethyl-N′-(3-(dimethylamino)propyl)-carbodiimide–N-hydroxysuccinimide (EDC–NHS). The activated esters (succinimidyl esters) react with the free amino groups of biomolecules to form the amido bonds on the surface.
TMV was immobilised covalently (Scheme 2) onto a carboxylic acid-terminated self-assembled monolayer (SAM-COOH). TMV is a well-calibrated biological system,21,22 which can be immobilised on various surfaces.23 This virus is made of 2130 copies of a unique coat protein which is replicated helicoidally around its RNA, forming a cylinder about 300 nm in length and 18.0 nm diameter.24,25
In the field of biosensors technology, the reliability of sensors strongly depends on the control of the immobilisation of biomolecules on the solid substrates,26 and the activation step is a crucial parameter for the repeatability of measurements. A literature survey about this step shows that the relative concentrations in EDC and NHS strongly vary from a study to another one.27–31 Recently, it was shown by transmission IR spectroscopy studies that activated esters, at the surface of hydrogenated porous silicon, can be obtained with a high yield if the respective concentrations of EDC and NHS are carefully chosen.32
In our case, transmission IR spectroscopy is not valuable because of the chemical structure of the substrate which limits the molecular information to the stretching vibrations of the alkyl chains.33 However, using the PM-IRRAS technique, we were able to monitor carefully the activation of COOH groups. With the ratio [EDC]/[NHS] = 1.2, we observed almost complete disappearance of the band associated with acid groups (1707 cm−1) and the appearance of three new bands (1816, 1781 and 1734 cm−1) assigned to the stretching of the carbonyl ester groups (see Fig. S2,† SAM-NHS). Additional information on the molecular orientation can be obtained by comparison of the experimental PM-IRRAS spectrum with the one calculated for an isotropic orientation of the molecules.16
In order to demonstrate the ability of the SAM-COOH to generate amide bond formation, gold nanoparticles, coated with protein A (GNPs-PA; ∅ ∼ 20 nm), were used to provide visual evidence of their attachments to the activated surface sites (Scheme 2). Successful amide bond formation was confirmed by PM-IRRAS (Fig. S3†) with the disappearance of the carbonyl bands (1816 and 1781 cm−1), with in parallel, an increase of the amide 1 and amide 2 bands at 1653 and 1543 cm−1 respectively, due to the amido bond formation between the carboxylic acid groups of the surface and the free amino groups of protein A.
The modified surfaces were also studied by AFM (Fig. 3). Excellent GNPs-PA dispersion was observed when the nanoparticles were used at a concentration of (3.2 μg mL−1). Thus, height analysis has been easily performed and the particle size was determined to be (19.0 ± 1.1 nm; N = 20) which is consistent with the expected value (ø = 20.4 ± 0.6 nm; see ESI†).
It must be noted that negative control experiments, imaged in the same conditions, with no EDC–NHS activation, result in no immobilisation of GNPs-PA demonstrating that this new ureido-based SAM-COOH prevents non-specific adsorption like previously reported with poly(ethyleneglycol) PEG-based monolayers.34
Once we had confirmed that the SAM-COOH monolayer was indeed active for the covalent immobilisation of GNPs-PA, we used the SAM-COOH in the same way to bond covalently TMVs according to the same experimental procedure. TMV particles were imaged using AFM with the tapping mode in air in two deposition conditions: physisorbed on mica or covalently bound to SAMs (Fig. 4). AFM images when flattened using NanoScope software and further processed for removing stripe noise.35
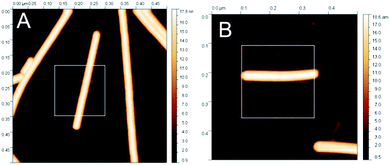 | ||
| Fig. 4 Height image of isolated TMV particles using the tapping mode in air on mica (A) and on SAM (B). | ||
Height values were obtained by fitting a series of ellipsoids on single TMV particles36 using singled-out regions similar to those shown in white boxes on Fig. 4.
The average TMV height on mica was found to be 17.0 ± 0.1 nm (ave ± stdev, N = 802) whereas it was 18.1 ± 0.1 nm when the TMV was bound to SAM surface (ave ± stdev, N = 521). AFM images were obtained at the minimum imaging force. Similar measurements were repeated several times over a period of 2 years with different TMV preparations, different batches of SAMs, different cantilevers and different AFM instruments. It shows clearly that SAM surfaces allow imaging TMVs particles, without distortion.24 For comparison, AFM images of denaturated TMVs are given below.
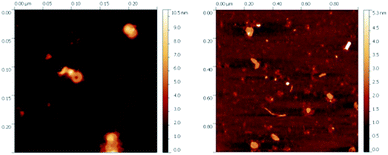
On the left AFM image (Fig. 5; 250 × 250 nm2), using the peak force mode, the presence of RNA single strands, characteristic of denatured TMV particles, can be observed. On the right image, a broken piece of TMV of about 50 nm length is also characteristic of denatured TMV (expected full length is about 300 nm).
Conclusions
In summary, for biosensors as well as structural biology applications, it is critical to measure height and shape of biomolecules as accurate as possible. Here, we clearly show that the adsorption forces on mica induced a reduction in measured height of about 1 nm. For the development of biosensors, keeping the original shape of the receptor is a key to sensitivity and specificity. Thus, we suggest that SAM surfaces should be preferred for the development of biosensors substrates over mineral ones.Notes and references
- T. Wink, S. J. van Zuilen, A. Bult and W. P. van Bennkom, Analyst, 1997, 122(4), 43R RSC.
- Y. Zhou, C. W. Chiu and H. Liang, Sensors, 2012, 12(11), 15036 CrossRef CAS PubMed.
- P. Massé, L. Vellutini, B. Bennetau, L. Blanc, C. Dejous, D. Rebière, P. Weisbecker and J.-P. Pillot, J. Mater. Chem., 2011, 21, 14581 RSC.
- P. Parot, Y. F. Dufrene, P. Hinterdorfer, C. Le Grimellec, D. Navajas, J.-L. Pellequer and S. Scheuring, J. Mol. Recognit., 2007, 20, 418 CrossRef CAS PubMed.
- D. Müller and Y. Dufrêne, Nat. Nanotechnol., 2008, 3, 261 CrossRef PubMed.
- P. Hinterdorfer, M. Garcia-Parajo and Y. Dufrêne, Acc. Chem. Res., 2012, 45, 327 CrossRef CAS PubMed.
- I. Casuso, F. Rico and S. Scheuring, J. Mol. Recognit., 2011, 24, 406 CrossRef CAS PubMed.
- A. Alessandrini and P. Facci, Meas. Sci. Technol., 2005, 16, R65 CrossRef CAS.
- K. Umemura, K. Sutoh, F. Tokunaga, M. Kataoka, H. Kamikubo, H. Arakawa and A. Ikai, Scanning, 1996, 18, 275 CrossRef CAS.
- Z. Lv, J. Wang, G. Chen and L. Deng, Int. J. Biol. Macromol., 2010, 47, 661 CrossRef CAS PubMed.
- H. Nam, M. Granier, B. Boury and S. Y. Park, Langmuir, 2006, 22, 7132 CrossRef CAS PubMed.
- M. A. Ramin, G. Le Bourdon, K. Heuzé, M. Degueil, C. Belin, T. Buffeteau, B. Bennetau and L. Vellutini, Langmuir, 2012, 28, 17672 CrossRef CAS PubMed.
- T. Buffeteau, B. Desbat and J. M. Turlet, Appl. Spectrosc., 1991, 45, 380 CrossRef CAS.
- Y. S. Shon, S. Lee, R. Colorado Jr, S. S. Perry and T. R. Lee, J. Am. Chem. Soc., 2000, 122, 7556 CrossRef CAS.
- D. M. Spori, N. V. Venkataraman, S. G. P. Tosatti, F. Durmaz, N. D. Spencer and S. Zürcher, Langmuir, 2007, 23, 8053 CrossRef CAS PubMed.
- M. A. Ramin, G. Le Bourdon, N. Daugey, B. Bennetau, L. Vellutini and T. Buffeteau, Langmuir, 2011, 27, 6076 CrossRef CAS PubMed.
- For a recent review of the use of o-nitrobenzyl alcohol derivatives in material science, see for example: H. Zhao, E. S. Sterner, E. B. Coughlin and P. Theato, Macromolecules, 2012, 45, 1723 CrossRef CAS.
- H. Rahma, T. Buffeteau, C. Belin, G. Le Bourdon, M. Degueil, B. Bennetau, L. Vellutini and K. Heuzé, ACS Appl. Mater. Interfaces, 2013, 5, 6843 CAS.
- P. F. Driscoll, E. Milkani, C. R. Lambert and W. G. Mc Gimpsey, Langmuir, 2010, 26, 3731 CrossRef CAS PubMed.
- E. Besson, A. M. Gue, J. Sudor, H. Korri-Youssoufi, N. Jaffrezic and J. Tardy, Langmuir, 2006, 22, 8346 CrossRef CAS PubMed.
- A. N. Creager, The Life of a Virus: Tobacco Mosaic Virus as an Experimental Mode, The University of Chicago Press, 2002 Search PubMed.
- M. H. Trinh, M. Odorico, L. Bellanger, M. Jacquemond, P. Parot and J.-L. Pellequer, J. Mol. Recognit., 2011, 24, 503 CrossRef PubMed.
- A. Azimzadeh, J.-L. Pellequer and M. H. V. van Regenmortel, J. Mol. Recognit., 1992, 5, 9 CrossRef CAS PubMed.
- R. Pattanayek and G. J. Stubbs, J. Mol. Biol., 1992, 228, 516 CrossRef CAS.
- M. H. Trinh, M. Odorico, M. E. Pique, J.-M. Teulon, V. A. Roberts, L. F. Ten Eyck, E. D. Getzoff, P. Parot, S.-w. W. Chen and J.-L. Pellequer, Structure, 2012, 20, 113 CrossRef CAS PubMed.
- S. M. Borisov and O. S. Wolfbeis, Chem. Rev., 2008, 108, 423 CrossRef CAS PubMed.
- N. Patel, M. C. Davies, M. Hartshorne, R. J. Heaton, C. J. Roberts, S. B. J. Tendler and P. M. Williams, Langmuir, 1997, 13, 6485 CrossRef CAS.
- F. Wei, B. Sun, Y. Guo and X. Z. Zhao, Biosens. Bioelectron., 2003, 18, 1157 CrossRef CAS.
- L. S. Jang and H. K. Keng, Biomed. Microdevices, 2008, 10, 203 CrossRef CAS PubMed.
- L. K. Wolf, D. E. Fullenkamp and R. M. Georgiadis, J. Am. Chem. Soc., 2005, 127, 17453 CrossRef CAS PubMed.
- J. W. Lee, S. J. Sim, S. M. Cho and J. Lee, J. Biosens. Bioelectron., 2005, 20, 1422 CrossRef CAS PubMed.
- S. Sam, L. Touahir, A. J. Salvador, P. Allongue, J.-N. Chazalviel, A. C. Gouget-Laemmel, C. Henry de Villeneuve, A. Moraillon, F. Ozanam, N. Gabouze and S. Djebbar, Langmuir, 2010, 26, 809 CrossRef CAS PubMed.
- D. H. Dinh, L. Vellutini, B. Bennetau, C. Dejous, D. Rebière, E. Pascal, D. Moynet, C. Belin, B. Desbat, C. Labrugère and J.-P. Pillot, Langmuir, 2009, 25, 5526 CrossRef CAS PubMed.
- T. Böcking, K. A. Kilian, K. Gauss and J. J. Gooding, Langmuir, 2006, 22, 3494 CrossRef PubMed.
- S.-w. W. Chen and J.-L. Pellequer, BMC Struct. Biol., 2011, 11, 7 CrossRef PubMed.
- S.-w. W. Chen, M. Odorico, M. Meillan, L. Vellutini, J.-M. Teulon, P. Parot, B. Bennetau and J.-L. Pellequer, Nanoscale, 2013, 5, 10877 RSC.
Footnote |
| † Electronic supplementary information (ESI) available: Synthesis of organic compounds and their characterisations (NMR spectra (1H and 13C), FTIR, SMHR-ESI). Chemical modification of the surfaces (PM-IRRAS, contact angles and AFM). See DOI: 10.1039/c3ra46716c |
| This journal is © The Royal Society of Chemistry 2014 |

