DOI:
10.1039/C3RA46578K
(Paper)
RSC Adv., 2014,
4, 12918-12928
Solar light driven Rhodamine B degradation over highly active β-SiC–TiO2 nanocomposite†
Received
11th November 2013
, Accepted 17th January 2014
First published on 20th January 2014
Abstract
A series of β-SiC–TiO2 nanocomposites were successfully fabricated by a sol–gel process with the purpose of efficient charge (e−, h+) separation and the enhancement of the photocatalytic performance under solar light irradiation. A pristine anatase state of TiO2 was prepared by the acid hydrolysis of Ti (OiPr)4 and a β-SiC powder was synthesized by a thermal plasma process from rice husks. The physicochemical characteristics of the nanocomposites were surveyed by X-ray diffraction (XRD), Fourier transform infrared spectroscopy (FTIR), UV-visible diffuse-reflectance spectroscopy (UV-vis DRS), BET surface area, transmission electron microscopy (TEM), X-ray photoelectron spectroscopy (XPS), field emission scanning electron microscopy (FE-SEM) and photoelectrochemical (PEC) measurement. The PEC study confirms that TiO2 is n-type semiconductor, whereas the β-SiC is p-type semiconductor. The XRD, TEM and XPS studies confirm the formation of a heterojunction between the β-SiC and TiO2. The photocatalytic activities of all the β-SiC–TiO2 nanocomposites were studied for aqueous Rhodamine B (Rh-B) dye degradation under solar light irradiation. The photodegradation mechanism of all the synthesized catalysts were further confirmed through chemical oxygen demand (COD) analysis and trapping of hydroxyl radicals by a fluorescence probe technique. Among all the samples, 20 wt% β-SiC–TiO2 exhibits a significant activity of 87% dye degradation in the presence of solar light. The high activity of 20 wt% β-SiC–TiO2 is ascribed to high surface area, low crystallite size, high generation of OH radicals and COD efficiency.
Introduction
Over the past few decades, it has been reported that oxide based semiconductors are active photocatalysts in solar energy conversion for water decontamination and the water splitting reaction.1,2 Among them, TiO2 is one of the most promising semiconductor photocatalysts, owing to its low cost, long-term stability, non-toxicity, high specific surface area and excellent photocatalytic properties. However, there are two aspects which limits its application; (i) the wide band gap nature of TiO2 (3.2 eV for the anatase phase or 3.0 eV for the rutile) makes it absorb only ultraviolet (UV) light, (ii) retardation of the recombination rate of the photogenerated electron–hole pairs, so that the excitons can be utilized effectively for organic pollutant degradation.3 Therefore, efforts have been made to improve the photoabsorption of the UV active materials in the visible region and suppression of the recombination rate of the charge carriers.4,5 Moreover, in composite semiconductor materials, a heterojunction interface is constructed between the semiconductors with matching band potentials, and accordingly a contact electric field is built at the heterojunction interface. This electric field favors the transport of photogenerated charges from one semiconductor to another, leading to the efficient separation of the photogenerated electron–hole pairs and improves the efficiency of the photocatalytic materials.6 For photocatalytic applications, the development of visible light responsive materials is necessary for the proper utilization of solar light, because it occupies 43% of the solar spectrum. Particularly, the coupling of n-type TiO2 with p-type narrow band gap semiconductors is a good approach to improve the visible light absorption capability and the photocatalytic performance of TiO2 in the presence of solar light.7–10 In this context, several studies, such as the coupling of various semiconducting materials, like Pt–TiO2, Cu2O/TiO2, TiO2/N–Bi2WO6, CdS–TiO2 have been reported for Rh-B degradation under visible light irradiation.10–13 However, some of these photocatalyst materials may not be easily recovered in a pure form from the reaction mixture for further applications. Some of the TiO2 particle may be leached out into the solution, even after centrifugation.
β-Silicon carbide (β-SiC) is an attractive narrow band gap (2.2 eV) p-type semiconductor, prominently known for its interesting optical performance in the visible region and chemical stability during the photocatalytic process.14–17 The metal support stability (MSS) of SiC is higher and the metal support interaction (MSI) is lower in comparison to any other catalytic material.14,18,19 Apart from the above features, the cubic structured (3C–SiC) β-SiC exhibits excellent physical and chemical properties, such as high thermal conductivity, low specific weight, insolubility in water and chemical inertness, which are essential ingredients for a heterogeneous catalytic reaction.14,20–22 Up to now, a number of SiC–TiO2 photocatalysts have been reported for photocatalytic performance under UV light.20–22 It has been reported that the charge recombination rate is reduced in a 3C–SiC–TiO2 system, used as a photoelectrode in a dye-sensitized solar cell.23 However, till today there has been no report on the degradation of Rh-B by sol–gel synthesized p-type β-SiC (derived from rice husks by a plasma process)–n-type TiO2 heterojunction based nanocomposite, in the presence of solar light. The heterojunction structure helps for visible light harvestation, easy channeling of the photogenerated charge carriers, which makes the system unique and pivotal for enhancing the photocatalytic efficiency in comparison to other reported catalytic systems.10–13,20–22
In this present work, a series of β-SiC–TiO2 nanocomposites with a varying amount of β-SiC has been synthesized by the sol–gel method and their characterization was carried out by various physicochemical techniques. The impact of the β-SiC concentration on the crystal structure, morphology, optical properties of TiO2 and photocatalytic activity of the β-SiC–TiO2 nanocomposites towards Rhodamine B (Rh-B) dye degradation in the presence of solar light has been studied and discussed in detail.
Experimental section
Synthesis of β-SiC powder
Rice husks were considered as a potential raw material for the synthesis of silicon carbide.24 Hence, in the present study, the locally available rice husk was processed in plasma, using an indigenously developed 50 kW extended arc thermal plasma reactor, with an applied load voltage of 50 V and an arc current of 300 A. The plasma forming argon gas flow was kept fixed at 1 L min−1. The thermal plasma reactor provides a very high temperature and rapid heat transfer, which is the main advantage to convert rice husks to β-SiC within a short time period of 20 min. The detailed synthesis procedure was documented elsewhere.25 The plasma synthesized product obtained from the plasma reactor contained a mixture of β-SiC and a small percentage of carbon and silica. The plasma produced sample was heated at 700 °C in a muffle furnace for 2 h, to remove the free carbon. The particle size of the as synthesized β-SiC was found to be in the order of 10 μm. To further reduce the particle size, the plasma produced carbon free β-SiC powder was ground by a Pulverisette 7 premium line planetary ball mill with 1.6 mm tungstate carbide (WC) balls. The grinding was carried out in 80 mL WC jar in an isopropyl alcohol medium at a fixed rpm of 600 for 1 h. Then, this ground sample was thoroughly washed with 1
:
1 HCl, 1
:
2 HNO3 and 40% HF, for the complete removal of silica and other metallic impurities (if any), present in the sample. The average particle size observed by a particle size analyzer (Model Nanotrac U2058I) was around 30–80 nm. This ground β-SiC nanopowder was taken as the active material for the preparation of the β-SiC–TiO2 heterojunction based nanocomposites.
Synthesis of β-SiC–TiO2 nanocomposites
A series of β-SiC–TiO2 heterojunction based nanocomposites were synthesized by a sol–gel process, at room temperature by the hydrolysis of titanium (IV) isopropoxide (Ti (OiPr)4) in the presence of varying concentration of β-SiC powder, as illustrated in Scheme 1. A requisite amount of the β-SiC was dispersed in 30 mL of dry ethanol at room temperature, followed by sonication for 30 min to break the agglomerated particles. The required amount of pure Ti (OiPr)4 was added drop wise to the suspension and stirred for other 30 min. The hydrolysis and condensation reactions of Ti (OiPr)4 were initiated through the addition of acetic acid (AA), followed by distilled water. The mixture was finally stirred in the air at room temperature, resulting in a dry powder after total evaporation of the solvent. The dry powder was ground in a mortar to break the agglomeration. The resulting fine powder was calcined at 450 °C for 2 h, in a conventional furnace, to allow combustion of the remaining organic molecules and crystallization of the catalysts. In this way, different compositions of β-SiC (5, 10, 15, 20 and 25 wt% of β-SiC) loaded TiO2 catalysts were prepared. Neat TiO2 was prepared by the acid hydrolysis of Ti (OiPr)4 in ethanol and calcined in a conventional furnace for 2 h at 450 °C. The nanocrystalline β-SiC and calcined TiO2 were used as reference catalysts in this work.
 |
| Scheme 1 Formation of β-SiC–TiO2 heterojunction based nanocomposite photocatalyst by sol–gel technique. | |
Material characterization
The structure and phase identification of the prepared samples were performed by the X-ray powder diffraction (XRD) technique by a Philips PANalytical PW 3040/60 instrument using Mo-Kα radiation of 0.7093 Å, within the 2θ range 5 to 40°. The bonding and structural information of all the prepared catalysts were recorded using Fourier transform infrared spectroscopy (FTIR) by Bruker-Alpha (ECO-ATR) within the range 500–4000 cm−1. Self supporting pellets were prepared with KBr and the catalysts, applying a 50 kg cm−2 pressure. These pellets were used for recording the FTIR spectra. The optical absorbance of the prepared catalysts were measured by UV-visible diffuse-reflectance spectroscopy (UV-vis DRS), using a Varian Cary 100 spectrophotometer (model EL 96043181) equipped with a diffuse reflectance accessory in the region 200–800 nm. The spectra were recorded using boric acid as the reflectance standard. The BET surface areas of all the prepared samples were determined by N2 adsorption–desorption studies at the liquid nitrogen temperature (−197 °C) in an automated surface area and porosity analyzer (ASAP2020, Micromeritics, USA). The shape, size and composition of the prepared catalysts were determined by a high resolution-transmission electron microscope (HR-TEM), equipped with energy dispersive X-ray (EDX) spectroscopy using TWIN FEI, TECNAIG2 20 instrument operated at 200 kV. The electronic states of Ti, O, Si, C, were examined by X-ray photoelectron spectroscopy ((XPS), Kratos Axis 165 with a dual-anode (Mg and Al) apparatus) using a Mg Kα source. All the binding energy values were calibrated by using the contaminant carbon (C 1s = 284.4 eV) as a reference. A charge neutralization of 2 eV was used to balance the charge of the sample. The binding energy values of the samples were reproducible within ±0.1 eV. The morphological and structural properties of the synthesized catalysts were studied by field emission-scanning electron microscopy (FE-SEM Zeiss Supra55) analyzer. The photoelectrochemical measurement (FE-SEM) was performed by a potentiostat, (Versastat 3, Princeton Applied Research) using 300 W Xe lamps. For the photoelectrochemical measurement, the electrodes were prepared by electrophoretic deposition in an acetone solution (30 mL) containing the photocatalyst powder (30 mg) and iodine (30 mg). Two parallel FTO (fluorine doped tin oxide) electrodes were immersed in the solution with a 10–15 mm separation, and a 50 V bias was applied between the two for three minutes, for the potential control. The coated area was fixed at 1 cm × 3 cm and then dried. The photoelectrochemical measurement was performed using a conventional pyrex electrochemical cell consisting of a prepared electrode, a platinum wire as a counter electrode (1 mm in diameter, 15 mm in length), and Ag/AgCl reference electrode. The cell was filled with an aqueous solution of 0.1 M Na2SO4 and the pH of the solution was kept fixed to 6. The electrolyte was saturated with nitrogen prior to the electrochemical measurements, and the potential of the electrode was controlled by a potentiostat (Versastat 3, Princeton Applied Research) with 300 W Xe lamps. Notably, the FTO did not show a photoresponse in the solution. For OH˙ radical detection the liquid PL (fluorescence spectrum) characterization was carried by a LS-55 fluorescence spectrophotometer. The experiment was carried out in the presence of solar light, by taking 0.02 g L−1 of each catalyst with 5 × 10⁻⁴ M terephthalic acid (TPA) with a concentration of 2 × 10⁻³ M NaOH in 7 different tightly fitted conical flasks. The reaction solution of each individual catalyst was thoroughly centrifuged and taken by 5 mL of quartz cuvette with an excitation wavelength of 315 nm.
Photocatalytic decolourisation process
The Rh-B dye (Fig. S1†) degradation experiments in the presence of solar light were carried out by taking 20 mL of the Rh-B dye (100 mg L−1), 0.02 g L−1 of each catalyst in 7 different tightly fitted conical flasks. The reactions were performed under 3 different conditions: (i) the control experiments were performed for 30 min under dark conditions in the presence of the photocatalysts, to establish the adsorption of dye on the active sites of the photocatalyst, (ii) the degradation of the Rh-B was monitored under solar light for 3 h, without using photocatalysts, (iii) finally, the degradation of the Rh-B was monitored in the presence of the photocatalysts and solar light. The intensity of the solar light was measured using a LT Lutron LX-101A digital light meter. The sensor was always set in the position of maximum intensity and the solar light intensity was measured every half an hour. The average light intensity was measured for the reaction, which was nearly constant during the experiments. Furthermore, the photocatalytic degradation activity of the β-SiC–TiO2 composites and their comparison with the standard catalyst, Degussa P25, was carried out in presence of visible light illumination (λ ≥ 400 nm) for 180 min in an irradiation chamber (BS 02, Dr Grobel, UV-Elektronic GmbH). After irradiation, the dye suspensions were centrifuged and the remaining dye concentration was recorded using a Carry 100 Varian UV-visible spectrophotometer (Model EL 96043181) at a wavelength corresponding to the maximum absorbance of Rh-B (554 nm). The photocatalytic reactivity was estimated from the initial decrease in the concentration of dye after pre-adsorption on the catalyst under dark conditions.
For determining the chemical oxygen demand (COD) of all the synthesized materials during the photocatalytic processes, the aliquots were collected from each solution and taken for COD analysis by following a standard method reported in the literature.26 On the basis of the results, the photocatalytic degradation efficiency was calculated by the following eqn (1):
|
 | (1) |
Results and discussion
XRD
Fig. 1 depicts the X-ray diffraction patterns of the β-SiC–TiO2 nanocomposites with varying amounts of β-SiC along, with pure TiO2 and β-SiC. The X-ray diffraction peaks in Fig. 1(a) indicate the presence of the tetragonal anatase phase of TiO2, with the lattice planes (101), (004), (200), (105), (211), (204), (116), (220), (215) and (224) (JCPDS files no. # 21-1272). The X-ray diffraction peaks in Fig. 1(g) indicate the presence of the neat cubic β-SiC phase, with the lattice planes (111), (200), (220), (311), (222) and (400) (JCPDS files No. # 02–1050). The cubic β-SiC diffraction peaks began to appear and gradually intensified upon increasing the β-SiC concentration over TiO2 from 5–25 wt% (Fig. 1(b)–(f)). In addition, the intensity of the diffraction peaks of the TiO2 in the β-SiC–TiO2 nanocomposites became weaker. Furthermore, the main diffraction peaks of the TiO2 in the β-SiC–TiO2 nanocomposites were slightly shifted, to the lower angle region compared to pure TiO2, and the diffraction peaks of β-SiC were slightly shifted to a higher angle region, in comparison to the neat β-SiC sample. The maximum peak shifting has been observed in case of 20 wt% β-SiC–TiO2 nanocomposites. The crystallite sizes of all the synthesized samples were determined by employing Scherrer's formula (D = nλ/β
cos
θ), where λ is the wavelength of the X-ray (Mo-Kα), β is the full width at half-maximum of the diffraction peak, K is a shape factor (0.89) and θ is the angle of diffraction. The average crystallite size of TiO2 and β-SiC were obtained as 12.27 nm and 12.49 nm, respectively. However, in the case of the β-SiC–TiO2 nanocomposite, the crystallite size followed the trend: 20 wt% β-SiC–TiO2 (10.39 nm) < 25 wt% β-SiC–TiO2 (10.89 nm) < 15 wt% β-SiC–TiO2 (11.07 nm) < 10 wt% β-SiC–TiO2 (11.46 nm) < 5 wt% β-SiC–TiO2 (12.03 nm). The reason for the reduced crystallite size of the SiC–TiO2 nanocomposite is the result of a close interaction between the β-SiC and TiO2 crystals in the heterojunction interface.27,28
 |
| Fig. 1 X-ray diffraction patterns of (a) TiO2, (b) 5 wt% β-SiC–TiO2, (c) 10 wt% β-SiC–TiO2, (d) 15 wt% β-SiC–TiO2, (e) 20 wt% β-SiC–TiO2, (f) 25 wt% β-SiC–TiO2, and (g) β-SiC. | |
FTIR
The FTIR patterns of the β-SiC–TiO2 nanocomposites, together with pure TiO2 and β-SiC are shown in Fig. 2. The more intense IR peaks at 835 cm−1 and 713 cm−1 are attributed to the transverse optical mode of the nano Si–C, and the bending vibration mode of Ti–O–Ti, respectively.29–31 The bands at 3401 cm−1, 1619 cm−1 and 2353 cm−1 are attributed to the stretching vibration mode of an (–OH) hydroxyl group (free or bonded), bending vibration of a co-ordinated H2O from the Ti–OH group, and the stretching vibration mode of atmospheric CO2, respectively.32,33 Apart from that, a small band arising at 954 cm−1 in the β-SiC–TiO2 nanocomposites was attributed to the stretching mode of the Si–O–Ti linkage.30 It was observed that after increasing the concentration of the β-SiC over TiO2 (Fig. 2(b)–(f)), the intensity of the TiO2 bands gradually decreased and shifted towards the lower wave number region and at the same time, the peak width also increased. The maximum peak shifting of the 20 wt% β-SiC–TiO2 catalyst clearly confirms the strong interaction between the β-SiC and TiO2 in the heterojunction interface.
 |
| Fig. 2 Fourier transform infrared spectroscopy of (a) TiO2, (b) 5 wt% β-SiC–TiO2, (c) 10 wt% β-SiC–TiO2, (d) 15 wt% β-SiC–TiO2, (e) 20 wt% β-SiC–TiO2, (f) 25 wt% β-SiC–TiO2, and (g) β-SiC. | |
UV-vis DRS
Fig. 3 shows the optical response of neat TiO2, β-SiC and the β-SiC–TiO2 heterojunction based nanocomposites. The results point out that the pure TiO2 shows an absorption band at 387 nm (Fig. 3(a)) corresponding to UV light, while the absorption band of β-SiC (Fig. 3(g)) lies at 566 nm corresponding to the visible region. When TiO2 was combined with different concentrations of β-SiC (5 to 25 wt%), the absorption band of all the combined samples was extended gradually towards the visible region (Fig. 3(b)–(f)). This is due to the overlapping of the absorption band of the two components. The maximum visible light absorption in the case of the 20 wt% β-SiC–TiO2 nanocomposite is only due to the contribution of the narrow band gap of β-SiC, since TiO2 had no absorption in the visible region. This is also reflected in the band gap calculation. The energy band gap of TiO2, β-SiC and the β-SiC–TiO2 nanocomposites was estimated from the Taucs plot of (αhν)1/2 versus photon energy (hν).34 The obtained band gap values are summarized in Table 1. The calculated band gap energies of neat TiO2 (3.2 eV) and raw β-SiC (2.19 eV) have been inserted in Fig. 3 as (a) and (g) respectively. The observed values are consistent with those reported in the literature.35,14 The red shift of the absorption (towards 600 nm) in the β-SiC–TiO2 nanocomposites suggests the strong interaction between β-SiC and TiO2 at the heterojunction interface, which makes the catalyst active in solar light.23
 |
| Fig. 3 UV-vis diffuse reflectance spectroscopy of (a) TiO2, (b) 5 wt% β-SiC–TiO2, (c) 10 wt% β-SiC–TiO2, (d) 15 wt% β-SiC–TiO2, (e) 20 wt% β-SiC–TiO2, (f) 25 wt% β-SiC–TiO2 and (g) β-SiC. | |
Table 1 Textural and optical properties of the synthesized catalysts
Catalyst |
Surface area (m2 g−1) |
Pore size (nm) |
Pore volume (cm3 g−1) |
Band gap energy (eV) |
β-SiC |
20 |
41.40 |
0.0462 |
2.19 |
TiO2 |
41.90 |
17.87 |
0.2349 |
3.2 |
5 wt% β-SiC–TiO2 |
44.48 |
13.44 |
0.1841 |
2.98 |
10 wt% β-SiC–TiO2 |
56.18 |
11.47 |
0.1386 |
2.77 |
15 wt% β-SiC–TiO2 |
72.49 |
11.09 |
0.1212 |
2.66 |
20 wt% β-SiC–TiO2 |
85.12 |
10.66 |
0.1055 |
2.54 |
25 wt% β-SiC–TiO2 |
83.27 |
11.3594 |
0.1127 |
2.50 |
BET surface area
In order to understand the textural properties, all the samples were subjected to N2 adsorption–desorption measurements. The results are summarized in Table 1. The surface area of TiO2 is around 41.90 m2 g−1, with a pore volume of 0.1075 cm3 g−1. With the increase in the β-SiC concentration, the surface area of all the β-SiC–TiO2 nanocomposites increases. The increase in the surface area may be due to the establishment of the heterojunction and a synergic effect between the two semiconductors.28
HR-TEM
Fig. 4 shows TEM images, selected area electron diffraction (SAED) patterns and energy dispersive X-ray (EDX) spectra of β-SiC, TiO2 and the β-SiC–TiO2 nanocomposites. It was observed from the TEM images that β-SiC particles are cubic in structure, within the size range 30–80 nm (Fig. 4(a)) whereas the TiO2 nanoparticle are spherical in shape, with an average diameter of 20–50 nm (Fig. 4(b)). The respective SAED and EDX images shows that both the β-SiC and TiO2 particles are pure and polycrystalline in nature. The d values of 0.254 nm, 0.153 nm, 0.131 nm, correspond to the cubic phase of β-SiC (JCPDS files no. # 02-1050), whereas the d values of 0.35 nm, 0.23 nm, 0.18 nm correspond to the tetragonal phase of TiO2 (JCPDS files no. # 21-1272). From the EDX images (Fig. 4(c)–(g)), it was clearly observed that the intensity of the Si and C peaks gradually increases with respect to an increase in the amount of SiC loading (5–25 wt%) over the TiO2 surface. Furthermore, the SAED analysis supports the co-existence of both the β-SiC and TiO2 phaseas in all the β-SiC–TiO2 nanocomposites. Fig. 5 describes the HR-TEM image of the 20 wt% β-SiC–TiO2 nanocomposite. From the micrograph, it was clearly observed that well-defined lattice fringe separation with d = 0.35 nm of the (101) plane corresponds to the anatase phase of the TiO2 crystal, whereas the fringe separation with d = 0.25 nm of the (111) planes corresponds to the cubic phase of SiC crystals. The existence of an intimate contact between the β-SiC and TiO2 indicates the formation of a heterojunction between them. The formation of an intimate junction is significant in the electron-transfer centre, which has the key role for a higher photocatalytic activity.36,37
 |
| Fig. 4 Transmission electron microscopy (TEM) images, selected area electron diffraction (SAED) patterns and energy dispersive X-ray (EDX) spectra of (a) β-SiC, (b) TiO2, (c) 5 wt% β-SiC–TiO2, (d) 10 wt% β-SiC–TiO2, (e) 15 wt% β-SiC–TiO2, (f) 20 wt% β-SiC–TiO2 and (g) 25 wt% β-SiC–TiO2 nanocomposite catalysts. | |
 |
| Fig. 5 A high-resolution transmission electron microscopy (HR-TEM) of 20 wt% β-SiC–TiO2 nanocomposite catalyst. | |
XPS
Fig. 6 illustrates the XPS spectra of neat TiO2, β-SiC and the 20 wt% β-SiC–TiO2 nanocomposites. The Ti 2p peaks of pure TiO2 (Fig. 6(A)), show the characteristic doublet at 458.93 eV (Ti 2p3/2) and 464.63 eV (Ti 2p1/2), with a peak separation of 5.7 eV, assigned to the Ti4+state of TiO2.38,39 The O 1s peak of pure TiO2, with a binding energy 530.6 eV in Fig. 6(B) was assigned to bulk O2− from TiO2.40,41 The O 1s peak of β-SiC (Fig. 6(B)) at 532.3 eV, was assigned to a Si–O/hydroxyl group (OH) group, usually adsorbed on the SiC surface.42 The Si 2p peak of the raw β-SiC in Fig. 6(C) shows a strong peak at 100.8 eV, along with a small peak at 102.7 eV, assigned to the Si–C bond and Si–O bond, respectively.42 The C 1s peak of pure SiC in Fig. 6(D) shows two peaks at 282.8 eV and 284.5 eV, assigned to the C–Si and C–C bonds in the SiC lattice, respectively.42,43 However, in the 20 wt% β-SiC–TiO2 nanocomposite, the Ti 2p, O 1s, Si 2p and C 1s peak become wide and shift toward the lower binding energy region from their original position (Fig. 6(A)–(D)). Apart from that, the peak arises at 102.42 eV (Fig. 6(C)) in the case of the 20 wt% β-SiC–TiO2 composite, assigned to the (Si–O–Ti) linkage.44 This analysis is an indication of the interatomic interactions of TiO2 with the β-SiC–Si–O in the heterojunction of the β-SiC–TiO2 nanocomposites, which results in the peak shifting towards the lower binding energy region. In the case of a heterojunction, such a shift in the binding energy has been observed in the literature.45
 |
| Fig. 6 XPS spectra of (A) Ti 2p, (B) O 1s, (C) Si 2p, (D) C 1s for β-SiC, TiO2 and 20 wt% β-SiC–TiO2 nanocomposite catalysts. | |
FE-SEM
Fig. 7 shows the morphology and elemental analysis (EDAX) of the neat TiO2, β-SiC and β-SiC–TiO2 nanocomposites with varying amounts of β-SiC, from 5 to 25 wt%. It was observed that the β-SiC particles are semi-spherical, cubes and platelet-like morphologies, within the size range from 30 to 100 nm. The EDAX graph (Fig. 7(a)) confirms that the particles are composed of silicon and carbon. The TiO2 particles are approximately uniform in size, with spherical and hexagonal morphologies (Fig. 7(b)). The EDAX graph (Fig. 7(b)) confirms that the particle are composed of titanium and oxygen. The morphologies of the β-SiC–TiO2 nanocomposites, with variation of the β-SiC concentration (from 5–25 wt%) are shown in Fig. 7(c)–(g). The EDAX graphs (Fig. 7(c)–(g)) support the presence of the Si, C, Ti, and O elements in the β-SiC–TiO2 composites. In the 20 wt% β-SiC–TiO2 nanocomposite, a close contact between the TiO2 particles and a β-SiC grain edge was observed, which results in a flower like morphology (Fig. 7(f)). In the case of a heterojunction, this type of morphology has been observed in the literature.36,37 The observed image of the β-SiC–TiO2 nanocomposite confirms the close interaction between the SiC and TiO2 at the heterojunction interface.
 |
| Fig. 7 FESEM micrographs of (a) β-SiC, (b) TiO2, (c) 5 wt% β-SiC–TiO2, (d) 10 wt% β-SiC–TiO2, (e) 15 wt% β-SiC–TiO2, (f) 20 wt% β-SiC–TiO2 and (g) 25 wt% β-SiC–TiO2 nanocomposite catalysts. | |
PEC measurement
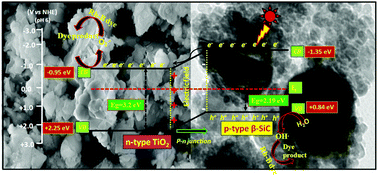
Fig. 8 displays the photocurrent spectra of β-SiC and TiO2 at pH 6 vs. a Ag/AgCl electrode. From the photocurrent spectra, it was observed that the TiO2 generates an anodic photocurrent with an applied bias, suggesting it to be an n-type semiconductor. The flat band potential of TiO2 has been observed at −0.95 V vs. Ag/AgCl, at pH 6. The flat band potential is strongly related to the bottom of the conduction band and it has been considered as the conduction band minimum for n-type TiO2.46–48 Since the band gap energy of TiO2 is 3.2 eV, the valence band maximum is estimated to be 2.25 eV. However, it was observed that β-SiC generates a cathodic photocurrent, suggesting the p-type character of β-SiC. The photocurrent onset potential of the β-SiC gives the value of the valence band edge maximum.46–48 The photocurrent onset potential of the β-SiC was observed at +0.84 V vs. a Ag/AgCl electrode at pH 6, which has been considered as the valence band edge position of β-SiC.46–48 The band gap energy of β-SiC is 2.19 eV. In consequence, the conduction band edge minimum was estimated to be −1.35 eV. The calculated band edge positions of the p-type β-SiC and n-type TiO2 are represented in Scheme 2.
 |
| Fig. 8 Current–potential curves for (a) TiO2, and (b) β-SiC under Xe light irradiation (λ ≥ 300 nm). | |
 |
| Scheme 2 (a) The band edge position of p-type β-SiC and n-type TiO2, calculated at pH 6 vs Ag/AgCl. | |
Photocatalytic activities
The percentage of Rh-B degradation over all the photocatalysts as a function of exposure time is represented in Fig. 9. The percentage of dye adsorption follows the order: 25 wt% β-SiC–TiO2 (14%) > 20 wt% β-SiC–TiO2 (13.85%) >15 wt% β-SiC–TiO2 (13%) > 10 wt% β-SiC–TiO2 (11.1%) > 5 wt% β-SiC–TiO2 (8%) > β-SiC (6%) > TiO2 (5%), corresponding with that of the surface area. The percentage of Rh-B dye degradation over all the photocatalysts after 3 h of reaction under solar light follows the order: 20 wt% β-SiC–TiO2 (87%) > 25 wt% β-SiC–TiO2 (78%) > 15 wt% β-SiC–TiO2 (72%) > 10 wt% β-SiC–TiO2 (59%) > 5 wt% β-SiC–TiO2 (52%) > β-SiC (44%) > TiO2 (33%). Fig. S2 shows a comparison of dye degradation (%) over the β-SiC–TiO2 composites along with Degussa P25, for 3 h of reaction, under visible light.† The percentage of Rh-B dye degradation under visible light follows the trend 20 wt% β-SiC–TiO2 (82%) > 25 wt% β-SiC–TiO2 (75%) > 15 wt% β-SiC–TiO2 (70%) > 10 wt% β-SiC–TiO2 (56%) > 5 wt% β-SiC–TiO2 (50%) > β-SiC (44%) > TiO2 (30%) > Degussa p25 (29%). From these experiments, it was observed that the percentage of degradation increases with the increase of the β-SiC concentration in the β-SiC–TiO2 heterojunction nanocomposites, up to 20 wt%, and then decreases on further increasing the β-SiC concentration. Furthermore, solar light is more effective for dye degradation over all the photocatalysts, rather than visible light. Therefore, the decisive wt% ratio of β-SiC to TiO2 was found to be 20 wt%, which exhibits the best photocatalytic activity towards Rh-B degradation over all the photocatalysts in the presence of solar light.
 |
| Fig. 9 Photocatalytic activities of β-SiC, TiO2 and different wt% of β-SiC–TiO2 nanocomposites for Rh-B dye degradation under solar light. | |
Chemical oxygen demand (COD)
The COD and COD efficiency of a Rh-B dye solution after 3 h of solar light irradiation in all the prepared catalysts is shown in Table 2. It was observed that during the first hour of the experiment, the solutions were colored. The COD exhibits a substantial decolourisation of the solution with the time of the irradiation. The reduction in the COD values of the treated Rh-B solution indicates the suppression of the electron–hole recombination and the generation of more OH˙ radicals in the samples, which plays an important role in the enhanced rate of photo mineralization of dye molecules. The percentage of the COD efficiencies of Rh-B mineralization over all the photocatalysts follows the order: 20 wt% β-SiC–TiO2 > 25 wt% β-SiC–TiO2 > 15 wt% β-SiC–TiO2 > 10 wt% β-SiC–TiO2 > 5 wt% β-SiC–TiO2 > β-SiC > TiO2. The 20 wt% β-SiC–TiO2 nanocomposite exhibits a noticeable faster decolourisation efficiency of Rh-B, over all the photocatalysts.
Table 2 Pseudo-first order kinetics, COD (mg L−1) and COD efficiency (%) of Rh-B dye over all synthesized catalysts
Catalyst |
kobs (min−1) |
R2 |
COD (mg L−1) |
COD efficiency (%) |
TiO2 |
0.002 |
>0.9 |
58 |
31.129 |
β-SiC |
0.004 |
>0.9 |
50.4 |
40.70 |
5 wt% β-SiC–TiO2 |
0.006 |
>0.9 |
42 |
50.58 |
10 wt% β-SiC–TiO2 |
0.007 |
>0.9 |
35.04 |
58.77 |
15 wt% β-SiC–TiO2 |
0.008 |
>0.9 |
24.02 |
71.74 |
20 wt% β-SiC–TiO2 |
0.011 |
>0.9 |
12.04 |
85.83 |
25 wt% β-SiC–TiO2 |
0.010 |
>0.9 |
19 |
77.64 |
Kinetic study
In addition, the kinetics of the Rh-B degradation under solar light irradiation, over all the photocatalysts was investigated, by following the Langmuir–Hinshelwood model:49
Here, k is the pseudo-first-order rate constant, C0 is the initial concentration of the dye and C is the concentration of the dye in the reaction time ‘t’ over all the photocatalysts. The apparent reaction rate constants (k) for the photocatalytic Rh-B degradation was evaluated from experimental data, using a linear regression. In all the cases, the R2 value was greater than 0.99, which confirms the proposed rate law for Rh-B degradation. The observed data follow pseudo 1st order kinetics for the degradation process. The decreasing order of rate constants after 3 h of solar light irradiation is summarized in Table 2 and is as follows: 20 wt% β-SiC–TiO2 > 25 wt% β-SiC–TiO2 > 15 wt% β-SiC–TiO2 > 10 wt% β-SiC–TiO2 > 5 wt% β-SiC–TiO2 > β-SiC > TiO2, which corroborates the photocatalytic degradation results presented in Fig. 9. The corresponding k values of the β-SiC–TiO2 nanocomposites are much higher than those of pure β-SiC and TiO2. Especially, the 20 wt% β-SiC–TiO2 nanocomposite exhibits the highest k value (0.011 min−1), indicating that it has the best photocatalytic activity for decomposing Rh-B under solar light irradiation. The β-SiC–TiO2 composites exhibit much higher photocatalytic activities than the single phase β-SiC and TiO2. The enhancement of the photocatalytic activities of the β-SiC–TiO2 nanocomposites in comparison to the individual components may be due to following two reasons: (i) the formation of the SiC–TiO2 heterojunction, as evidenced from the HR-TEM, XPS, XRD results. (ii) Further, it has been seen that β-SiC is capable of extending the absorption edge of TiO2 to the visible region, as explained in the UV-vis DRS spectrum. The heterojunction (p–n junction) formed between the p-type β-SiC and n-type TiO2 helps in separating the electron and hole pairs at the interface.
Mechanism of photodegradation
Fig. 10 describes the detailed mechanism of the photo-excitation and simultaneous charge transfer process at the p–n junction interface of the β-SiC–TiO2 nanocomposite. A potential rationale for the quick and effective photodegradation of Rh-B over the β-SiC–TiO2 nanocomposite has been explained with the help of following possibilities:
 |
| Fig. 10 Mechanism of photo-excitation and simultaneous charge transfer process of p-type β-SiC–n-type TiO2 nanocomposite for photocatalytic Rh-B dye degradation under solar light irradiation. | |
1. From the photocurrent spectra, we found that β-SiC is a p-type semiconductor and TiO2 is an n-type semiconductor. In favor of the p-type β-SiC semiconductor, the Fermi level lies above the valence band, whereas the Fermi level position is below the conduction band for the n-type TiO2 semiconductor, as shown in Scheme 2. As soon as the p-type β-SiC combines with the n-type TiO2, a p–n junction is formed between them and the charge carriers diffuse in the opposite direction to form an electric field at the heterojunction interface. Under thermal equilibrium conditions, the Fermi level of the n-type TiO2 and p-type β-SiC are aligned in the middle position, and an internal electric field builds to stop the charge diffusion between the two semiconductors. In the meantime, the energy band positions of TiO2 are shifted towards the downward direction and that of β-SiC towards the upward direction, along with the Fermi level.50,28 This is known as a type-II band structure. According to the type-II band structure, the conduction band (CB) and valence band (VB) of the β-SiC lie above the conduction band (CB) and valence band (VB) of TiO2. When solar light is supplied to the β-SiC–TiO2 nanocomposite, β-SiC absorbs the photon of energy greater than the band gap energy, which excites the electrons in the VB to the CB and leave the holes in the VB of the β-SiC. The electrons in the conduction band of the p-type β-SiC are then transferred to the n-type TiO2 and holes remain in the valence band of the β-SiC. The migration of photogenerated charge carriers can be promoted by the inner electric field established at the heterojunction interfaces. Consequently, the photogenerated electron–hole pairs will be effectively separated, due to the formation of a junction between the p-type β-SiC and n-type TiO2 interface, resulting in a reduced electron hole recombination.50,51 The separated electron and holes are then free to initiate the degradation reaction of the Rh-B dye on the surface of the photocatalyst.51 The potential photocatalytic process in the degradation of the Rh-B dye involves the following steps: (i) the CB electrons (e−) accumulate on the surfaces of TiO2, and are scavenged by oxygen molecule on the surface of the catalyst to form super oxide (O2−˙) radicals. These super oxide radicals again react with protons and photogenerated electrons to supply the HO2˙ species, which produces hydroxyl (OH˙) radicals in the subsequent steps. (ii) Holes generated in the β-SiC surface may directly oxidize the organic species. The super oxide (O2−˙) radicals and hydroxyl (OH˙) radicals are mostly responsible for the Rh-B dye degradation. A possible reaction mechanism for the Rh-B dye degradation includes the following steps:
Catalyst (β-SiC–TiO2) + hν → Catalyst (e CB− + h VB+) |
Catalyst (e CB−) + O2 → O2−˙ |
Catalyst (h+) + H2O → Catalyst + H+ +OH˙ |
2. Fig. 11 demonstrates the fluorescence emission spectra of all the prepared photocatalysts after 3 h irradiation. The intensity of the fluorescent peaks, at around 425 nm is directly proportional to the amount of OH˙ radicals produced in water.52 The greater the formation of OH˙ radicals, the higher the separation rate of the e− and h+ pairs in the photocatalysts. Therefore, the photocatalytic activity has a positive correlation to the formation of radicals.53,54 The formation of hydroxyl radicals over all the prepared photocatalysts followed the order: 20 wt% β-SiC–TiO2 > 25 wt% β-SiC–TiO2 > 15 wt% β-SiC–TiO2 > 10 wt% β-SiC–TiO2 > 5 wt% β-SiC–TiO2 > β-SiC > TiO2, which agree well with the photocatalytic activity.
 |
| Fig. 11 Fluorescence emission spectra of (a) TiO2, (b) β-SiC, (c) 5 wt% β-SiC–TiO2, (d) 10 wt% β-SiC–TiO2, (e) 15 wt% β-SiC–TiO2, (f) 20 wt% β-SiC–TiO2 and (g) 25 wt% β-SiC–TiO2 nanocomposite catalysts after 180 min irradiation. | |
Regeneration study and efficiency of the recycled materials
In order to regenerate the catalyst for further operations, the 20 wt% β-SiC–TiO2, after 3 h of reaction, was recovered by centrifugation, thoroughly washed with distilled water several times and dried in an air oven. The dry powder was used in the photocatalytic reaction with a fresh reaction mixture. Fig. S3 shows the performance of the 20 wt% β-SiC–TiO2 catalyst for 4 cycles.† It was found that the β-SiC–TiO2 nanocomposite retained nearly the original catalytic activity, even after 4 cycles. Thus, the 20 wt% β-SiC–TiO2 catalyst had an excellent operational stability.
Conclusions
β-SiC–TiO2 nanocomposites can be successfully fabricated by a sol–gel process. The establishment of a p-type β-SiC–n-type TiO2 heterojunction has been confirmed by XRD, XPS and HR-TEM results. The surface morphology and interaction between the β-SiC and TiO2 in the β-SiC–TiO2 nanocomposites are well explained by TEM and FESEM studies. The separation of the photogenerated charge carriers leads to enhanced photocatalytic activities, supported by fluorescence spectra, photo-current measurement and COD analysis. The narrow band gap β-SiC extends the spectral response of the TiO2 from the UV to the visible region. Among all the catalysts, the 20 wt% β-SiC–TiO2 shows the highest result of 87% Rh-B dye degradation, in the presence of solar light. The obtained p-type β-SiC–n-type TiO2 heterojunction nanocomposite can be used as a potential solar light driven photocatalyst for further applications.
Acknowledgements
The authors are grateful to Prof. B. K. Mishra, Director, IMMT, Bhubaneswar, for his kind permission to publish this paper. The authors acknowledge Mr Ajit Dash, for his help in the TEM analysis. The financial assistance by the NWP-56 CSIR net working project is greatly acknowledged. The author Gopa Mishra is thankful to the CSIR-New Delhi, for the award of a SRF.
References
- H. Zhang, G. Chen and D. W. Bahnemann, J. Mater. Chem., 2009, 19, 5089–5121 RSC.
- A. Kudo and Y. Miseki, Chem. Soc. Rev., 2009, 38, 253–278 RSC.
- S. Martha, D. P. Das, N. Biswal and K. M. Parida, J. Mater. Chem., 2012, 22, 10695–10703 RSC.
- J. Bai, J. Li, Y. Liu, B. Zhou and W. Cai, Appl. Catal., B, 2010, 95, 408–413 CrossRef CAS PubMed.
- Y. Xie, G. Ali, S. H. Yoo and S. O. Cho, ACS Appl. Mater. Interfaces, 2010, 2, 2910–2914 CAS.
- J. Su, X. X. Zou, G. D. Li, X. Wei, C. Yan, Y. N. Wang, J. Zhao, L. J. Zhou and J. S. Chen, J. Phys. Chem. C, 2011, 115, 8064–8071 CAS.
- J. Yuan, H. Li, S. Gao, Y. Linb and H. Li, Chem. Commun., 2010, 46, 3119–3121 RSC.
- N. Yildirim, T. Serin and N. Serin, J. Optoelectron. Adv. Mater., 2010, 12, 1153–1156 CAS.
- K. M. Parida and G. K. Pradhan, Mater. Chem. Phys., 2010, 123, 427–433 CrossRef CAS PubMed.
- Y. Bessekhouad, D. Robert and J. V. Weber, J. Photochem. Photobiol., A, 2004, 163, 569–580 CrossRef CAS PubMed.
- E. A. Obuya, P. C. Joshi1, T. A. Gray, T. C. Keane and W. E. Jones Jr, Int. J. Chem., 2014, 6, 1–16 Search PubMed.
- M. Wang, L. Sun, Z. Lin, J. Cai, K. Xie and C. Lin, Energy Environ. Sci., 2013, 6, 1211–1220 CAS.
- W. Li, X. Cui, P. Wang, Y. Shao, D. Li and F. Teng, Mater. Res. Bull., 2013, 48, 3025–3031 CrossRef CAS PubMed.
- M. J. Ledoux and C. P. Huu, CATTECH, 2001, 5, 226–246 CrossRef CAS.
- Q. B. Ma, B. Kaiser, J. Ziegler, D. Fertig and W. Jaegermann, J. Phys. D: Appl. Phys., 2012, 45, 1–6 Search PubMed.
- Y. Gao, Y. Wang and Y. Wang, React. Kinet. Catal. Lett., 2007, 91, 13–19 CrossRef CAS.
- C. He, X. Wu, J. Shen and P. K. Chu, Nano Lett., 2012, 12, 1545–1548 CrossRef CAS PubMed.
- R. Moene, L. F. Kramer, J. Schoonman, M. Makkee, and J. A. Moulijn, Preparation of Catalysts VI Scientific Bases for the Preparation of Heterogeneous Catalysts, Elsevier Science B.V, 1995, pp. 371–380. All right reserved Search PubMed.
- R. Moene, E. P. A. M Tijsen, M. Makkee and J. A Moulijn, Appl. Catal., A, 1999, 184, 127–141 CrossRef CAS.
- H. Yamashita, Y. Nishida, S. Yuana, K. Mori, M. Narisawa, Y. Matsumura, T. Ohmichi and I. Katayama, Catal. Today, 2007, 120, 163–167 CrossRef CAS PubMed.
- N. Keller, V. Keller, E. Barraud, F. Garin and M. J. Ledoux, J. Mater. Chem., 2004, 14, 1887–1895 RSC.
- D. Hao, Z. Yang, C. Jiang and J. Zhang, J. Mater. Sci. Technol., 2013, 29(11), 1074–1078 Search PubMed.
- Y. C. Lai and Y. C. Tsai, Chem. Commun., 2012, 48, 6696–6698 RSC.
- S. K. Singh, B. C. Mohanty and S. Basu, J. Mater. Sci., 2002, 25, 561–563 CAS.
- S. K. Singh, L. Stachowicz, S. L. Girshick and E. Fender, J. Mater. Sci. Lett., 1993, 12, 459–460 CrossRef.
- ALPHA, Standard methods for the examination of water and wastewater, American Public Health Association, Washington, DC, USA, 20th edn, 1998 Search PubMed.
- X. Zhang, L. Zhang, T. Xie and D. Wang, J. Phys. Chem. C, 2009, 113, 7371–7378 CAS.
- J. Jing, X. Zhan, P. Sun and L. Zhang, J. Phys. Chem. C, 2011, 115, 20555–20564 Search PubMed.
- J. Patyk, R. Rich, M. Wieligor and T. W. Zerd, Acta Phys. Pol., A, 2010, 118, 480–482 CAS.
- A. Hilonga, J. K. Kim, P. B. Sarawade and H. T. Kim, Powder Technol., 2010, 199, 284–288 CrossRef CAS PubMed.
- T. H. Suprabha, G. Roy, J. Thomas, K. P. Kumar and S. Methew, Nanoscale Res. Lett., 2008, 4, 144–152 CrossRef PubMed.
- Y. Gao, Y. Masuda, W. S. Seo, H. Ohta and K. Koumoto, Ceram. Int., 2004, 30, 1365–1368 CrossRef CAS PubMed.
- C. Matranga, L. Chen, M. Smith, E. Bittner, J. K. Johnson and B. Bockrath, J. Phys. Chem. B, 2003, 107, 12930–12941 CrossRef CAS.
- J. Tauc, R. Grigorovici and A. Vancu, Phys. Status Solidi B, 1966, 15, 627–637 CrossRef CAS.
- G. Mishra, S. Mohapatra, S. Prusty, M. K. Sharma, R. Chatterjee, S. K. Singh and D. K. Mishra, J. Nanosci. Nanotechnol., 2011, 11, 5049–5053 CrossRef CAS PubMed.
- J. Fu, B. Chang, Y. Tian, F. Xi and X. Dong, J. Mater. Chem. A, 2013, 1, 3083–3090 CAS.
- Y. Jia, S. Shen, D. Wang, X. Wang, J. Shi, F. Zhang, H. Han and C. Li, J. Mater. Chem. A, 2013, 1, 7905–7912 CAS.
- B. Chai, T. Peng, X. Zhang, J. Mao, K. Li and X. Zhang, Dalton Trans., 2013, 42, 3402–3409 RSC.
- D. Kumar, M. S. Chen and D. W. Goodman, Thin Solid Films, 2006, 515, 1475–1479 CrossRef CAS PubMed.
- J. H. Richter, P. G. Karlsson, G. Westin, J. Blomquist, P. Uvdal, H. Siegbahn and A. Sandell, J. Phys. Chem. C, 2007, 111, 3459–3466 CAS.
- H. Park, H. G. Kim and W. Y. Choi, Transactions on Electrical and Electronic Materials, 2010, 11, 112–115 CrossRef.
- J. Binner and Y. Zhang, J. Mater. Sci. Lett., 2001, 20, 123–126 CAS.
- G. Mishra, G. C. Behera, S. K. Singh and K. M. Parida, Dalton Trans., 2012, 41, 14299–14308 CAS.
- W. L. Yan, S. Y. Ping and X. B. She, Chin. Sci. Bull., 2008, 53, 2964–2972 Search PubMed.
- D. Zhao, C. Chen, C. Yu, W. Ma and J. Zhao, J. Phys. Chem. C, 2009, 113, 13160–13165 CAS.
- D. W. Hwang, J. Kim, T. J. Parkand and J. S. Lee, Catal. Lett., 2002, 80, 53–57 CrossRef CAS.
- M. Long, W. Cai and H. Kisch, J. Phys. Chem. C, 2008, 112, 548–554 CAS.
- K. M. Parida, A. Nashim and S. K. Mahanta, Dalton Trans., 2011, 40, 12839–12845 RSC.
- J. Hou, Z. Wang, S. Jiao and H. Zhu, CrystEngComm, 2012, 14, 5923–5928 RSC.
- J. Cao, B. Xu, H. Lin, B. Luo and S. Chen, Dalton Trans., 2012, 41, 11482–11490 RSC.
- L. Zheng, Y. Zheng, C. Chen, Y. Zhan, X. Lin, Q. Zheng, K. Wei and J. Zhu, Inorg. Chem., 2009, 48, 1819–1825 CrossRef CAS PubMed.
- K. M. Parida, L. Mohapatra and N. Baliarsingh, J. Phys. Chem. C, 2012, 116, 22417–22424 CAS.
- K. Ishibashi, A. Fujishima, T. Watanabe and T. K. Hashimoto, Electrochem. Commun., 2000, 2, 207–210 CrossRef CAS.
- H. Roussel, V. Briois, E. Elkaim, A. Roy and J. P. Besse, J. Phys. Chem. B, 2000, 104, 5915–5923 CrossRef CAS.
Footnote |
† Electronic supplementary information (ESI) available. See DOI: 10.1039/c3ra46578k |
|
This journal is © The Royal Society of Chemistry 2014 |
Click here to see how this site uses Cookies. View our privacy policy here.