Surface synergism of an Ag–Ni/ZrO2 nanocomposite for the catalytic transfer hydrogenation of bio-derived platform molecules

Amol M. Hengne, Atul V. Malawadkar, Narayan S. Biradar and Chandrashekhar V. Rode*
Chemical Engineering and Process Development Division, CSIR-National Chemical Laboratory, Pune 411008, India. E-mail: cv.rode@ncl.res.in

Received 8th November 2013 , Accepted 28th November 2013

First published on 2nd December 2013


Abstract

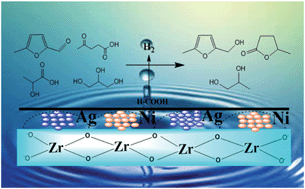
Levulinic acid was completely and selectively converted to GVL, in the presence of formic acid over an Ag–Ni/ZrO2 catalyst. The synergism between Ag and Ni in transfer hydrogenation eliminates the need for external hydrogen, making the process safer. The magnetic nature of the catalyst offers easy recovery for efficient recycling. This approach is standardized for the hydrogenation of several C3–C6 platform molecules in an aqueous medium.
Introduction

Much research is being devoted to the exploration and development of new, carbon-lean energy sources. Biomass is a carbon-neutral, renewable feedstock that could lead to the commercial production of transportation fuels and chemicals in the near future.1 These include biofuels, which are the most promising option for the transportation sector in the coming decades.2 First generation biofuels are produced from sugars, starch, and vegetable oils. Although instrumental in developing the initial market for biofuels, these were not likely to fulfil the large volume demand of the transport sector as they were directly competing with food products. A more promising feedstock is the lignocellulosic material, which is more abundant, has a lower cost, and is potentially more sustainable. Hence, strategies for the utilization of renewable sources which could replace petroleum-based refining processes, recently focused on the conversion of lignocellulosic biomass to the platform molecules. Since these bio-derived platform molecules include oxygen-rich functionality, the current refinery processes are inapplicable directly hence, it is necessary to design and develop new catalysts and novel strategies. In particular, the production of levulinic acid (LA) from cellulose is typically carried out using dilute mineral acid solutions which also produce equimolar amounts of formic acid (FA), via glucose and hydroxymethylfurfural (HMF) as intermediates. However, the isolation and purification of LA becomes complicated by the presence of intractable materials and the use of external hydrogen for further hydrogenation to produce GVL. From this perspective, if an equimolar aqueous mixture of LA–FA, as it is, could be converted to γ-valerolactone (GVL) via in situ hydrogenation over recyclable and selective catalysts, then this would lead to the most economical and sustainable process for the production of GVL. GVL has wide ranging applications, the most prominent being the downstream conversion of the gasoline blend to pentonic acid, methyl tetrahydrofuran (MeTHF), 1,5-pentanediol (PDO), valeric esters and the butene isomer, all of which form a new class of cellulosic transportation fuel.2,3

Conventionally, hydrogen generation via the dehydrogenation of FA as well as the hydrogenation of LA are separately catalyzed by metal complexes dissolved in organic solvents and supported noble metals.4,5 Since all of the reported heterogeneous catalysts until now have only consisted of noble metals, which have a high cost and scarce availability, the process is far from its large-scale practical applications. Hence, transition metals from the first row e.g. nickel nanoparticles (NPs) have been widely investigated as catalysts for dehydrogenation as well as hydrogenation reactions.6,7 Recently, bimetallic NPs have been investigated extensively as they were found to be more active than their single component counterparts for the dehydrogenation of FA as well as for the hydrogenation of levulinic acid. Some of these include Ag–Pd, Au–Pd, Au/ZrO2 and Ag–Pd–Co/C which either have high noble metal loadings (>15%) or high catalyst loadings (>1.5 g) in the reactions.8,9 As reported previously, a non-noble copper catalyst showed 80% conversion for the transfer hydrogenation of LA–FA to GVL, had a low cost recycling process, and was not susceptible to metal sintering or leaching.10 Cost effectiveness without sacrificing the performance can be harnessed by an appropriate combination of a noble metal with a non-noble metal. The activity and selectivity of such catalysts will depend on the synergetic effect, metal composition, and size of the metal particles.

Herein, we report the conversion of a biomass derived aqueous mixture of LA–FA into GVL without using any external H2 supply, over magnetically separable Ag–Ni/ZrO2 with complete conversion of LA and selectivity to GVL shown in Scheme 1. More importantly, this hydrogenation process can be accomplished in presence of formic acid, which is produced in the original acidic dehydration step. The success of this catalytic system will not only improve the atom economy of the process, but will also avoid the energy-intensive separation of LA from the mixture of LA and formic acid from the aqueous solution.


image file: c3ra46495d-s1.tif
Scheme 1 Catalytic hydrogenation of levulinic acid using formic acid as a hydrogen source.

Results and discussion

The typical X-ray diffraction (XRD) patterns of ZrO2, Ag/ZrO2, Ni/ZrO2 and Ag–Ni/ZrO2 are presented in Fig. 1. All of these samples have broad peaks at 2θ = 28.5°, 30.1° (111), attributed to the mixed tetragonal and monoclinic phases of zirconia. In Ag/ZrO2 the peaks at 2θ = 38.1°, 44.4°, 64.71° and 77.4° (JCPDS-4784) correspond to the reflections of the (111), (200), (220), and (311) crystalline planes of cubic Ag, which confirm the reduction of Ag+ to metallic Ag in Ag/ZrO2.11 Similarly, for the Ni/ZrO2 sample, the peaks at 2θ = 44.51°, 51.80° and 78.1° correspond to the reflections due to (111), (200) and (220) planes of the face centred cubic structure of the metallic Ni. However, in the case of Ag–Ni supported on zirconia, peaks observed at 2θ = 38.1°, 44.4°, 64.71° and 77.2° were attributed to both metallic Ag and Ni, with a slight shift due to the bimetallic nature of the nanocomposite.12 The particle size estimated by the Scherrer equation for planes (111) of Ag and (111) of Ni was found to be in the range 8.1–10.23 nm, which was in accordance with the HRTEM results (ESI Fig. S1).
image file: c3ra46495d-f1.tif
Fig. 1 XRD patterns of ZrO2, Ag/ZrO2, Ni/ZrO2 and Ag–Ni/ZrO2.

The high resolution transmission electron microscopy (HRTEM) images of the ZrO2 supported Ag, Ni and Ag–Ni catalysts in Fig. 2 show that these nanoparticles had a spherical morphology with an average particle size in the range 5–10 nm. The presence of both Ni and Ag was confirmed by the high resolution images of individual Ag and Ni NPs (Fig. 2B). The monometallic Ag and Ni catalysts showed a spherical morphology with a slight increase in particle size, in the range 10–12 nm, due to some agglomeration (Fig. 2C and E). The fringe pattern of Ag–Ni/ZrO2 showed a lattice fringe distance of 0.247 nm corresponding to the (111) of fcc metallic Ag (0.24 nm). Lattice fringes with a ‘d’ spacing of 0.207 nm were also observed in the edge region, which could be ascribed to the (111) planes of metallic Ni.13 This study clearly suggests that dispersion of both the metallic species over zirconia support consists of nanoparticles having particle sizes of <5 nm which is consistent with the XRD results.


image file: c3ra46495d-f2.tif
Fig. 2 HR-TEM images of (A) Ag–Ni/ZrO2, (B) fringe pattern of Ag–Ni/ZrO2, (C) Ni/ZrO2, (D) fringe pattern of Ni/ZrO2, (E) Ag/ZrO2 and (F) fringe pattern of Ag/ZrO2.

The TPR patterns of the zirconia supported Ag, Ni and Ag–Ni samples are shown in Fig. 3a. The pattern of monometallic Ag/ZrO2 had a broad H2 consumption peak in the range 450–650 °C which could be assigned to the reduction of Ag+ to metallic silver. The high reduction temperature required for Ag/ZrO2 indicates the strong metal–support interactions.14 For the Ni/ZrO2 catalyst, a broad H2 consumption peak with tailing was observed in the region of 270 to 520 °C. This response could be attributed to the sequential reduction of Ni2+ to Ni0. However, the TPR profile of Ag–Ni/ZrO2 had a low intensity H2 consumption peak with two maxima at 265 and 485 °C. The occurrence of two reduction peaks in the TPR at low temperatures could be ascribed to the reduction of silver and nickel oxide species due to the synergetic effect of Ag and Ni, responsible for the catalyst’s efficient activity in dehydrogenation as well as hydrogenation reactions.15,16


image file: c3ra46495d-f3.tif
Fig. 3 (a) H2-TPR profile of Ag, Ni and Ag–Ni/ZrO2 (b) DR-UV study of Ag, Ni and Ag–Ni/ZrO2.

The nature of the Ag–Ni formation could also be explained by comparing the DR-UV spectra of individual Ag/ZrO2, Ni/ZrO2 and Ag–Ni/ZrO2 samples shown in Fig. 3b. The monometallic Ag/ZrO2 showed a surface plasmon resonance (SPR) band at ∼334 nm, which could be assigned to silver clusters (Agδ+). In all three samples, a band was observed at 230 nm which was due to the charge transfer from O to Zr4+ of the zirconia present in the tetragonal and monoclinic phases. The spectral features of the Ni/ZrO2 sample showed no distinct absorption bands apart from the zirconia band. The absence of SPR bands in the Ag–Ni/ZrO2 sample is similar to that observed for the Ni/ZrO2 sample, which indicates either complete reduction of the metal ions or a very small particle size of the metallic species.17 This clearly suggests bimetallic Ag–Ni nanoparticle formation in the zirconia matrix, which is also in agreement with the XRD and HR-TEM studies.

The XPS patterns of Ag, Ni and Ag–Ni supported on ZrO2 catalysts (ESI Fig. S2) show that the binding energy of the Ag 3d core level for Ag/ZrO2 shifts towards the lower binding energy value of 367.1 eV compared to that (368 eV) of Ag–Ni/ZrO2. This suggests that the transformation of Ag+ to Ag0 is due to the synergetic effect of Ni with Ag. XPS spectra of Ni 2p3/2 had a peak at a binding energy of 852.5 eV due to presence of metallic Ni. The absence of any peaks at binding energies of 856 and 874 eV rule out the presence of nickel oxide.18 From these results, it can be concluded that the Ni NPs are indeed coated or bound by a thin layer of silver in Ag–Ni/ZrO2, which is in accordance with the XRD and HR-TEM studies.

The performance of several zirconia supported catalysts was evaluated for the hydrogenation of an aqueous mixture of levulinic acid and formic acid without external H2 and the results are shown in Table 1. Our previous studies showed that zirconia was the best support for levulinic acid hydrogenation to GVL, owing to its unique characteristics.14 Although all of the catalysts screened in this work gave complete selectivity for the hydrogenation product GVL, the yield varied depending on the catalyst, compositions and reaction conditions. Both of the monometallic Ag and Ni on zirconia catalysts gave very low yields of 22 and 34% respectively of GVL, while bimetallic Ag–Ni on zirconia gave a yield of GVL more than three times higher than those of the monometallic catalysts. Hence, subsequent studies on the effect of reaction parameters were carried out over active Ag–Ni/ZrO2 catalyst. Lowering of the reaction temperature from 220 °C to 150 °C caused a lowering of the yield of GVL to 21% (entry 5, Table 1).

Table 1 Catalytic screening for the transfer hydrogenation of an aqueous mixture of LA–FA to GVLa
Entry Catalyst Time (h) Temp (°C) Selectivity (%) Yield (%)
GVL
a Reaction conditions: levulinic acid (43 mmol); formic acid (43 mmol); solvent, water (90 mL); temperature, 493 K; N2 atm; catalyst, 0.5 g; catalyst[thin space (1/6-em)]:[thin space (1/6-em)]substrate ratio, 1[thin space (1/6-em)]:[thin space (1/6-em)]10.b Reaction conditions: levulinic acid (86 mmol); formic acid (86 mmol); solvent, water (81 mL); temperature, 493 K; N2 atm; catalyst, 0.5 g; catalyst[thin space (1/6-em)]:[thin space (1/6-em)]substrate ratio, 1[thin space (1/6-em)]:[thin space (1/6-em)]20.
1 10% Ag/ZrO2 5 220 99 22
2 20% Ni/ZrO2 5 220 99 34
3 10% Ag–20% Ni/ZrO2 5 220 99 99
4 10% Ag–20% Ni/ZrO2 7 200 99 88
5 10% Ag–20% Ni/ZrO2 7 150 99 21
6 10% Ag–20% Ni/ZrO2 1 220 99 34
7 5% Ag–20% Ni/ZrO2 5 220 99 52
8 10% Ag–10% Ni/ZrO2 5 220 99 60
9 10% Ag–20% Ni/ZrO2b 5 220 99 78
10 10% Ag/ZrO2 + 20% Ni/ZrO2 5 220 99 41
11 5% Ru/ZrO2 5 220 99 5
12 ZrO2 5 220 <1 <1


A similar trend was also observed when the reaction time was lowered (entry 6, Table 1) to 1 h, causing lowering of the yield of GVL from 99 to 34%. An increase in the substrate concentration from 5 to 10% slightly decreased the yield of GVL from 99 to 78%. The most important parameter was the effect of the Ag–Ni composition on the GVL yield. Lowering the Ag loading from 10 to 5% keeping Ni constant, substantially reduced the GVL yield, due to the low availability of active metal sites either for dehydrogenation or hydrogenation reactions (entry 7, Table 1). Similarly, lowering the Ni loading from 20 to 10% (keeping Ag constant at 10%) decreased the GVL yield to 60%. In addition, the effect of mixing the monometallic counterparts was also analysed by adding a physical mixture of 10% Ag/ZrO2 and 20% Ni/ZrO2 on the transfer hydrogenation of levulinic acid. It was observed that only a 41% yield of GVL was obtained which was 50% lower than that of bimetallic Ag–Ni/ZrO2 (entry 10, Table 1). Although ruthenium is a well known active catalyst for aliphatic carbonyl group hydrogenation, the zirconia supported Ru catalyst showed very poor activity (<5% GVL yield) for the in situ hydrogenation of an aq. mixture of LA–FA, indicating its inability to achieve hydrogen formation through formic acid dehydrogenation (entry 11, Table 1). Only ZrO2 without any metal functionality showed almost nil (<1%) activity confirming that both formic acid dehydrogenation followed by LA hydrogenation are mediated by active metal catalysts. Thus, the excellent performance of the bimetallic nanoparticle Ag–Ni/ZrO2 catalyst towards the transfer hydrogenation of LA to GVL, solely using hydrogen from formic acid, was due to (i) the very small particle size of the metal nanoparticles (5 nm) and (ii) the synergetic effect due to the addition of a co-metal such as Ag for low temperature reduction with minimal hydrogen uptake.

In our tandem approach, the role of the co-metal in the decomposition of formic acid is a crucial step towards the availability of nascent hydrogen without CO formation. In a control experiment, formic acid decomposition was studied separately over different catalysts as shown in Fig. 4. Ru in combination with zirconia did not show any prominent decomposition of formic acid to produce H2 and CO2, while monometallic Ag and Ni on zirconia showed low conversions in the range 10–40% and their selectivity for CO was only (5%) (ESI Fig. S6). The synergetic effect of Ag and Ni in Ag–Ni/ZrO2 immediately boosted the formic acid conversion up to 80% within the first 15 min, taking it to completion within 1 h. The catalytic decomposition of FA was also evident from the increase in the reactor pressure from 50 psi to 650 psi within 30 min, the analysis of which showed the formation of a H2 + CO2 mixture without CO selectivity (ESI Fig. S5). Thus, our bimetallic nanocomposite Ag–Ni/ZrO2 played a significant role in the dehydrogenation of formic acid to release nascent hydrogen and also subsequently catalyzed the hydrogenation of levulinic acid to GVL with a 99% yield.


image file: c3ra46495d-f4.tif
Fig. 4 Formic acid decomposition profile for Ag/ZrO2, Ni/ZrO2, Ag–Ni/ZrO2 and Ru/ZrO2. Reaction conditions: formic acid (43 mmol); solvent, water (90 mL); temperature, 493 K; N2 atm; catalyst, 0.5 g; catalyst[thin space (1/6-em)]:[thin space (1/6-em)]substrate ratio, (1[thin space (1/6-em)]:[thin space (1/6-em)]10).

The versatility of our active catalyst was demonstrated by carrying out in situ hydrogenation of several bio-derived platform molecules ranging from C3 to C6, to the hydrogenated products of the corresponding component values as presented in Table 2. Among the C3 molecules, lactic acid, glycerol and acetol showed excellent conversions of 87–99% (ESI Fig. S4) with selectivities of 81–95% for 1, 2 PDO. The reaction also proceeded successfully (99% conversion) for the hydrogenation of methyl and ethyl esters of LA giving a complete selectivity for γ-valerolactone (entries 4, 5; Table 2). This result is of vital significance as it will lead to the most sustainable process for the production of GVL since direct and efficient production of levulinic acid esters from biomass (glucose, fructose and cellulose) has already been envisaged commercially. The interesting aspect here is the selective carbonyl group hydrogenation with selective product formation. In addition, the usefulness of in situ hydrogenation over Ag–Ni/ZrO2 was also demonstrated for the conversion of furan based carbonyl groups. As expected, 5-methyl furfural (5-methyl FUR) was readily hydrogenated to 5-methyl furfuryl alcohol with complete conversion and 79% selectivity for 5-methyl FAL (entry 6, Table 2).

Table 2 Catalytic transfer hydrogenation of bio-derived C3–C6 platform moleculesa
Entry Substrate Conversion (%) Product Selectivity (%)
a Reaction conditions: substrate (1–6) (43 mmol): formic acid (43 mmol); solvent, water (93 mL); temperature, 493 K; N2 atm; catalyst, 0.5 g; catalyst[thin space (1/6-em)]:[thin space (1/6-em)]substrate ratio, (1[thin space (1/6-em)]:[thin space (1/6-em)]10); reaction time, 5 h.
1 image file: c3ra46495d-u1.tif 91 image file: c3ra46495d-u2.tif 81
2 image file: c3ra46495d-u3.tif 99 image file: c3ra46495d-u4.tif 95
3 image file: c3ra46495d-u5.tif 87 image file: c3ra46495d-u6.tif 85
4 image file: c3ra46495d-u7.tif 99 image file: c3ra46495d-u8.tif 99
5 image file: c3ra46495d-u9.tif 99 image file: c3ra46495d-u10.tif 98
6 image file: c3ra46495d-u11.tif 99 image file: c3ra46495d-u12.tif 79


The stability of Ag–Ni/ZrO2 was also established by reuse studies for the in situ hydrogenation of levulinic acid. The Ag–Ni/ZrO2 catalyst was easily recovered by applying a magnetic field after each run and used for subsequent runs showing consistent activity (99% conversion) without decrease in the selectivity for GVL up to five times (Fig. 5). A slight decrease in the amount of catalyst from 0.501 g to 0.439 g was due to sampling losses from time to time. ICP analysis confirmed that no detectable metal leaching was observed. Hence, a marginal decrease in the activity for transfer hydrogenation could be due to a lower availability of metallic sites. This indicated that our catalyst was active, recyclable and stable under aqueous phase hydrogenation of bio-derived platform molecules.


image file: c3ra46495d-f5.tif
Fig. 5 Catalyst recovery and its recyclability. Reaction conditions: levulinic acid (43 mmol): formic acid (43 mmol); solvent, water (90 mL); temperature, 493 K; N2 atm; catalyst, 0.5 g; catalyst[thin space (1/6-em)]:[thin space (1/6-em)]substrate ratio, (1[thin space (1/6-em)]:[thin space (1/6-em)]10) reaction time, 5 h.

Conclusions

In summary, we have successfully developed an efficient bimetallic and magnetically separable Ag–Ni/ZrO2 catalyst for the transfer hydrogenation of LA with complete conversion and selectivity to GVL. The synergism between both the metals was responsible for H2 generation from formic acid and also for in situ hydrogenation of LA. For both LA and its esters, hydrogenation proceeded smoothly to GVL, confirming the bifunctional role of the catalyst in the cyclization of 4-hydroxy LA esters. The generality of this catalyst was well demonstrated for the one-pot hydrogenation of biomass derived C3 to C6 molecules to a variety of useful molecules with almost complete conversions and >80% selectivities. Due to its magnetic nature, the recovery of the catalyst was very easy and it could be recycled up to five times, neither losing its activity nor exhibiting any metal leaching.

Materials

Levulinic acid (LA, 98%), γ-valerolactone (GVL, 98%), formic acid (FA, 97%), fructose (99%), glucose (99%), sucrose (99%), starch (soluble), cellulose (microcrystalline), were purchased from Sigma-Aldrich, Bangalore, India. Copper nitrate, silver nitrate and zirconium nitrate were purchased from Loba Chemie, Mumbai, India. Hydrogen (>99.99% purity) was obtained from Inox, India.

Catalyst preparation

The Ag–Ni/ZrO2 catalyst was prepared by the co-precipitation method in which 0.05 M aqueous solutions of each Ag(NO3)2, Ni(NO3)3·6H2O and Zr(NO3)3·3H2O were taken and precipitated using 0.2 M aqueous potassium carbonate at room temperature. The precipitate was aged further for 6 h at room temperature. Then the precipitate was separated by filtration and washed with deionized water to remove traces of potassium. The precipitate thus obtained was dried in a static air oven at 373 K for 8 h and calcined at 673 K for 4 h. Prior to the reaction, the calcined catalyst was reduced under H2 pressure.

All other catalysts tested (ZrO2, Ag/ZrO2, Ni/ZrO2 and Ru/ZrO2) were prepared by a co-precipitation and impregnation method. The required amounts of each Ag, Ni and Zr nitrate precursors were dissolved in deionized water and precipitated using 0.2 M aqueous potassium carbonate at room temperature. The precipitate was aged further for 6 h at room temperature. Then the precipitate was separated by filtration and washed with deionized water to remove traces of potassium. The precipitate thus obtained was dried in a static air oven at 373 K for 8 h and calcined at 673 K for 4 h. Prior to the reaction; the calcined catalyst was reduced in a H2 gas flow.

The supported Ru/ZrO2 catalyst was prepared by an impregnation method. The synthesis was performed by suspending 2 g of prepared zirconia in an aqueous medium using a calculated amount of the metal precursor (RuCl3·3H2O) and then the suspension was stirred for 1 h. It was subsequently reduced using 5 mL of NaBH4 (1 mol) as a reducing agent. The catalyst was filtered and dried at 110 °C for 12 h.

Hydrogenation of LA–FA to GVL

The hydrogenation reactions were carried out in a 300 mL capacity autoclave (Parr Instruments Co., USA) at a stirring speed of 1000 rpm. The typical hydrogenation conditions were: temperature, 473 K; LA concentration, 5 wt%; solvent, 95 mL; total volume, 100 mL; catalyst loading, 0.5 g; substrate[thin space (1/6-em)]:[thin space (1/6-em)]catalyst molar ratio, (10[thin space (1/6-em)]:[thin space (1/6-em)]1). The catalysts were pre-reduced under H2 at 573 K for 12 h and then stored in a vacuum desiccator. Liquid samples were withdrawn periodically and analyzed using a GC Thermo-scientific Trace-700 with a HP-5 column and a FID detector.

Hydrogenation of C3–C6 bio-derived components

The hydrogenation reactions were carried out in a 300 mL capacity autoclave (Parr Instruments Co., USA) at a stirring speed of 1000 rpm. The typical hydrogenation conditions were: temperature, 473 K; concentration (C3 to C6 platform molecules), 5 wt%; solvent, 95 mL; total volume, 100 mL; catalyst loading, 0.5 g; substrate[thin space (1/6-em)]:[thin space (1/6-em)]catalyst molar ratio, 10[thin space (1/6-em)]:[thin space (1/6-em)]1. The catalysts were pre-reduced under H2 at 573 K for 12 h and then stored in a vacuum desiccator. Liquid samples of C5 (methyl levulinate, ethyl levulinate) and C6 (5-methyl furfural) hydrogenation were withdrawn periodically and analyzed using a GC Thermo-scientific Trace-700 with a HP-5 column, and liquid products of C3 (Lactic acid, Acetol and glycerol) hydrogenation were analyzed on a Shimadzu GC-2025 gas chromatograph equipped with a capillary column HP-FFAP (30 m × 0.25 mm) and FID detector.

Decomposition of formic acid

The FA decomposition reactions were carried out in a 300 mL capacity autoclave (Parr Instruments Co., USA) at a stirring speed of 1000 rpm. The typical hydrogenation conditions were: temperature, 473 K; FA concentration, 5 wt%; solvent, 95 mL; total volume, 100 mL; catalyst loading, 0.5 g; substrate[thin space (1/6-em)]:[thin space (1/6-em)]catalyst molar ratio, 10[thin space (1/6-em)]:[thin space (1/6-em)]1. After the reaction, the concentration of residual FA was analyzed using a HPLC (Iris32, Chemito instruments pvt. Ltd) system consisting of an aminex column and a refractive index detector. H2SO4 (0.5 M) was used as the mobile phase at a flow rate of 1 mL min−1. Both the column temperature and the detector temperature were 40 °C. The gaseous products were analyzed using a gas chromatography (GC) analyzer equipped with a PORAPAK-Q column and a thermal conductivity detector (TCD). The carrier gas was argon.

Acknowledgements

One of the authors, AMH thanks the Council of Scientific and Industrial Research (CSIR) New Delhi, for the award of a senior research fellowship.

Notes and references

  1. (a) G. W. Huber, S. Iborra and A. Corma, Chem. Rev., 2006, 106, 4044–4048 CrossRef CAS PubMed; (b) J. P. Lange, Catalysis for Renewables: From Feedstock to Energy Production, ed. G. Centi and R. A. van Santen, Wiley-VCH, Weinheim, 2007, pp. 21–51 Search PubMed; (c) J. P. Lange, Biofuels, Bioprod. Biorefin., 2007, 1, 39–48 CrossRef CAS; (d) M. E. Himmel, S.-Y. Ding, D. K. Johnson, W. S. Adney, M. R. Nimplos, J. W. Brady and T. D. Foust, Science, 2007, 315, 804–807 CrossRef CAS PubMed.
  2. (a) J. J. Bozell, L. Moens, D. C. Elliott, Y. Wang, G. G. Neuenscwander, S. W. Fitzpatrick, R. J. Bilski and J. L. Jarnefeld, Resour., Conserv. Recycl., 2000, 28, 227–239 CrossRef; (b) J. C. Shen and C. E. Wyman, AIChE J., 2012, 58, 236–246 CrossRef CAS; (c) S. W. Fitzpatrick, US Pat., US 5608105, 1997; (d) D. J. Hayes, S. Fitzpatrick, M. H. B. Hayes and J. R. H. Ross, Biorefineries: Industrial Processes and Products, Wiley-VCH, Weinheim, 2006, vol. 1, pp. 139–164 Search PubMed.
  3. (a) J. Q. Bond, D. M. Alonso, D. Wang, R. M. West and J. A. Dumesic, Science, 2010, 327, 1110–1114 CrossRef CAS PubMed; (b) J. P. Lange, R. Price, P. M. Ayoub, J. Louis, L. Petrus, L. Clarke and H. Gosselink, Angew. Chem., Int. Ed., 2010, 49, 4479–4483 CrossRef CAS PubMed; (c) J. Q. Bond, D. M. Alonso, R. M. West and J. A. Dumesic, Langmuir, 2010, 26, 16291–16298 CrossRef CAS PubMed; (d) J. Q. Bond, D. Wang, D. M. Alonso and J. A. Dumesic, J. Catal., 2011, 281, 290–299 CrossRef CAS PubMed; (e) I. T. Horvath, Green Chem., 2008, 10, 1024–1028 RSC; (f) I. T. Horvath, H. Mehdi, V. Fabos, L. Boda and L. T. Mika, Green Chem., 2008, 10, 238–242 RSC.
  4. (a) B. Loges, A. Boddien, H. Junge and M. Beller, Angew. Chem., Int. Ed., 2008, 120, 4026–4029 (Angew. Chem., Int. Ed., 2008, 47, 3962–3965) CrossRef; (b) C. Fellay, P. J. Dyson and G. Laurenczy, Angew. Chem., Int. Ed., 2008, 120, 4030–4032 (Angew. Chem., Int. Ed., 2008, 47, 3966–3968) CrossRef; (c) Y. Himeda, Green Chem., 2009, 11, 2018–2022 RSC; (d) M. Grasemann and G. Laurency, Energy Environ. Sci., 2012, 5, 8171–8181 RSC.
  5. L. Deng, J. Li, D. M. Lai, Y. Fu and Q. X. Guo, Angew. Chem., Int. Ed., 2009, 48, 6529–6532 CrossRef CAS PubMed.
  6. (a) X. Gu, Z. H. Lu, H. L. Jiang, T. Akita and Q. Xu, J. Am. Chem. Soc., 2011, 133, 11822–11825 CrossRef CAS PubMed; (b) Y. Huang, X. Zhou, M. Yin, C. Liu and W. Xing, Chem. Mater., 2010, 22, 5122–5128 CrossRef CAS.
  7. (a) A. Gazsi, T. Bansagi and F. Solymosi, J. Phys. Chem. C, 2011, 115, 15459–15466 CrossRef CAS; (b) S. Zhang, O. Metin, D. Su and S. Sun, Angew. Chem., Int. Ed., 2013, 52, 681–3684 Search PubMed; (c) L. He, Y. Huang, A. Wang, X. Wang, X. Chen, J. J. Delgado and T. Zhang, Angew. Chem., Int. Ed., 2012, 51, 6191–6194 CrossRef CAS PubMed; (d) W. F. Chen, K. Sasaki, C. Ma, A. I. Frenkel, N. Marinkovic, J. T. Muckerman, Y. Zhu and R. R. Adzic, Angew. Chem., Int. Ed., 2012, 51, 6131–6135 CrossRef CAS PubMed.
  8. Z. L. Wang, J. M. Yan, Y. Ping, H. L. Wang, W. T. Zheng and Q. Jiang, Angew. Chem. Int. Ed., 2013, 52, 1–5 CrossRef.
  9. X. L. Du, L. He, S. Zhao, Y. M. Liu, Y. Cao, H. Y. He and K. N. Fan, Angew. Chem., Int. Ed., 2011, 50, 7815–7819 CrossRef CAS PubMed.
  10. J. Yuan, S. S. Li, L. Yu, Y. M. Liu, Y. Cao, H. Y. He and K. N. Fan, Energy Environ. Sci., 2013, 6, 3308–3313 CAS.
  11. R. He, X. Qian, J. Yin and Z. Zhu, J. Mater. Chem., 2007, 12, 3783–3786 RSC.
  12. H. Guo, Y. Chen, X. Chen, R. Wen, G. H. Yue and D. L. Peng, Nanotechnology, 2011, 22, 195604–195612 CrossRef PubMed.
  13. Z. Zhang, T. M. Nenoff, K. Leung, S. R. Ferreira, J. Y. Huang, D. T. Berry, P. P. Provencio and R. Stumpf, J. Phys. Chem. C, 2010, 114, 14309–14318 CAS.
  14. A. M. Hengne and C. V. Rode, Green Chem., 2012, 14, 1064–1072 RSC.
  15. F. C. Lizana, S. G. Quero, G. Jacobs, Y. Ji, B. H. Davis, L. Kiwi-Minsker and M. A. Keane, J. Phys. Chem. C, 2012, 116, 11166–11180 Search PubMed.
  16. V. Nichelea, M. Signorettoa, F. Menegazzoa, A. Gallob, V. D. Santoc, G. Crucianid and G. Cerratoe, Appl. Catal., B, 2012, 111, 225–232 CrossRef PubMed.
  17. (a) K. A. Bethke and H. H. Kung, J. Catal., 1997, 172(1), 93 CrossRef CAS; (b) M. Tsuji, M. Hashimoto and T. Tsuji, Chem. Lett., 2002, 31, 1232–1234 CrossRef; (c) T. Bala, S. D. Bhame, P. A. Joy, B. L. V. Prasad and M. J. Sastry, Mater. Chem., 2004, 14, 2941–2945 RSC; (d) D. Zhao and B. Q. Xu, Angew. Chem., Int. Ed., 2006, 45, 4955–4959 CrossRef CAS PubMed.
  18. P. Prieto, V. Nistor, K. Nouneh, M. Oyama, M. Abd-Lefdil and R. Díaz, Appl. Surf. Sci., 2012, 258, 8807–8813 CrossRef CAS PubMed.

Footnote

Electronic supplementary information (ESI) available. See DOI: 10.1039/c3ra46495d

This journal is © The Royal Society of Chemistry 2014
Click here to see how this site uses Cookies. View our privacy policy here.