Direct analysis of in vitro grown microorganisms and mammalian cells by ambient mass spectrometry
Konstantin Chingin,
Juchao Liang and
Huanwen Chen*
Jiangxi Key Laboratory for Mass Spectrometry and Instrumentation, East China Institute of Technology, Room 804, Sci. & Tech. Building, 418 Guanglan Road, Nanchang 330013, Jiangxi 330013, P.R. China. E-mail: chw8868@gmail.com; Fax: +86 791-83896370; Tel: +86 791-8387-9275
First published on 16th December 2013
Abstract
Mass spectrometry (MS) is a firmly established method for in vitro cell studies with numerous applications documented in the literature. Considerable sample pretreatment is normally required for MS cell analysis assisted by classic ionization techniques including electrospray ionization (ESI), electron-impact ionization (EI), matrix-assisted laser desorption/ionization (MALDI), chemical ionization (CI), etc. The speed and throughput of mass spectrometric analysis have been dramatically improved with the emergence of ambient sampling methods, requiring little-to-no sample preparation for virtually any type of biological samples. Direct chemical sampling makes MS analysis simpler, faster and less invasive to living objects. To date, considerable experimental evidence has been accumulated that strongly indicates the broad applicability of ambient mass spectrometry (AMS) in different areas of cell research. Particular areas include early detection and rapid classification of pathogenic bacteria, authentication of cancer cell lines, drug/therapy development, biomarker discovery, clinical diagnosis, as well as the mechanistic studies of cellular metabolism and cell–host interactions. In this review, we summarize recent AMS studies on in vitro grown cells of microorganisms and mammals and systematically describe current analytical strategies, technologies and achieved results. The perspective of ambient mass spectrometry for this particular field is also discussed.
Introduction
Studies of isolated microorganisms and animal cells grown in the laboratory under controlled conditions in vitro are indispensable in molecular biology and medicine. Cell cultures serve as models to develop efficient diagnostics and therapy of diseases as well as to improve our understanding of cellular metabolism.1–3 Conventional biochemical assays to characterize cell cultures commonly suffer from the low sensitivity and specificity of analysis, which makes them time-consuming and prone to errors.4,5 Alternatively, cells can be examined by a wide selection of analytical methods, including chemical sensing, optical spectroscopy, “electronic noses”, etc.6–13 These methods allow reliable distinction between cell cultures of different origin or between cells grown under different physiological conditions, but they often lack the required chemical specificity of analysis. Beneficial to the aforementioned methods, mass spectrometry (MS) combines ultrasensitive and high-mass-resolution detection with excellent molecular specificity, which greatly enhances the speed and information capacity of analysis. MS has become one of the central techniques in cellular proteomics and metabolomics for the identification of biomarkers, drug discovery and metabolic pathway analysis.14–20 However, common MS-based workflows are rather complicated and include many laborious steps such as cell lysis, enzymatic digestion, purification, labeling, as well as 2D gel, ultra-pressure liquid chromatography (UPLC) or gas chromatography (GC) separation. Matrix-assisted laser desorption/ionization mass spectrometry (MALDI-MS) for the rapid and simple fingerprinting of bacteria is by far the most popular in vitro application of MS.21–25Ambient sampling gave rise to the entire new field of ambient mass spectrometry (AMS).26–31 In AMS, samples are analyzed without pretreatment directly from their native environment. Ambient methods found broad application in biological studies because they allow direct, rapid and simple MS analysis of complex matrices, e.g., human urine or blood.32,33 AMS imaging of biological tissues in open air without sample pre-treatment is a rapidly developing field.34–36 Many ambient ion sources are non- or low-invasive and are therefore particularly suitable for in vivo studies of living objects, such as bacteria,37–39 plants,36,37,40–42 animals41,43,44 or humans.45–47 Noninvasive real-time AMS analysis was also applied for the intraoperative molecular diagnosis of tumors and tissue identification.48–50 In vivo analyses of biological systems by AMS are summarized in recent review papers.51,52
AMS analysis of in vitro grown cell cultures allows investigation of cellular metabolism with greater simplicity compared to the traditional methods. Molecular fingerprints of isolated bacterial and human cells offer a benchmark for the identification and classification of corresponding species. Over recent years, a variety of AMS approaches have been developed to characterize in vitro grown cells of microorganisms and mammals with little-to-no sample preparation, extraction, or pre-separation (Tables 1 and 2). The data accumulated to date indicate the broad applicability of AMS in different areas of cell research, such as classification of isolated bacteria, authentication of cancer cell lines, drug/therapy development, biomarker discovery, clinical diagnosis, as well as the mechanistic studies of cellular metabolism and cell–host interactions. In this review we summarize the recent studies and systematically describe current analytical strategies, technologies and the achieved results. Finally, the emerging trend for the analysis of single cells with ambient MS is highlighted, and current limitations are discussed.
| Method | Principle | VOCs | Non-VOCs | Highlights | ||
|---|---|---|---|---|---|---|
| Microbes | Mammal cells | Microbes | Mammal cells | |||
| SIFT-MS | Chemical ionization (CI) of vapors by H3O+, NO+ and O2+· | 68, 69, 77, 98–101 and 106 | 65, 110–112 | Quantitative detection of hydrogen cyanide from Pseudomonas aeruginosa. In situ profiling of competition between various species in real time. Studies of cancer cell metabolism in vitro. | ||
| PTR-MS | CI of vapors by H3O+ | 61, 66, 75, 76 and 93 | 78 and 113 | Measuring metabolic response to external factors in real time. Monitoring fermentation process. In vitro identification of lung cancer cells based on VOC fingerprint. | ||
| IMR-MS | CI of vapors by Kr+, Hg+ or Xe+ | 64 and 67 | Broad molecular range of detection. Rapid identification of Gram-positive and Gram-negative bacteria by VOC fingerprints. | |||
| SESI-MS | Ionization of vapors by ESI | 63, 82 and 109 | Comparison between in vitro and in vivo VOC fingerprints of pathogenic species. Easily implemented on any ESI-MS instrument. | |||
| DESI-MS | Desorption/ionization by pneumatic ESI | 115, 118, 119, 129 and 130 | Tolerate high salt concentration in the culture medium. Direct spatial profiling of chemical gradients in a growing culture. Single-cell analysis. Broad molecular range. | |||
| DART-MS | Desorption/ionization by gas plasma | 121 and 132 | Rapid non-targeted screening for the identification of cellular metabolites. | |||
| LTP-MS | Desorption/ionization by gas plasma | 117 | Rapid identification of bacterial strains on the species and subspecies level. Low-temperature desorption. High stability. | |||
| REIMS | Desorption/ionization by RF current | 116 | Identification of clinical isolates directly from the agar plate without sample prep. Rich chemical capacity. | |||
| LAESI-MS | Desorption by IR irradiation; Ionization by ESI | 122 | 120 and 133 | Observation of proteins. Analysis of small cell populations down to single-cell. In vitro metabolism of virus-infected human cells. Suitable for the direct analyses of cells cultured in aqueous media. | ||
| Microbes | Acinetobacter,67 Anabaena,122 Bacillus,117,118 Citrobacter,116 Coxiella,132 Enterobacter,67 Enterococcus,64 Escherichia coli,67,77,93,109,116–118,132 Klebsiella,67,116 Malbranchea,121 Mycobacterium,75 Proteus,67,116 Pseudomonas,67,69,82,101,106,116 Salmonella,109,117,118 Serratia,67,77,116 Staphylococcus,64,66,82,109,116–118 Streptococcus,116,132 Synechococcus,115 Thalassiosira76 |
| Cell lines | 293T (kidney epitelium),133 35FL121 Tel+ (lung fibroblast),111 A-549 (lung epitelium),78,113 BCBL-1 (B-lymphocytes),120 BEAS-2B (bronchial epithelium),113 BJAB (B-lymphocytes),120 C81 (T-lymphocytes),133 CALU-1 (lung carcinoma),111,112 CEM (T-lymphocytes),133 EPLC-M1 (lung carcinoma),113 H9 (T-lymphocytes),133 HepG2 (hepatocellular carcinoma),65 MSC (mesenchymal stem cells),65 NL20 (lung epithelium),111,112 TERTR-PE1 (retinal epitelium)78,113 |
| Volatile analytes | Acetaldehyde,65,75,77,93,110–113 acetic acid,77 acetoin,77 acetone,75,77 acetophenone,106 ammonia,77 carbon dioxide,110 dimethyl sulfide,65,76 ethanol,75,77 hydrogen cyanide,69,101 isoprene,76 methyl-butanone,106 methyl thioacetate,106 methyl thiobutanoate,106 propanol,77 fatty acids116 |
| Non-volatile analytes | Alkaloids,121 amino acids,122,133 dopamine,133 fatty acid esters,117,132 glucosylglycerol,115 homovallinic acid,133 lipids,115,116,118,120,122,133 nucleotides,122,133 phosphatidic acids,116 phosphatidylethanolamine,116 proteins,120,122 sugars115,122 |
Analysis of volatile metabolites
Both microorganisms and mammalian cells are known to have characteristic smells due to the specific profile of volatile organic compounds (VOCs) released as part of their metabolism.53–55 Hence is the sustained interest to the analysis of VOCs released by cell cultures.7–12,53,56–72 Unique VOC fingerprint can be used as a biomarker for the identification of microorganisms or animal cell lines. Identification by fingerprinting is usually much more accurate and reliable compared to the identification based on just one biomarker metabolite.73,74 The difference in fingerprints can be visualized by statistical analysis such as PCA. However, chemical identification of biomarker signals is essential to validate their use in clinical studies. Because VOC sampling inflicts minimal alterations to the culturing conditions, it can be a convenient approach to monitor metabolic changes continuously in real time,75–78 e.g., in response to antibiotic/drug treatment, nutrient deprivation, light, or other environmental factors. Particularly intriguing is the possibility of direct comparison between in vitro studies on isolated cell cultures and in vivo measurements of VOC metabolites,79–82 e.g., released with breath or emanated from skin.45,46 Such integrated approach can be used for diagnostics purpose, e.g., identification of pathogens or cancer. Finally, chemical identification of VOC metabolites is important to develop simple, inexpensive and reliable VOC sensor arrays for the early targeted detection of pathogen biomarkers in blood cultures and authentication of animal cell lines.83–85Delicate approach is required in order to interrogate in vitro grown cells without harmful effects. The major figures of merit associated with sampling volatile metabolites include non-invasiveness, ease of practical implementation and toxicological safety. Over decades, the combination of gas chromatography with electron-impact ionization mass spectrometry (GC-MS) has been essentially the only available tool to probe the headspace of cell cultures by MS.86,87 However, this mode of VOC analysis is time-consuming and cannot be implemented in real time. Furthermore, sensitive and surface-active metabolites can undergo chemical transformation upon sample collection and storage.88
The situation started to change with the invention of selected-ion flow-tube mass spectrometry (SIFT-MS)88–90 and proton-transfer reaction mass spectrometry (PTR-MS).91–93 These methods allow real-time profiling of VOC metabolites without the need for chromatographic separation, sample collection and regular calibration. Beneficially, SIFT-MS and PTR-MS were developed into commercial products. Commercial instruments offer accurate quantitative detection of volatile compounds, which is an essential requirement if these MS techniques are to be used in clinical diagnosis. Both SIFT-MS and PTR-MS have very similar principle of operation.94 In SIFT-MS, primary reagent ions are isolated from microwave air plasma using a quadrupole mass filter and transferred into the reaction flow tube with helium gas flow at a pressure of ∼1 Torr. Most common reagent ions in SIFT-MS include H3O+, NO+ and O2+ because they can efficiently ionize many gas molecules but have little reactivity toward the major air components, i.e. nitrogen, oxygen, etc. Sample vapor is introduced into the flow tube via a heated sampling tube. Secondary analyte ions are produced by chemical ionization (CI) with the primary reagent ions and are transferred into analytical quadrupole for mass detection. PTR-MS is different from SIFT-MS in that it typically employs water vapor to produce primary H3O+ ions and that primary ions are not pre-isolated in a quadruple mass filter. Later, another CI-based method called ion-molecule reaction mass spectrometry (IMR-MS) has been introduced for the direct analysis of VOCs.95,96 IMR-MS uses chemical ionization of volatile molecules by Kr+, Hg+ or Xe+ primary ions and thereby extends the molecular range of detection up to the ionization energy of Kr (14 eV). Secondary ions in IMR-MS are mass analyzed using quadrupole ion optics, similar to PTR-MS and SIFT-MS. The method features no or only minimal fragmentation.95 Most recently, secondary electrospray ionization mass spectrometry (SESI-MS) has been developed for the analysis of vapors.46,97 In SESI-MS, vapor molecules are ionized by electrospray droplets of organic solvent mixture, e.g., water/methanol in front of MS inlet. Similar to PTR-MS, ionization of analyte molecules in SESI-MS is usually achieved by protonation. However, ionization in SESI-MS occurs in the ambient environment in front of a mass spectrometer rather than in a reaction chamber, like in SIFT-MS, PTR-MS or IMR-MS. Therefore, SESI-MS can be implemented on any type of MS instrument with atmospheric pressure ionization interface, which makes it more versatile for VOC studies. Provided the appropriate type of mass spectrometer has been adapted for SESI, selected peaks can be fragmented for chemical identification, which is another distinct advantage of the method. A number of other AMS approaches are available for VOC analysis but, to our knowledge, those have not yet been applied to bacterial and mammal cell cultures. Note that PTR-MS and SIFT-MS are sometimes considered separately from other AMS methods, because they require accordingly designed mass spectrometers and are difficult to interface with most popular instruments.52 Nevertheless, sampling in PTR-MS and SIFT-MS is implemented in the ambient environment, allowing direct real-time measurements without sample preparation. Hence, we included PTR-MS and SIFT-MS applications in the scope of this review.
Continuous, real-time monitoring of VOC metabolites from the headspace of growing cultures is achieved with dedicated sampling interfaces, e.g., as illustrated in Fig. 1a. The cell-containing medium is incubated in a sealed fermenter or other container vented by a gas flow with controlled composition chosen to best mimic in vivo environment for specific cells. For example, for the growth of lung cancer lines a mixture of clean air (95%) and CO2 (5%) is normally used, which corresponds to the composition of exhaled human breath. Particle filters prevent possible chemical contamination of the media by impurities originated from the gas supply or desorbed material from transfer tubing. The cells are grown under controlled temperature (normally 37 °C), nutrient supply and disposal. Agitation of media volume is often applied to prevent cell coagulation and minimize adhesion to the fermenter walls. VOC metabolites are continuously transferred with the gas flow out of the headspace volume into the outlet tubing line for ionization and MS detection. Alternatively, if the real-time profile of headspace VOCs is not necessary, conventionally grown cell culture can be removed out from the incubation chamber for a rapid noninvasive VOC inspection by AMS and then returned back with minimal adverse consequences (Fig. 1b). Such format of sampling is practical for slowly growing mammalian cells, which are prone to contamination, or/and when rapid MS fingerprinting of a cell culture is demanded.
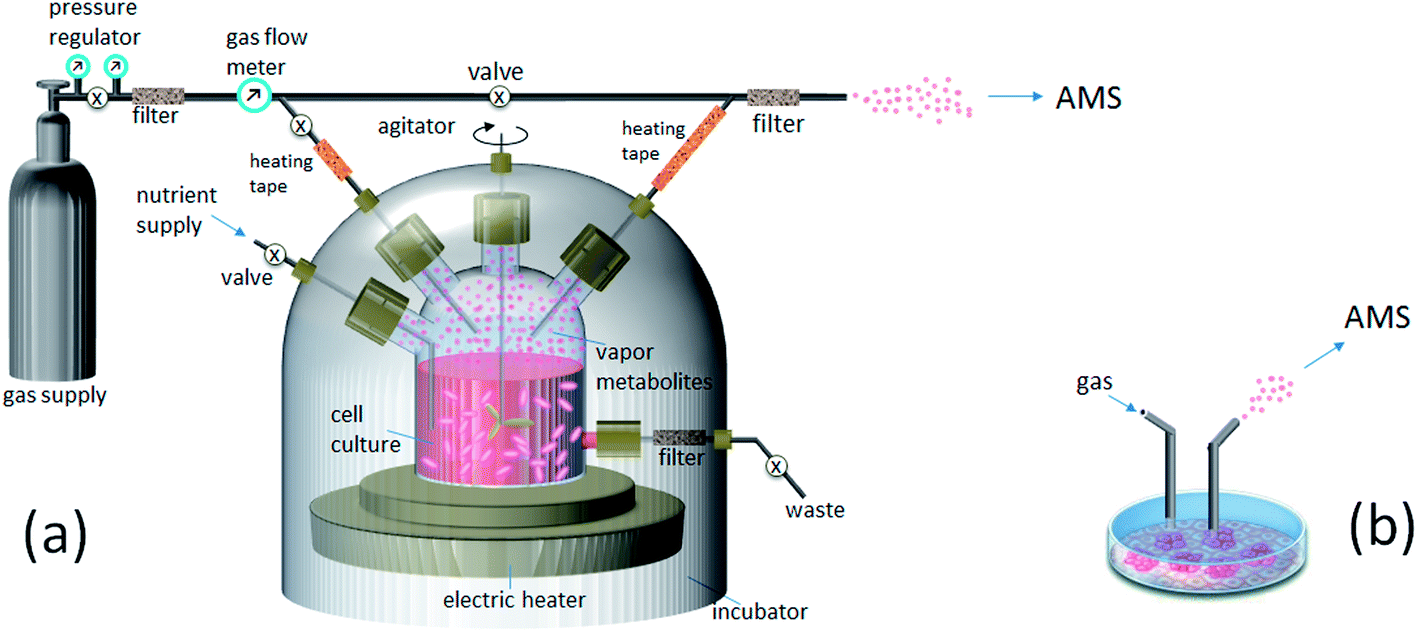 | ||
| Fig. 1 Sampling VOC metabolites from a growing cell culture for ambient mass spectrometry (AMS): (a) from a fermenter; (b) from a plate. | ||
1. Analysis of microbial cultures
SIFT-MS is the most widely applied AMS method for the analysis of microbial VOCs.20,69,77,89,90,98–106 Using SIFT-MS, Carroll et al. studied VOCs emitted by Pseudomonas aeruginosa (PA) cultures derived from the sputum samples of 21 patients with cystic fibrosis (CF).69 The cultures were grown on blood agar with Pseudomonas-selective media for 48 h at 37 °C inside sealed plastic bags. Among many other VOCs, hydrogen cyanide (HCN) was revealed at the ppm level (Fig. 2). Even though fragmentation capabilities of SIFT-MS are limited, protonated H2CN+ cation was unambiguously identified because the three other possible ions at m/z 28, i.e., N2+, CO+ and C2H4+, could not be generated under the same experimental conditions. In the absence of spectral interferences, HCN was detected by SIFT-MS with high sensitivity and quantified with high accuracy. This study promoted extensive research on the detection of HCN in PA cultures101 and in the breath of patients with PA infection.102–104 As a result, breath HCN was established as a reliable biomarker for PA infection in humans. The timeline for this research is given in a recent review paper by Smith et al.105 Recently, Shestivska et al. combined VOCs with particularly high specificity to PA, such as 3-methyl-butanone, acetophenone, methylthioacetate and methyl thiobutanoate, in a reference SIFT-MS fingerprint for in vivo identification of various PA strains with higher specificity compared to a single biomarker.106 Interestingly, quantitative SIFT-MS analysis revealed that the production rates of volatile metabolites, including HCN, from genotypically diverse PA strains vary by two orders of magnitude under the same culturing conditions.101,106 Similar variability was observed for liquid and solid media. Besides the mere identification purposes, quantitative SIFT-MS was also demonstrated as a valuable tool to probe mechanistic aspects of bacterial metabolism. Sovova et al. monitored the real-time population dynamics of three different bacterial species, Serratia rubidaea (R), Serratia marcescens (F) and Escherichia coli (Ec), growing in liquid media.77 The concentrations of VOC metabolites (ammonia, ethanol, acetaldehyde, propanol, acetoin, acetone and acetic acid) were measured in the headspace of the individual species and of their mixtures continuously for 24 h periods. The three bacterial species were found to interact with each other in a competitive fashion in a way similar to the game “rock-paper-scissors” (R-Ec-F).77 | ||
| Fig. 2 The average concentrations of some VOCs determined by SIFT-MS in the headspace of sterile media (left, yellow bars) and Pseudomonas aeruginosa plate cultures (right, blue bars). The statistical significance of the increase in ammonia and HCN is below 0.01 as indicated by **. Adapted from ref. 105. | ||
As a tool for quantitative detection of VOCs in real-time, PTR-MS has similar capabilities to SIFT-MS. PTR-MS is widely established in environmental and food chemistry research, but its biomedical applications are fairly recent. Using PTR-MS, Crespo et al. monitored the headspace of growing Mycobacterium smegmatis cultures in real time in response to the addition of antibiotics ciprofloxacin and gentamicin.75 Following the emission patterns of the mycobacteria over time allowed detection of volatile markers specific for the bacterial response, e.g., acetaldehyde (m/z 45). Antibiotic-specific response was evident already 3 h after the treatment and varied between isolates with different resistance phenotypes. The early observation of metabolic response indicated the high sensitivity of PTR-MS diagnostics compared to traditional biochemical assays. The high signal stability in PTR-MS allows observations of VOCs emitted by microorganisms over long time intervals, and therefore even slow metabolic changes can be revealed in real time. Kameyama et al. used PTR-MS to continuously monitor VOC emission from the marine diatom Thalassiosira pseudonana in an axenic batch culture system under a 13![[thin space (1/6-em)]](https://www.rsc.org/images/entities/char_2009.gif) :11 h light–dark cycle.76 The authors found that the intensity of signal at m/z 69, tentatively assigned to isoprene, rapidly changed upon the light–dark and dark–light transitions, suggesting a crucial role of light in the production of this metabolite. In contrast, the intensity of signal at m/z 63, tentatively assigned to dimethyl sulfide (DMS), did not reveal clear diurnal variation during the early incubation period. The observed light response for DMS was found similar to that in senescent cells rather than vegetative cells. Therefore, DMS production in the studied Thalassiosira pseudonana culture was attributed to cell aging and/or cell death. The authors suggested that, along with the other microbial processes, aging or death of phytoplankton cells could mediate an important role in the regulation of DMS production in natural waters.76 Recently, Luchner et al. developed an interface to analyze the headspace of bioreactors with PTR-MS. To proof-test the platform, recombinant E. coli strain was cultured in a 20 L bioreactor in a fed-batch mode for 20 h, and the emitted VOCs were monitored by PTR-MS in real time (Fig. 3). Highly reproducible PTR-MS profiles were recorded during three identical cultivations for chemicals in the broad concentration range of ca. 10–10000 ppb, indicating the high potential of PTR-MS to reliably monitor large-scale fermentation processes.93
:11 h light–dark cycle.76 The authors found that the intensity of signal at m/z 69, tentatively assigned to isoprene, rapidly changed upon the light–dark and dark–light transitions, suggesting a crucial role of light in the production of this metabolite. In contrast, the intensity of signal at m/z 63, tentatively assigned to dimethyl sulfide (DMS), did not reveal clear diurnal variation during the early incubation period. The observed light response for DMS was found similar to that in senescent cells rather than vegetative cells. Therefore, DMS production in the studied Thalassiosira pseudonana culture was attributed to cell aging and/or cell death. The authors suggested that, along with the other microbial processes, aging or death of phytoplankton cells could mediate an important role in the regulation of DMS production in natural waters.76 Recently, Luchner et al. developed an interface to analyze the headspace of bioreactors with PTR-MS. To proof-test the platform, recombinant E. coli strain was cultured in a 20 L bioreactor in a fed-batch mode for 20 h, and the emitted VOCs were monitored by PTR-MS in real time (Fig. 3). Highly reproducible PTR-MS profiles were recorded during three identical cultivations for chemicals in the broad concentration range of ca. 10–10000 ppb, indicating the high potential of PTR-MS to reliably monitor large-scale fermentation processes.93
 | ||
| Fig. 3 Highly-reproducible time profiles of typical PTR-MS signals measured in a broad intensity range during three recombinant E. coli fed-batch cultivations. The signals at m/z 45, m/z 33 and m/z 69 were tentatively assigned to acetaldehyde, methanol and isoprene, accordingly. Adapted from ref. 93. | ||
Owing to its high sensitivity and softness, IMR-MS is widely applied to analyze VOCs in exhaled breath.107,108 Recently, a project has been initiated aiming to evaluate the suitability of VOC fingerprinting by IMR-MS as a diagnostic tool for bacterial infections. In a pilot study, Dolch et al. analyzed VOCs from selected Gram-positive bacteria that are frequently isolated in blood culture samples, namely, Enterococcus faecalis, Enterococcus faecium, Staphylococcus aureus, and Staphylococcus epidermidis.64 Using IMR-MS, characteristic VOC profile could be detected for E. faecalis already 8 h after incubation. After 24 h of incubation, all the studied species could be differentiated by hierarchic clustering and principal component analysis (PCA) of generated MS fingerprints. The focus of the study was to achieve rapid differentiation of bacterial species with the possibility of workflow automation, while the identification of biomarker signals was not attempted. The study was successfully extended to differentiation of Gram-negative bacteria, Acinetobacter baumannii, Enterobacter cloacae, E. coli, Klebsiella oxytoca, P. aeruginosa, Proteus vulgaris and Serratia marcescens, with similar speed of identification by IMR-MS.67
SESI-MS is the most recent AMS technique for vapor analysis. Based on characteristic VOC fingerprints recorded by SESI-MS, Zhu et al. were able to detect and separate a group of 11 pathogenic E. coli strains from two major foodborne bacteria, Staphylococcus aureus and Salmonella Typhimurium in three food modeling media.109 Heatmap analysis revealed six core peaks (m/z of 65, 91, 92, 117, 118 and 119) present at a similar intensity in all 11 E. coil strains. These peaks were proposed to be conserved VOC biomarkers for E. coil species. Notable signals were observed just 4 h after incubation, indicating the high sensitivity of approach. In another study from the same group, Zhu et al. investigated volatile metabolites of P. aeruginosa (strains PAO1, FRD1) and S. aureus (RN450) cultured in vitro by SESI-MS to identify characteristic spectral patterns. In vitro studies were followed by SESI-MS breath analysis of infected mice to collect MS fingerprints of corresponding bacteria species in vivo. Interestingly, it was found that only 25–34% of peaks were shared between the in vitro and in vivo SESI-MS fingerprints. This significant difference can be attributed to a combination of factors including altered bacterial metabolism inside a host, generation of new metabolites specific to pathogen–host interaction, and lower sensitivity of SESI-MS to detect VOCs from breath compared to cell culture.82 The study underscored the challenges of in vitro models to predict in vivo responses.
2. Analysis of mammalian cell lines
Compared to microorganisms, VOCs of mammalian cells are less studied. Mammalian cell cultures grow much slower, are more difficult to handle, prone to contamination, and more expensive than bacteria. Nevertheless, a number of recent studies indicate that the sensitivity of SIFT-MS and PTR-MS is sufficient to directly characterize VOCs emitted by cell lines. The level of acetaldehyde (AA) emission has been proposed as a potential indicator to differentiate normal and cancer cells. Using quantitative SIFT-MS analysis, Smith and coworkers explored the release of AA (m/z 45) and other volatile metabolites in the headspace of CALU-1 lung cancer cells, NL20 normal lung epithelial cells and 35FL121 Tel+ telomerase positive lung fibroblast cells grown in vitro.110,111 Cultures contained 50–80 × 106 cells and were incubated for 16 h at 37 °C. Interestingly, notable amounts of AA were observed from the CALU-1 and NL20 cells but not from 35FL121 Tel+. It was proposed that the concentration of headspace AA in a cell culture can reflect the activity of aldehyde dehydrogenase (ALDH). In line with this hypothesis, the same group later found that the intensity of SIFT-MS signal for AA measured from hepG2 hepatocellular carcinoma cells and primary bone marrow-derived mesenchymal stem cells (hMSCs) could be regulated by the addition of ALDH inhibitors to the growing culture.65 Most recently, the same group attempted SIFT-MS analysis to monitor the release of AA by CALU-1 and NL20 lung cells seeded in 3D collagen hydrogels, which are more physiologically relevant models compared to 2D.112 The data showed that the amount of AA released by the both cell types grown in a 3D scaffolds is higher than for the same cells grown in 2D models. AA from the headspace of lung cancer cells could be measured even at a cell concentration as low as 105 cells per hydrogel. The differential of AA release could be, depending on the cell concentration, more than 3 fold higher for cancer cells when compared to non-malignant lung cells. Using PTR-MS, Brunner et al. analyzed VOCs emitted by four in vitro cultured human cells: lung epithelium cells A-549, retinal pigment epithelium cells hTERTR-PE1, squamous lung carcinoma cells EPLC and immortalized human bronchial epithelial cells BEAS2B.113 The VOCs in the headspace of the cell cultures were sampled either online by continuous transfer directly from the culture flask or by 12 h collection in PTFE bags connected to the flask. The pure media were analyzed in the same way as the corresponding cell cultures in order to provide a reference. By applying multivariate statistical analysis using 42 selected marker VOCs, it was possible to clearly separate the cancerous and non-cancerous cell lines from each other. The authors also observed substantial consumption of headspace AA (m/z 45) by the cancerous cell lines but not by the non-cancerous cells. However, given the earlier observation of AA from some non-cancerous cells by SIFT-MS,111 the specificity of AA level to cancer cells remains unclear. The limited experimental data available at present should be substantially extended to address the potential of AA and other VOCs as a volatile biomarker of tumor cells.Analysis of nonvolatile chemicals
The concentration and diversity of VOCs released by a growing culture represent a considerable challenge for the direct identification and characterization of cells by AMS with high chemical specificity. Alternatively, sampling of nonvolatile chemicals from the cell surface and/or cell interior offers much richer chemical information of analysis, but this mode of sampling is invasive. Traditional MS methods for the analysis of cellular proteins and metabolites include ESI-MS and MALDI-MS in combination with 2D gel and/or liquid chromatography. These methods allow deep coverage of cell proteome and metabolome but involve laborious sample preparation, complex and time-consuming workflow as well as the high cost of operation. A simpler workflow is used for the analysis of membrane lipids by MALDI-MS, but sample preparation, e.g., matrix deposition and cell washing, is still required. Furthermore, all the above analyses cannot be done in real time.Ambient ion sources allow sampling of nonvolatile cell chemicals including metabolites, lipids and proteins with little-to-no sample preparation. Because ambient methods tolerate very high salt concentrations and other matrix effects,33,114 sampling can be performed directly from a growing culture without any pretreatment (Fig. 4a).115,116 For the higher specificity and sensitivity of detection, cells are commonly separated from the medium prior to analysis.117,118 Harvested cells are washed in aqueous buffer and then subjected to desorption/ionization, e.g., from a glass slide (Fig. 4b). Note that the cell integrity is normally preserved during these steps, so the intact species are eventually sampled. The analysis of intact cells is beneficial for the studies on cellular metabolism and allows faster and simpler workflow compared to the methods relying on chemical extraction. However, the preserved viability of cells during the analysis can also represent a problem, necessitating careful experimental design to prevent aerosolization of pathogenic species into the ambient air. Possible solutions to this problem include the use of enclosed sampling interfaces as well as long-term drying (>1 h at room temperature) of cells on a sample holder prior to the analysis for better adhesion.119 Because chemical desorption in AMS results in gradual cell degradation, mass spectral response is prone to alterations during the analysis. Rastering the position of a probe can partially account for this problem, but the signal stability in this case is strongly affected by spatial inhomogeneity of the analyzed cell colony. This makes real-time profiling of metabolic processes by the desorption-based AMS methods rather complicated. Instead, the most promising applications for these methods appear to be the rapid identification of isolated species116,118,120 and untargeted metabolite screening.120–122
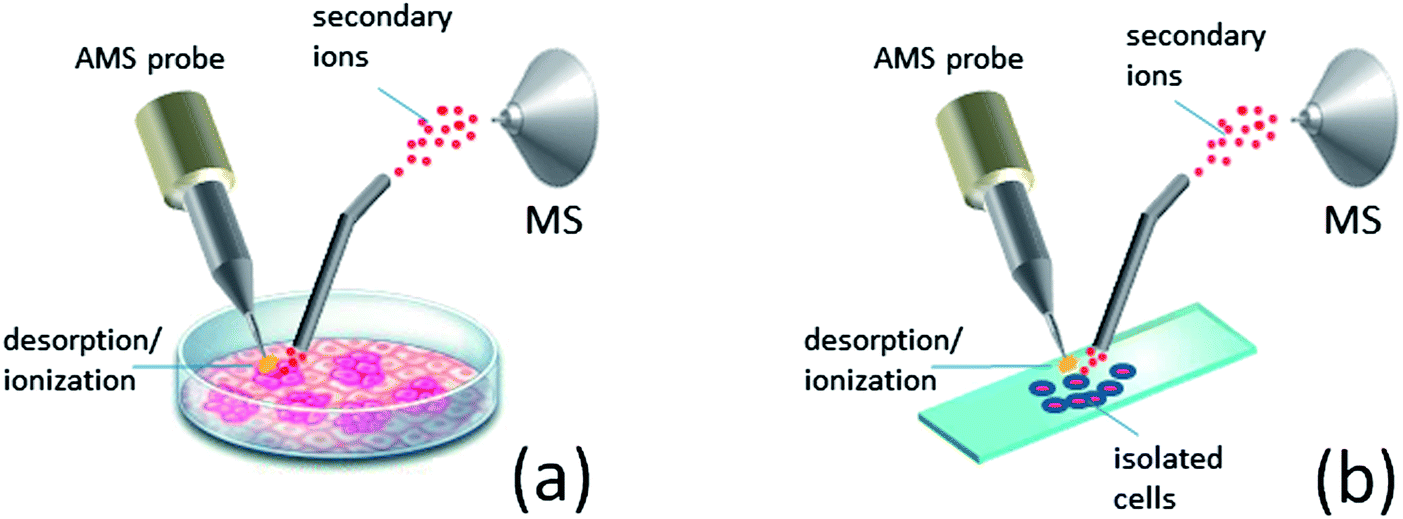 | ||
| Fig. 4 Ambient sampling of nonvolatile cellular chemicals: (a) directly from the growth medium; (b) from isolated cells deposited on a glass slide. | ||
The ionization method for the direct cell sampling should meet two major criteria. First, the number of interrogated cells should be negligibly low compared to the entire cell population in the culture, in order to minimize adverse effects to the culture viability during the analysis. Second, rather harsh desorption conditions are needed in order to efficiently break the walls of exposed cells and extract internal chemicals. Preferred methods employ charged droplets, plasma or local heating as a source of ionization. Desorption electrospray ionization (DESI)123 is by far the most popular AMS method for surface analysis and has been developed into commercial product. In DESI-MS, chemical extraction and ionization of analytes on the surface are achieved by means of pneumatic electrospray with a spatial resolution down to 35 μm.124 When applied to cell cultures, DESI plume primarily desorbs chemicals from the outer cell layers together with excreted metabolites. The penetration depth of ionization depends on cell rigidity. Thus, owing to the thick walls Gram-positive bacteria can withstand the impinging sprayed droplets fairly well, preventing deep penetration of the ionization.118 DESI-MS spans a broad molecular range, from small metabolites to proteins. Ionization of polar molecules is usually achieved via proton transfer. Nonpolar molecules can be charged via complex formation with ionic compounds added to DESI spray, e.g., metal cations. In plasma-based ionization methods, direct analysis in real time mass spectrometry (DART-MS)125 and low temperature plasma probe mass spectrometry (LTP-MS),47 ambient beam of excited-state atoms and ions, typically nitrogen and helium, are used to desorb and ionize molecules from the surface of a sample. Plasma-based methods allow sensitive detection for a wide range of small molecular analytes, but larger molecules such as proteins normally remain invisible. Beneficially, ionization with gas plasma minimizes adverse effects to the culture growth and reduces operational costs associated with the use of organic solvents. DART is by far the most popular AMS plasma ion source and has been developed into commercial product that can be installed on most mass spectrometers with atmospheric pressure interface. The key advantage for LTP is the use of dielectric barrier discharge to induce the low-energy plasma through use of a specially designed electrode configuration. The low-energy plasma allows experiments to be performed without damage to the cell colony or underlying substrate due to electrical shock or perceptible heating. Finally, in laser ablation electrospray ionization mass spectrometry (LAESI-MS)42 and rapid evaporative ionization mass spectrometry (REIMS)50 chemical desorption from the sample surface is achieved by strong locally-confined heating. In LAESI-MS local heating is achieved using IR laser irradiation (LAESI-MS). The plume of desorbed molecules and clusters is intercepted by electrospray for ionization. ESI ionization allows the observation of small polar metabolites and lipids as well as intact proteins. With the help of etched optical fibers, laser irradiation can be focused down to ca. 20 μm, which makes LAESI-MS particularly suitable for the chemical analysis of very small cell populations or even single cells.126–128 REIMS was originally introduced for real-time, in vivo analysis of biological tissues in the surgical environment.49,50 Recently, REIMS methodology was extended for the analysis of cell cultures. Bacterial biomass is rapidly heated by the application of RF electrical current. Thermally induced disruption of cells leads to the production of an aerosol containing gas-phase ions of metabolites and structural lipids. The aerosol is directly introduced into a mass spectrometer for on-line chemical analysis.
1. Analysis of microbial cultures
The potential of DESI-MS for the analysis of microbial cultures has been demonstrated in several studies.118,119,129,130 Recently, Zhang et al. used DESI-MS to characterize lipid composition of four different bacterial species, Bacillus subtilis, Staphylococcus aureus, E. coli and several Salmonella enterica strains.118 Cells were harvested from growing cultures, suspended in 70% ethanol and then evenly deposited on a microscope glass slide (ca. 3000 cells per slide) for direct mass analysis without chemical extraction or other sample preparation. Many of the bacterial species could be distinguished visually based on the distribution of lipid signals in DESI-MS spectra (Fig. 5a). Lipids representative of several major classes, including phosphatidylethanolamines (PE), phosphatidylglycerols (PG) and lysyl-phosphatidylglycerols (LPG), were characterized by tandem MS analysis. PCA analysis of the generated DESI-MS fingerprints clearly differentiated all the four bacterial species studied and several (although not all) of 13 Salmonella strains (Fig. 5b).118 Identification of bacteria by DESI-MS fingerprinting bears great similarity to the established workflow for the identification of bacterial cultures by MALDI-MS.23 Beneficially, DESI-MS obviates matrix deposition and sample loading steps, which makes the analysis simpler and faster.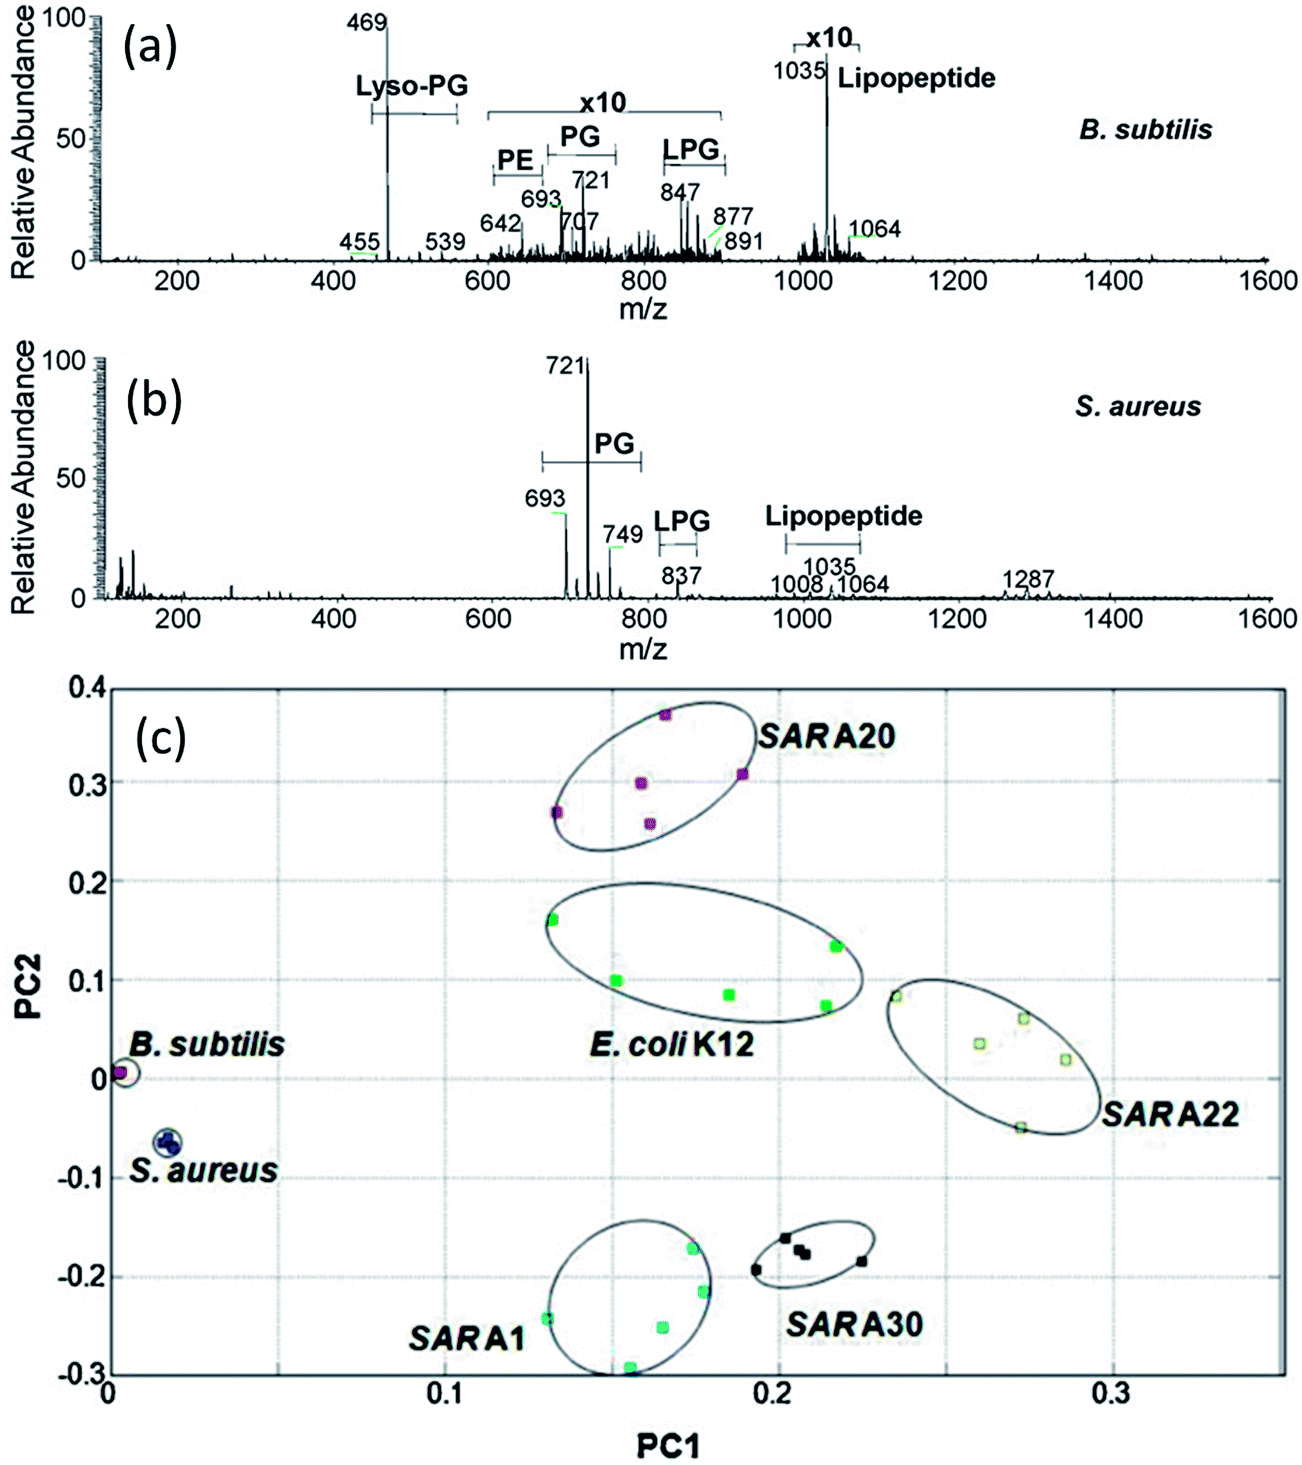 | ||
| Fig. 5 Analysis of bacterial cells with DESI-MS. (a and b): Negative ion mode DESI mass spectra of gram-positive bacteria with major compound categories shown. (a): B. subtilis DESI spectrum with strong lyso-PG peak at m/z 469, regions m/z 600–900 and 1000–1100 expanded by 10 times showing PE, PG, LPG and a relatively strong C15 surfactin lipopeptide signal at m/z 1035. (b): S. aureus DESI spectrum with strong PG peaks in the m/z 700 range and some LPG and lipopeptides. (c): Score plot of PCA results for the negative ion mode DESI mass spectra of B. subtilis, S. aureus, E. coli K12, and four Salmonella strains (SARA1, SAR A20, SAR A22 and SAR A30). Adapted from ref. 118. | ||
Using a variation of DESI called nanospray desorption electrospray ionization (nano-DESI),131 Lanekoff et al. have recently demonstrated that, despite the high salt content of the agar (ca. 350 mM), bacterial cultures can be analyzed directly from agar plates, obviating cell harvesting and washing.115 Spatial analysis of Synechococcus sp. PCC 7002 colonies by nano-DESI-MS revealed the occurrence of chemical gradients due to bacterial metabolism. Thus, a majority of lipids and metabolites were localized on the colony while sucrose and glucosylglycerol, an osmoprotective compound produced by cyanobacteria, were secreted onto the agar. The chemical gradients of sucrose and glucosylglycerol on agar plate were found to depend on the age of the colony. Tandem nano-DESI-MS analysis revealed several glycolipids that have not been previously reported by conventional methods based on chemical extraction.115 AMS fingerprinting of cellular metabolites directly from a growing culture opens new possibilities for the rapid identification of microorganisms and studies of cellular metabolism in real-time.
Plasma ion sources do not require any spray solvent and are usually distinguished by the high stability, simplicity and low cost of operation. These figures of merit are particularly important for the screening of large sample arrays such as bacterial libraries. Pierce et al. used DART-MS to fingerprint fatty acid methyl esters (FAMEs) in isolated bacterial cells (Streptococcus pyogenes, E. coli, Coxiella burnetii).132 Isolated cells were washed in TRIS-sucrose buffer and suspended in aqueous solution of tetramethylammonium hydroxide (TMAH) to induce thermal hydrolysis and methylation of bacterial lipids. A 4 mL aliquot of analyte suspension was sampled to DART-MS as a hanging droplet on the end of the capillary tube. FAME fingerprints of the studied bacterial species could be directly differentiated by visual inspection without the necessity of statistical analysis.132 In a different study, Watts et al. used rapid DART-MS analysis to survey secondary metabolites in the hyphae of Malbranchea graminicola fungus grown on agar plates, without the need for any organic extraction.121 Subsequently, milligram quantities of discovered metabolites were purified from the extracts of large scale liquid cultures via selected-ion monitoring with traditional LC-MS. The combination of DART-MS screening and targeted LC-MS provided a rapid and facile route to pinpoint molecules of interest and streamline their isolation. This approach revealed two new halogenated prenyl-indole alkaloid metabolites of Malbranchea graminicola, named (−)-spiromalbramide and (+)-isomalbrancheamide B. The authors also found that two new brominated analogues, (+)-malbrancheamide C and (+)-isomalbrancheamide C, were produced when the growth medium was enriched with bromine salts. This study indicated a promising niche for AMS to be used as a high-throughput screening tool to pinpoint potential biomarkers in cell cultures for subsequent characterization with methods having higher chemical specificity but slower scanning speed.
Using LTP-MS, Zhang et al. characterized the composition of fatty acid ethyl esters (FAEE) in in vitro grown bacteria B. subtilis, S. aureus, E. coli and S. enterica.117 Bacterial samples from 70% ethanol solution were dried on a glass slide and then directly analyzed by LTP-MS. The sample preparation was similar to that in the earlier study by DESI-MS118 to allow for the direct comparison of experimental data. PCA analysis of LTP-MS FAEE profiles successfully separated the different species (B. subtilis, S. aureus, E. coli and S. enterica) and 11 out of 13 Salmonella strains. Overall, LTP-MS method was found to yield more reproducible spectra and allowed better distinction between different bacterial strains. On the other hand, the information obtained by LTP-MS was largely limited to FAEEs in the range m/z 200–300, while DESI-MS also revealed fatty acids, phospholipids and lipopeptides in the range m/z 200–1500. This study served a nice illustration for the higher stability but narrower molecular range of plasma-based methods compared to solvent-spray methods such as DESI-MS or ESI-MS.
Using LAESI-MS analysis of vegetative Anabaena sp. PCC7120 cyanobacterial cells, Parsiegla et al. have recently demonstrated that, in addition to small metabolites and lipids, ambient sampling of bacterial colonies can also allow observation of proteins without the need of cell lysis.122 Ca. 500–1000 washed intact cells were interrogated in a single LAESI-MS scan, resulting in over 30 metabolites and lipids (m/z < 900) tentatively identified based on accurate mass measurements, isotope distribution patterns, and literature search. The spectra also revealed phycocyanin (C-PC) and allophycocyanin (APC) (ca. 20 kDa), which belong to the family of phycobilisome proteins in the antenna complex, as well as the ratio of the α- and β-subunits within the C-PC and APC. Protein identification was based on the deconvolution of multiply charged ion peaks followed by mass comparison with proteins obtained from an annotated genome database. The high molecular range and spatial resolution (∼30 μm) of LAESI-MS are distinctive advantages for this method in cell studies.
Using REIMS, Strittmatter et al. have recently performed in situ characterization of nine bacterial species cultured on various growth media.116 In REIMS, chemical desorption of cellular chemicals is achieved by applying RF electrical current to bacterial biomass. Thermally induced aerosol containing gas-phase molecules and ions is directly sampled into a mass spectrometer for on-line chemical analysis. Even though the produced aerosol is mostly constituted by neutral species, which are invisible by MS, REIMS spectra recorded in negative ion mode distinguished 100–400 spectral features in m/z range 150–2000. The high chemical capacity of the method is probably in part due to the high resolution and sensitivity of orbitrap MS detection used in that study. The dominant species in all the spectra were observed in m/z range 600–900 and corresponded to intact phospholipids. Correct classification of the studied bacterial species by the statistical analysis of MS data could be obtained when performing the analysis in m/z range 500–1900.116 The broad molecular range, high chemical capacity, simplicity and speed of analysis make REIMS a competitive alternative to the widely used MALDI-MS approach in bacteria identification.21,23,25
2. Analysis of mammalian cell lines
Mammalian cell cultures are usually more difficult to handle compared to bacterial cultures, which limits their study in analytical MS laboratories. To our knowledge, LAESI-MS is by far the only successful ambient desorption method in this area of research. High throughput metabolite profiling by LAESI-MS combined with multivariate statistical analysis has been applied for the identification of virus-induced perturbations in the biochemical processes of the host cells.120,133 Sripadi et al. studied the metabolic effect of human T-lymphotropic virus (HTLV) on human cell lines.133 Before LAESI-MS analysis, the cells were washed twice in phosphate buffered saline and pelleted by centrifugation to obtain ca. 106 cells per pellet. Pellets were loaded onto clean microscope slides for the LAESI-MS experiments. In a single-shot experiment, ca. 3000 cells were ablated. LAESI-MS spectra directly revealed the differences in the metabolite profiles specific to virus type (HTLV1 vs. HTLV3), Tax protein expression (Tax1 vs. Tax3) as well as the cell type (T lymphocytes vs. kidney epithelial cells). For example, glycerophosphocholine (PC) lipid components were dominant in the non-HTLV1 transformed cells, and PC(O-32:1) and PC(O-34:1) plasmalogens were displaced by PC(30:0) and PC(32:0) species in the HTLV1 transformed cells. In HTLV1 transformed cells, choline, phosphocholine, spermine and glutathione, among others, were down-regulated, whereas creatine, dopamine, arginine and AMP were present at higher levels. Using similar approach, Shrestha et al. studied the metabolic effect induced by Kaposi's sarcoma-associated herpesvirus (KSHV) in latently infected B-lymphocytes (BCBL-1).120 Both BCBL-1 and reference non-KSHV infected B-lymphocytes (BJAB) were grown in suspension under the same conditions. Mass spectra of BCBL-1 and BJAB cells were found different with respect to the relative signal intensity of several signals, mostly corresponding to phospholipids (Fig. 6a). Thus, several phosphatidylcholines were downregulated in virally-infected cells (Fig. 6b). The largest difference in expression between the two cell types was observed for a low molecular weight protein with a nominal monoisotopic mass of 4960 Da, which was tentatively assigned as thymosin b4 (Tb4). Expression of Tb4 was reduced by greater than 90% in BCBL-1 cells with respect to BJAB cells. These studies point to metabolic pathways that have a heretofore unexplored role in the viral transformation of host cells and demonstrate that, after the observed biomarkers are validated with functional studies, LAESI-MS could serve as a rapid screening platform for early diagnosis of disease in humans.
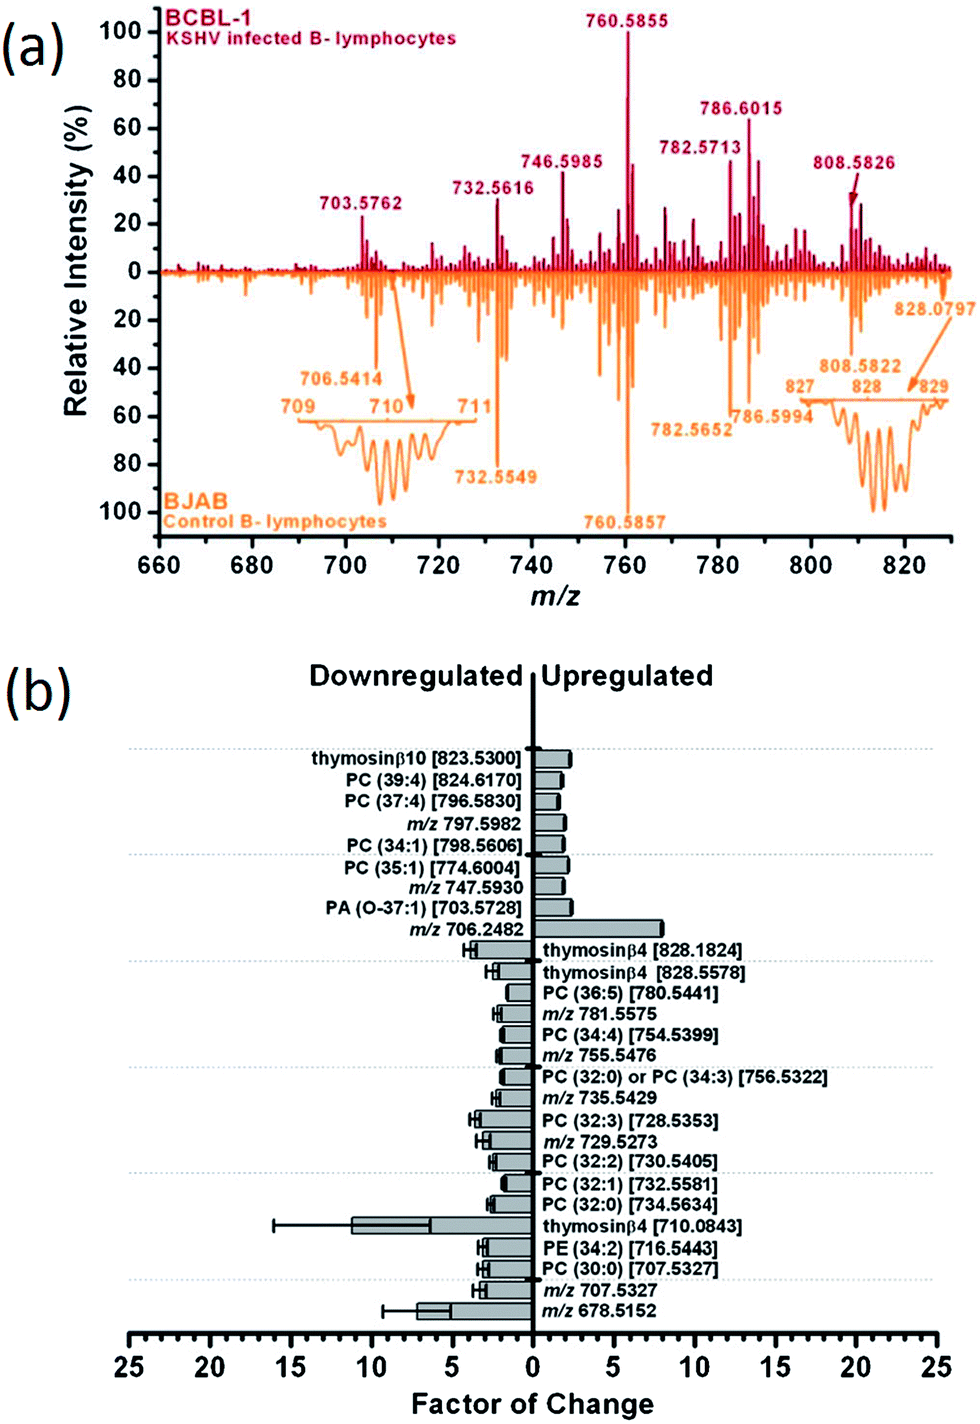 | ||
| Fig. 6 (a): Positive ion mode LAESI mass spectra pertaining to the lipid region (m/z 660–830) in KSHV infected B-lymphocytes BCBL-1 (top) and non-infected B-lymphocytes BJAB (bottom). (b): Identification of ions having the highest contribution to the spectral differences. The grey bars represent the relative up- and down-regulation of compounds in BCBL-1 cells with respect to BJAB cells. Indicated on each bar is the standard error of the mean value, the name of the identified compound, and its m/z value. Adapted from ref. 120. | ||
Emerging trend: single-cell analysis
Single-cell analysis is of great importance in mechanistic and clinical studies, because individual cells within a colony or tissue often have different chemistry and functions. MS is a popular approach for single-cell analyses owing to the high sensitivity, high chemical specificity and broad molecular range of detection.134–137 Most common ionization techniques employed in this field include LDI, MALDI, secondary ionization mass spectrometry (SIMS), and inductively coupled plasma (ICP).Recent studies show that the single-cell MS analysis can be performed with substantial depth of chemical information using ambient sampling. This became possible owing to the steadily improving sensitivity of modern mass spectrometers and increasing spatial resolution of ionization techniques. Compared to vacuum-based methods, AMS allows faster and easier profiling of individual cells on a surface.
Using LAESI-MS with ∼30 μm ablation spot, Shrestha et al. explored cell-to-cell variations in epidermal cells of an Allium cepa onion bulb and a C. aurantium leaf, as well as in human buccal epithelial cells.127 Based on the ion intensity profiles for particular chemicals, it was concluded that the microablation of a cell using a sharpened optical fiber did not notably affect the metabolite composition of the adjacent cells. Thus, secondary metabolites associated with pigmentation, such as cyanidin and quercetin, were found to be specifically localized in the pigmented epidermal cells. In contrast, sucrose was distributed uniformly throughout all the studied cells with slightly higher intensities in the nonpigmented cells. Interestingly, alliin, which is a precursor metabolite responsible for the smell of onion, was concentrated in only 2 cells and absent in the other cells. In a follow-up study from the same group, Stolee et al. profiled the distribution of metabolites at the subcellular level using a combination of microdissection and in situ LAESI–MS detection.126 Large metabolite gradients were revealed between the cytoplasm and nucleus of A. cepa epidermal cells.
Using DESI-MS, Ferreira et al. found lower variation of phospholipids in individual unfertilized mouse oocytes compared to blastocysts.138 The increased heterogeneity of lipid profile during mouse preimplantation development can reflect functional and structural specialization by the blastocyst membrane. DESI-MS of embryos cultured in vitro displayed more homogeneous lipid profile compared to the embryos grown in vivo owing to the nutrient restriction in the culture medium. In a follow-up study, González-Serrano et al. used DESI-MS to profile individual bovine oocytes and blastocysts for free fatty acids, phospholipids, cholesterol-related molecules, and triacylglycerols.139 Statistical analysis on DESI-MS data allowed unequivocal discrimination between oocytes and blastocysts based on specific lipid profiles. DESI-MS combined with transcript regulation analysis and transcript regulation revealed significant difference in homeostasis of cholesterol and FFA metabolism for in vitro and in vivo grown blastocysts.
Date et al. utilized a nanoelectrospray tip as a pipet to extract the contents of subcellular regions. The sampled cell sap was directly nebulized/ionized by applying high voltage to the capillary tip at the entrance of a mass spectrometer.140 This allowed the metabolic study of anti-breast cancer drug, tamoxifen, in a single human hepatocellular carcinoma cell, HepG2, at the subcellular level. Nonmetabolized tamoxifen was present in both the cytoplasm and a vacuole, while its metabolites were only found in the cytoplasm. A number of single-cell analyses relying on similar approach were reported recently.140–142 For example, Gholipour et al. used a sharp capillary to sample and ionize chemicals in parenchyma cells of tulip bulb.143 Single-cell metabolite profile for the bulbs of Tulipa gesneriana stored at 25 °C and at 15 °C was examined. Several sugars, amino acids, organic acids, vitamins, fatty acids, and secondary metabolites were identified.
At present, the major limitations of single-cell AMS analysis are related to the sensitivity of mass spectrometers and spatial resolution of sampling. The lower sensitivity of AMS detection compared to vacuum methods generally limits the single-cell studies to large plant cells (>30 μm). Smaller vertebral cells contain lower number of molecules and therefore require higher sensitivity of detection. Besides that, the analysis of small individual cells (∼10 μm) in a tissue or colony is difficult to achieve due to the larger size of ablation spot in most AMS techniques. To ensure the single-cell mode of sampling, interrogated cells should be relatively distant from each other. This complicates localization of single cells during the analysis. Finally, the limited lateral resolution of ambient techniques generally prevents detailed single cell imaging, although certain chemical information on subcellular level can be obtained.140
Concluding remarks
With the use of ambient sampling, MS analysis of in vitro grown cells can be performed with much higher speed, throughput and operational ease compared to the traditional methods. A variety of approaches have been developed over recent years that allow direct and noninvasive chemical characterization of microbial cultures and mammalian cell lines without any preparatory steps required. Recent studies strongly indicate the potential of AMS for the molecular fingerprinting of cells and biomarker discovery. Noninvasive sampling in real time enables visualization of cell adaptation to external factors such as drug/antibiotic treatment or changes in the culturing conditions. Finally, VOC biomarkers of pathogens and cancer cells identified in vitro can be directly referenced to the in vivo chemical fingerprints of expired breath or skin vapors from animals and humans, thus providing a tool for specific and noninvasive clinical diagnostics. The past 2–3 years were the most fruitful for the AMS research on cell cultures, so the current progress is likely to hold in near future.Acknowledgements
This work is jointly supported by National Natural Science Foundation of China (NNSFC) (no. 21105010, 21165002), National Key Scientific Instrument and Equipment Development Project (no. 2011YQ140150) and Science and Technology Foundation of the Education Department of Jiangxi Province (no. GJJ11022).References
- E. De Clercq, Curr. Opin. Microbiol., 2005, 8, 552–560 CrossRef CAS PubMed.
- B. Stansley, J. Post and K. Hensley, J. Neuroinflammation, 2012, 9, 1742–2094 CrossRef PubMed.
- M. T. Donato, A. Lahoz, J. V. Castell and M. J. Gomez-Lechon, Curr. Drug Metab., 2008, 9, 1–11 CrossRef CAS.
- R. M. Nardone, BioTechniques, 2008, 45, 221 CrossRef CAS PubMed.
- D. W. Bates, L. Goldman and T. H. Lee, JAMA, J. Am. Med. Assoc., 1991, 265, 365–369 CrossRef CAS.
- I. Giaever and C. R. Keese, Nature, 1993, 366, 591–592 CrossRef CAS PubMed.
- A. Bartolazzi, M. Santonico, G. Pennazza, E. Martinelli, R. Paolesse, A. D'Amico and C. Di Natale, Sens. Actuators, B, 2010, 146, 483–488 CrossRef CAS PubMed.
- K. B. Gendron, N. G. Hockstein, E. R. Thaler, A. Vachani and C. W. Hanson, Otolaryngol.–Head Neck Surg., 2007, 137, 269–273 CrossRef PubMed.
- O. Canhoto and N. Magan, Sens. Actuators, B, 2005, 106, 3–6 CrossRef CAS PubMed.
- J. R. Carey, K. S. Susick, K. I. Hulkower, J. A. Imlay, K. R. C. Imlay, C. K. Ingison, J. B. Ponder, A. Sen and A. E. Wittrig, J. Am. Chem. Soc., 2011, 133, 7571–7576 CrossRef CAS PubMed.
- K. Kreij, C. F. Mandenius, J. J. Clemente, A. E. Cunha, S. M. S. Monteiro, M. J. T. Carrondo, F. Hesse, M. Molinas, R. Wagner, O. W. Merten, C. Geny-Katinger, P. Martensson, T. Bachinger and J. Mitrovics, Cytotechnology, 2005, 48, 41–58 CrossRef PubMed.
- C. Mowry, C. Morgan, Q. Baca, R. Manginell, R. Kottenstette, P. Lewis and G. Frye-Mason, in Chemical and Biological Early Warning Monitoring for Water, Food and Ground, ed. J. L. Jensen and L. W. Burggraf, 2002, vol. 4575, pp. 83–90 Search PubMed.
- J. Wegener, C. R. Keese and I. Giaever, Exp. Cell Res., 2000, 259, 158–166 CrossRef CAS PubMed.
- P. Picotti and R. Aebersold, Nat. Methods, 2012, 9, 555–566 CrossRef CAS PubMed.
- W. Zhang, F. Li and L. Nie, Microbiology-SGM, 2010, 156, 287–301 CrossRef CAS PubMed.
- F. Schmidt and U. Voelker, Proteomics, 2011, 11, 3203–3211 CrossRef CAS PubMed.
- W. Zhou, L. A. Liotta and E. F. Petricoin, Cancer Genomics Proteomics, 2012, 9, 373–381 CAS.
- E. Y. Xu, W. H. Schaefer and Q. Xu, Curr. Opin. Drug Discovery Dev., 2009, 12, 40–52 CAS.
- N. Vinayavekhin, E. A. Homan and A. Saghatelian, ACS Chem. Biol., 2010, 5, 91–103 CrossRef CAS PubMed.
- L. Krásný, R. Hynek and I. Hochel, Int. J. Mass Spectrom., 2013, 353, 67–79 CrossRef PubMed.
- P. A. C. Braga, A. Tata, V. Goncalves dos Santos, J. R. Barreiro, N. V. Schwab, M. Veiga dos Santos, M. N. Eberlin and C. R. Ferreira, RSC Adv., 2013, 3, 994–1008 RSC.
- Y. P. Ho and P. M. Reddy, Mass Spectrom. Rev., 2011, 30, 1203–1224 CrossRef CAS PubMed.
- T. R. Sandrin, J. E. Goldstein and S. Schumaker, Mass Spectrom. Rev., 2013, 32, 188–217 CrossRef CAS PubMed.
- V. Havlicek, K. Lemr and K. A. Schug, Anal. Chem., 2013, 85, 790–797 CrossRef CAS PubMed.
- P. R. Murray, J. Mol. Diagn., 2012, 14, 419–423 CrossRef CAS PubMed.
- R. G. Cooks, Z. Ouyang, Z. Takats and J. M. Wiseman, Science, 2006, 311, 1566–1570 CrossRef CAS PubMed.
- M.-Z. Huang, C.-H. Yuan, S.-C. Cheng, Y.-T. Cho and J. Shiea, Annu. Rev. Anal. Chem., 2010, 3, 43–65 CrossRef CAS PubMed.
- R. M. Alberici, R. C. Simas, G. B. Sanvido, W. Romao, P. M. Lalli, M. Benassi, I. B. S. Cunha and M. N. Eberlin, Anal. Bioanal. Chem., 2010, 398, 265–294 CrossRef CAS PubMed.
- G. A. Harris, A. S. Galhena and F. M. Fernandez, Anal. Chem., 2011, 83, 4508–4538 CrossRef CAS PubMed.
- M. Z. Huang, S. C. Cheng, Y. T. Cho and J. Shiea, Anal. Chim. Acta, 2011, 702, 1–15 CrossRef CAS PubMed.
- M. E. Monge, G. A. Harris, P. Dwivedi and F. M. Fernandez, Chem. Rev., 2013, 113, 2269–2308 CrossRef CAS PubMed.
- M. Careri and A. Mangia, Anal. Bioanal. Chem., 2011, 399, 2585–2595 CrossRef CAS PubMed.
- H. W. Gu, N. Xu and H. W. Chen, Anal. Bioanal. Chem., 2012, 403, 2145–2153 CrossRef CAS PubMed.
- R. V. Bennet, C. M. Gamage and F. M. Fernandez, J. Visualized Exp., 2013, e50575 Search PubMed.
- C. Wu, A. L. Dill, L. S. Eberlin, R. G. Cooks and D. R. Ifa, Mass Spectrom. Rev., 2013, 32, 218–243 CrossRef CAS PubMed.
- P. Nemes, A. A. Barton and A. Vertes, Anal. Chem., 2009, 81, 6668–6675 CrossRef CAS PubMed.
- H. W. Chen, A. Wortmann and R. Zenobi, J. Mass Spectrom., 2007, 42, 1123–1135 CrossRef CAS PubMed.
- Y. Song, N. Talaty, K. Datsenko, B. L. Wanner and R. G. Cooks, Analyst, 2009, 134, 838–841 RSC.
- P. Nemes and A. Vertes, J. Visualized Exp., 2010, e2097 Search PubMed.
- Z. Yu, L. C. Chen, H. Suzuki, O. Ariyada, R. Erra-Balsells, H. Nonami and K. Hiraoka, J. Am. Soc. Mass Spectrom., 2009, 20, 2304–2311 CrossRef CAS PubMed.
- B. Hu, L. Wang, W. C. Ye and Z. P. Yao, Sci. Rep., 2013, 3, 2104 Search PubMed.
- P. Nemes and A. Vertes, Anal. Chem., 2007, 79, 8098–8106 CrossRef CAS PubMed.
- J. Y. Yew, R. B. Cody and E. A. Kravitz, Proc. Natl. Acad. Sci. U. S. A., 2008, 105, 7135–7140 CrossRef CAS PubMed.
- K. Yoshimura, L. C. Chen, Z. Yu, K. Hiraoka and S. Takeda, Anal. Biochem., 2011, 417, 195–201 CrossRef CAS PubMed.
- H. W. Chen, A. Wortmann, W. H. Zhang and R. Zenobi, Angew. Chem., Int. Ed., 2007, 46, 580–583 CrossRef CAS PubMed.
- P. Martinez-Lozano and J. F. de la Mora, J. Am. Soc. Mass Spectrom., 2009, 20, 1060–1063 CrossRef CAS PubMed.
- J. D. Harper, N. A. Charipar, C. C. Mulligan, X. Zhang, R. G. Cooks and Z. Ouyang, Anal. Chem., 2008, 80, 9097–9104 CrossRef CAS PubMed.
- L. S. Eberlin, I. Norton, D. Orringer, I. F. Dunn, X. Liu, J. L. Ide, A. K. Jarmusch, K. L. Ligon, F. A. Jolesz, A. J. Golby, S. Santagata, N. Y. R. Agar and R. G. Cooks, Proc. Natl. Acad. Sci. U. S. A., 2013, 110, 1611–1616 CrossRef PubMed.
- J. Balog, L. Sasi-Szabó, J. Kinross, M. R. Lewis, L. J. Muirhead, K. Veselkov, R. Mirnezami, B. Dezső, L. Damjanovich, A. Darzi, J. K. Nicholson and Z. Takáts, Sci. Transl. Med., 2013, 5, 194ra193 CrossRef PubMed.
- J. Balog, T. Szaniszlo, K. C. Schaefer, J. Denes, A. Lopata, L. Godorhazy, D. Szalay, L. Balogh, L. Sasi-Szabo, M. Toth and Z. Takats, Anal. Chem., 2010, 82, 7343–7350 CrossRef CAS PubMed.
- P. Nemes and A. Vertes, TrAC-Trends Anal. Chem., 2012, 34, 22–34 CrossRef CAS PubMed.
- P.-K. So, B. Hu and Z.-P. Yao, Mol. BioSyst., 2013, 9, 915–929 RSC.
- S. Schulz and J. S. Dickschat, Nat. Prod. Rep., 2007, 24, 814–842 RSC.
- D. Pickel, G. P. Manucy, D. B. Walker, S. B. Hall and J. C. Walker, Appl. Anim. Behav. Sci., 2004, 89, 107–116 CrossRef PubMed.
- M. Shirasu and K. Touhara, J. Biochem., 2011, 150, 257–266 CrossRef CAS PubMed.
- R. P. M. Wong, G. R. Flematti and T. M. E. Davis, Malar. J., 2012, 11, 314 CrossRef PubMed.
- X. Chen, F. J. Xu, Y. Wang, Y. F. Pan, D. J. Lu, P. Wang, K. J. Ying, E. G. Chen and W. M. Zhang, Cancer, 2007, 110, 835–844 CrossRef CAS PubMed.
- A. Sponring, W. Filipiak, T. Mikoviny, C. Ager, J. Schubert, W. Miekisch, A. Amann and J. Troppmair, Anticancer Res., 2009, 29, 419–426 CAS.
- A. Sponring, W. Filipiak, C. Ager, J. Schubert, W. Miekisch, A. Amann and J. Troppmair, Cancer Biomarkers, 2010, 7, 153–161 CAS.
- J. Kuzma, M. Nemecekmarshall, W. H. Pollock and R. Fall, Curr. Microbiol., 1995, 30, 97–103 CrossRef CAS.
- M. Bunge, N. Araghipour, T. Mikoviny, J. Dunkl, R. Schnitzhofer, A. Hansel, F. Schinner, A. Wisthaler, R. Margesin and T. D. Mark, Appl. Environ. Microbiol., 2008, 74, 2179–2186 CrossRef CAS PubMed.
- C. Scholler, S. Molin and K. Wilkins, Chemosphere, 1997, 35, 1487–1495 CrossRef CAS.
- J. J. Zhu, H. D. Bean, Y. M. Kuo and J. E. Hill, J. Clin. Microbiol., 2010, 48, 4426–4431 CrossRef CAS PubMed.
- M. E. Dolch, C. Hornuss, C. Klocke, S. Praun, J. Villinger, W. Denzer, G. Schelling and S. Schubert, Eur. J. Clin. Microbiol. Infect. Dis., 2012, 31, 3007–3013 CrossRef CAS PubMed.
- T. W. E. Chippendale, B. Hu, A. J. El Haj and D. Smith, Analyst, 2012, 137, 4677–4685 RSC.
- M. O'Hara and C. A. Mayhew, J. Breath Res., 2009, 3, 027001 CrossRef CAS PubMed.
- M. E. Dolch, C. Hornuss, C. Klocke, S. Praun, J. Villinger, W. Denzer, G. Schelling and S. Schubert, J. Appl. Microbiol., 2012, 113, 1097–1105 CrossRef CAS PubMed.
- R. A. Allardyce, V. S. Langford, A. L. Hill and D. R. Murdoch, J. Microbiol. Methods, 2006, 65, 361–365 CrossRef CAS PubMed.
- W. Carroll, W. Lenney, T. S. Wang, P. Spanel, A. Alcock and D. Smith, Pediatr. Pulmonol., 2005, 39, 452–456 CrossRef PubMed.
- V. Shestivska, A. Nemec, P. Drevinek, K. Sovova, K. Dryahina and P. Spanel, Rapid Commun. Mass Spectrom., 2011, 25, 2459–2467 CrossRef CAS PubMed.
- A. D. Wilson and M. Baietto, Sensors, 2011, 11, 1105–1176 CrossRef CAS PubMed.
- J. E. Graham, in Advances in Applied Microbiology, ed. S. Sariaslani and G. M. Gadd, 2013, vol. 82, pp. 29–52 Search PubMed.
- D. Kirkland, S. Pfuhler, D. Tweats, M. Aardema, R. Corvi, F. Darroudi, A. Elhajouji, H. Glatt, P. Hastwell, M. Hayashi, P. Kasper, S. Kirchner, A. Lynch, D. Marzin, D. Maurici, J. R. Meunier, L. Muller, G. Nohynek, J. Parry, E. Parry, V. Thybaud, R. Tice, J. van Benthem, P. Vanparys and P. White, Mutat. Res., Genet. Toxicol. Environ. Mutagen., 2007, 628, 31–55 CrossRef CAS PubMed.
- D. I. Ellis, W. B. Dunn, J. L. Griffin, J. W. Allwood and R. Goodacre, Pharmacogenomics, 2007, 8, 1243–1266 CrossRef CAS PubMed.
- E. Crespo, S. M. Cristescu, H. de Ronde, S. Kuijper, A. H. J. Kolk, R. M. Anthony and F. J. M. Harren, J. Microbiol. Methods, 2011, 86, 8–15 CrossRef CAS PubMed.
- S. Kameyama, H. Tanimoto, S. Inomata, K. Suzuki, D. D. Komatsu, A. Hirota, U. Konno and U. Tsunogai, Geochem. J., 2011, 45, 355–363 CrossRef CAS.
- K. Sovova, J. Cepl, A. Markos and P. Spanel, Analyst, 2013, 138, 4795–4801 RSC.
- C. Brunner, W. Szymczak, W. Li, C. Hoeschen, S. Mortl, F. Eckardt-Schupp and U. Oeh, Radiat. Environ. Biophys., 2011, 50, 209–217 CrossRef CAS PubMed.
- M. Syhre and S. T. Chambers, Tuberculosis, 2008, 88, 317–323 CrossRef CAS PubMed.
- M. Syhre, L. Manning, S. Phuanukoonnon, P. Harino and S. T. Chambers, Tuberculosis, 2009, 89, 263–266 CrossRef CAS PubMed.
- A. J. Scott-Thomas, M. Syhre, P. K. Pattemore, M. Epton, R. Laing, J. Pearson and S. T. Chambers, BMC Pulm. Med., 2010, 10, 56 CrossRef PubMed.
- J. J. Zhu, H. D. Bean, M. J. Wargo, L. W. Leclair and J. E. Hill, J. Breath Res., 2013, 7, 016003 CrossRef PubMed.
- N. A. Rakow and K. S. Suslick, Nature, 2000, 406, 710–713 CrossRef CAS PubMed.
- R. Fend, A. H. J. Kolk, C. Bessant, P. Buijtels, P. R. Klatser and A. C. Woodman, J. Clin. Microbiol., 2006, 44, 2039–2045 CrossRef PubMed.
- M. Bruins, A. Bos, P. L. C. Petit, K. Eadie, A. Rog, R. Bos, G. H. van Ramshorst and A. van Belkum, Eur. J. Clin. Microbiol. Infect. Dis., 2009, 28, 775–780 CrossRef CAS PubMed.
- J. N. Labows, K. J. McGinley, G. F. Webster and J. J. Leyden, J. Clin. Microbiol., 1980, 12, 521–526 CAS.
- J. Julak, E. Stranska, E. Prochazkova-Francisci and V. Rosova, Med. Sci. Monit., 2000, 6, 605–610 CAS.
- D. Smith and P. Spanel, Analyst, 2011, 136, 2009–2032 RSC.
- D. Smith and P. Spanel, Mass Spectrom. Rev., 2005, 24, 661–700 CrossRef CAS PubMed.
- P. Spanel and D. Smith, Mass Spectrom. Rev., 2011, 30, 236–267 CrossRef CAS PubMed.
- R. S. Blake, P. S. Monks and A. M. Ellis, Chem. Rev., 2009, 109, 861–896 CrossRef CAS PubMed.
- J. de Gouw and C. Warneke, Mass Spectrom. Rev., 2007, 26, 223–257 CrossRef CAS PubMed.
- M. Luchner, R. Gutmann, K. Bayer, J. Dunkl, A. Hansel, J. Herbig, W. Singer, F. Strobl, K. Winkler and G. Striedner, Biotechnol. Bioeng., 2012, 109, 3059–3069 CrossRef CAS PubMed.
- D. Smith and P. Španěl, TrAC, Trends Anal. Chem., 2011, 30, 945–959 CrossRef CAS PubMed.
- D. Bassi, P. Tosi and R. Schlogl, J. Vac. Sci. Technol., A, 1998, 16, 114–122 CAS.
- C. Hornuss, S. Praun, J. Villinger, A. Dornauer, P. Moehnle, M. Dolch, E. Weninger, A. Chouker, C. Feil, J. Briegel, M. Thiel and G. Schelling, Anesthesiology, 2007, 106, 665–674 CrossRef CAS PubMed.
- C. Wu, W. F. Siems and H. H. Hill, Anal. Chem., 2000, 72, 396–403 CrossRef CAS.
- T. S. Wang, D. Smith and P. Spanel, Int. J. Mass Spectrom., 2004, 233, 245–251 CrossRef CAS PubMed.
- T. W. E. Chippendale, P. Spanel and D. Smith, Rapid Commun. Mass Spectrom., 2011, 25, 2163–2172 CrossRef CAS PubMed.
- R. M. Thorn, D. M. Reynolds and J. Greenman, J. Microbiol. Methods, 2011, 84, 258–264 CrossRef CAS PubMed.
- F. J. Gilchrist, A. Alcock, J. Belcher, M. Brady, A. Jones, D. Smith, P. Spanel, K. Webb and W. Lenney, Eur. Respir. J., 2011, 38, 409–414 CrossRef CAS PubMed.
- B. Enderby, D. Smith, W. Carroll and W. Lenney, Pediatr. Pulmonol., 2009, 44, 142–147 CrossRef PubMed.
- F. J. Gilchrist, C. Razavi, A. K. Webb, A. M. Jones, P. Spanel, D. Smith and W. Lenney, J. Breath Res., 2012, 6, 036004 CrossRef PubMed.
- F. J. Gilchrist, R. J. Bright-Thomas, A. M. Jones, D. Smith, P. Spanel, A. K. Webb and W. Lenney, J. Breath Res., 2013, 7, 026010 CrossRef CAS PubMed.
- D. Smith, P. Španěl, F. J. Gilchrist and W. Lenney, J. Breath Res., 2013, 7, 044001 CrossRef PubMed.
- V. Shestivska, P. Spanel, K. Dryahina, K. Sovova, D. Smith, M. Musilek and A. Nemec, J. Appl. Microbiol., 2012, 113, 701–713 CrossRef CAS PubMed.
- L. Bennett, L. Ciaffoni, W. Denzer, G. Hancock, A. D. Lunn, R. Peverall, S. Praun and G. A. Ritchie, J. Breath Res., 2009, 3, 1752–7155 CrossRef PubMed.
- M. E. Dolch, L. Frey, C. Hornuss, M. Schmoelz, S. Praun, J. Villinger and G. Schelling, J. Breath Res., 2008, 2, 1752–7155 CrossRef PubMed.
- J. J. Zhu and J. E. Hill, Food Microbiol., 2013, 34, 412–417 CrossRef CAS PubMed.
- D. Smith, T. Wang, J. Sule-Suso, P. Spanel and A. El Haj, Rapid Commun. Mass Spectrom., 2003, 17, 845–850 CrossRef CAS PubMed.
- J. Sule-Suso, A. Pysanenko, P. Spanel and D. Smith, Analyst, 2009, 134, 2419–2425 RSC.
- A. V. Rutter, T. W. E. Chippendale, Y. Yang, P. Spanel, D. Smith and J. Sule-Suso, Analyst, 2013, 138, 91–95 RSC.
- C. Brunner, W. Szymczak, V. Hollriegl, S. Mortl, H. Oelmez, A. Bergner, R. M. Huber, C. Hoeschen and U. Oeh, Anal. Bioanal. Chem., 2010, 397, 2315–2324 CrossRef CAS PubMed.
- A. U. Jackson, N. Talaty, R. G. Cooks and G. J. Van Berkel, J. Am. Soc. Mass Spectrom., 2007, 18, 2218–2225 CrossRef CAS PubMed.
- I. Lanekoff, O. Geydebrekht, G. E. Pinchuk, A. E. Konopka and J. Laskin, Analyst, 2013, 138, 1971–1978 RSC.
- N. Strittmatter, E. A. Jones, K. A. Veselkov, M. Rebec, J. G. Bundy and Z. Takats, Chem. Commun., 2013, 49, 6188–6190 RSC.
- J. I. Zhang, A. B. Costa, W. A. Tao and R. G. Cooks, Analyst, 2011, 136, 3091–3097 RSC.
- J. I. Zhang, N. Talaty, A. B. Costa, Y. Xia, W. A. Tao, R. Bell, J. H. Callahan and R. G. Cooks, Int. J. Mass Spectrom., 2011, 301, 37–44 CrossRef CAS PubMed.
- M. A. Meetani, Y.-S. Shin, S. Zhang, R. Mayer and F. Basile, J. Mass Spectrom., 2007, 42, 1186–1193 CrossRef CAS PubMed.
- B. Shrestha, P. Sripadi, C. M. Walsh, T. T. Razunguzwa, M. J. Powell, K. Kehn-Hall, F. Kashanchi and A. Vertes, Chem. Commun., 2012, 48, 3700–3702 RSC.
- K. R. Watts, S. T. Loveridge, K. Tenney, J. Media, F. A. Valeriote and P. Crews, J. Org. Chem., 2011, 76, 6201–6208 CrossRef CAS PubMed.
- G. Parsiegla, B. Shrestha, F. Carriere and A. Vertes, Anal. Chem., 2012, 84, 34–38 CrossRef CAS PubMed.
- Z. Takats, J. M. Wiseman, B. Gologan and R. G. Cooks, Science, 2004, 306, 471–473 CrossRef CAS PubMed.
- D. I. Campbell, C. R. Ferreira, L. S. Eberlin and R. G. Cooks, Anal. Bioanal. Chem., 2012, 404, 389–398 CrossRef CAS PubMed.
- R. B. Cody, J. A. Laramee and H. D. Durst, Anal. Chem., 2005, 77, 2297–2302 CrossRef CAS PubMed.
- J. A. Stolee, B. Shrestha, G. Mengistu and A. Vertes, Angew. Chem., Int. Ed., 2012, 51, 10386–10389 CrossRef CAS PubMed.
- B. Shrestha, J. M. Patt and A. Vertes, Anal. Chem., 2011, 83, 2947–2955 CrossRef CAS PubMed.
- J. A. Stolee and A. Vertes, Anal. Chem., 2013, 85, 3592–3598 CrossRef CAS PubMed.
- Z. Takats, J. M. Wiseman and R. G. Cooks, J. Mass Spectrom., 2005, 40, 1261–1275 CrossRef CAS PubMed.
- Y. Song, N. Talaty, W. A. Tao, Z. Pan and R. G. Cooks, Chem. Commun., 2007, 61–63 RSC.
- P. J. Roach, J. Laskin and A. Laskin, Analyst, 2010, 135, 2233–2236 RSC.
- C. Y. Pierce, J. R. Barr, R. B. Cody, R. F. Massung, A. R. Woolfitt, H. Moura, H. A. Thompson and F. M. Fernandez, Chem. Commun., 2007, 807–809 RSC.
- P. Sripadi, B. Shrestha, R. L. Easley, L. Carpio, K. Kehn-Hall, S. Chevalier, R. Mahieux, F. Kashanchi and A. Vertes, PLoS One, 2010, 5, e12590 Search PubMed.
- R. Trouillon, M. K. Passarelli, J. Wang, M. E. Kurczy and A. G. Ewing, Anal. Chem., 2012, 85, 522–542 CrossRef PubMed.
- N. M. Griffin and J. E. Schnitzer, Mol. Cell. Proteomics, 2011, 10, 14 Search PubMed.
- A. Svatoš, Anal. Chem., 2011, 83, 5037–5044 CrossRef PubMed.
- N. Tsuyama, H. Mizuno and T. Masujima, Biol. Pharm. Bull., 2012, 35, 1425–1431 CAS.
- C. R. Ferreira, V. Pirro, L. S. Eberlin, J. E. Hallett and R. G. Cooks, Anal. Bioanal. Chem., 2012, 404, 2915–2926 CrossRef CAS PubMed.
- A. F. González-Serrano, V. Pirro, C. R. Ferreira, P. Oliveri, L. S. Eberlin, J. Heinzmann, A. Lucas-Hahn, H. Niemann and R. G. Cooks, PLoS One, 2013, 8, e74981 Search PubMed.
- S. Date, H. Mizuno, N. Tsuyama, T. Harada and T. Masujima, Anal. Sci., 2012, 28, 201–203 CrossRef CAS.
- M. Lorenzo Tejedor, H. Mizuno, N. Tsuyama, T. Harada and T. Masujima, Anal. Chem., 2012, 84, 5221–5228 CrossRef CAS PubMed.
- T. Masujima, Anal. Sci., 2009, 25, 953–960 CrossRef CAS.
- Y. Gholipour, R. Erra-Balsells, K. Hiraoka and H. Nonami, Anal. Biochem., 2013, 433, 70–78 CrossRef CAS PubMed.
| This journal is © The Royal Society of Chemistry 2014 |