Systematic stability investigation of perfluorosulfonic acid membranes with varying ion exchange capacities for fuel cell applications

Yan Zhua, Hong Lia, Junke Tangb, Li Wangb, Libin Yanga, Fei Aia, Chaonan Wanga, Wang Zhang Yuan*a and Yongming Zhang*a
aSchool of Chemistry and Chemical Engineering, Shanghai Jiao Tong University, Shanghai, 200240, China. E-mail: wzhyuan@sjtu.edu.cn; ymzsjtu@gmail.com; Fax: +86-21-54742567; Tel: +86-21-34202613
bR&D Center of Dongyue Group, Dongyue Shenzhou New Materials Co. Ltd., Zibo 256401, China

Received 28th October 2013 , Accepted 12th November 2013

First published on 14th November 2013


Abstract

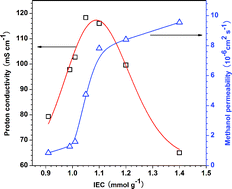
The stability of perfluorosulfonic acid (PFSA) membranes is one of the most essential issues affecting the performance of fuel cells. The investigation of membrane stability is therefore of significant importance for fuel cell applications. So far, however, the most elaborate research on membrane stability has focused on the commercial Nafion® series, which has a fixed ion exchange capacity (IEC) of 0.91 mmol g−1; there is therefore a lack of systematic studies for membranes with varying IEC values. Recently, our group successfully synthesized a variety of PFSA resins with IEC values ranging from 0.91 to 1.4 mmol g−1, providing an opportunity for us to investigate the effect of factors such as the IEC value, crystallinity and ion-cluster channels, on membrane stability. The proton conductivity and methanol permeability of the membranes are also considered to be crucial parameters which affect fuel cell performance. With these in mind, optimized membranes suitable for fuel cell applications were finally identified.


1. Introduction

The proton exchange membrane fuel cell (PEMFC) has received much attention because of its high electrical efficiency and low poisonous emissions.1 Perfluorosulfonic acid (PFSA) membranes, such as the Nafion® series, are the core components of PEMFCs, which act as the ionic conductor, gas barrier and mechanical support in the membrane electrode assemblies (MEAs).2,3 Membrane stability is one of the most crucial issues affecting the applicability of PEMFCs.4,5 The development of durable membranes and MEAs remains a significant challenge for the successful commercialization of fuel cells. It is known that PFSA membranes undergo remarkable deterioration under operating conditions in a short period of time, which results in the loss of the electrolyte and subsequent separator functionality, finally inducing severe fuel cell failure.6,7

Membrane stability is determined by both the chemical structure and the physical characteristics of the membranes.8 It is widely accepted that the chemical stability of PFSA membranes is directly threatened by the attack of active hydroxyl radicals (˙OH) during fuel cell operation.9,10 Coms proposed that the vulnerable hydrogen group in –SO3H can be abstracted by hydroxyl radicals to form perfluorosulfonyl peroxide, which then reacts with PFSA to form bissulfonyl peroxide (Scheme 1). Afterwards, it decomposes via O–O bond homolysis, producing active perfluororadicals, which further degrade and finally result in the scission of the polymer main chain.11 Besides their chemical features, the physical characteristics of the membranes, such as crystallinity, water uptake and swelling ratio, also exert remarkable influence on the membrane stability.


image file: c3ra46182c-s1.tif
Scheme 1 Degradation mechanism of PFSA membranes.

Although there is a great interest in membrane stability, so far, most elaborate research endeavours have focused on commercial Nafion® membranes, such as Nafion 117 and Nafion 115, which have a fixed IEC value of 0.91 mmol g−1.12–15 Despite the great impact this IEC value has on membrane properties, systematic stability studies on PFSA membranes with varying IECs are unavailable in literature reports to date. Recently, our group successfully synthesized PFSA resins with varying IECs, thus providing us with an opportunity to reveal the relationship between IEC value, membrane structure and membrane stability. In this paper, PFSA membranes with various IEC values, ranging from 0.91 to 1.4 mmol g−1, were prepared, and their physical and chemical stabilities were systematically investigated.

2. Experimental

2.1. Preparation of PFSA membranes

PFSA powders (H+ type) with various IEC values were supplied by Dongyue Shenzhou New Materials Co. Ltd. (Zibo, China). The PFSA membranes were prepared according to the following procedures: (1) dissolving PFSA powder in N,N-dimethylformamide (DMF) (30 wt%) and shaking at 40 °C for 24 h in a water bath shaker; (2) casting the PFSA–DMF solution onto a glass plate using a stainless steel scraper and treating it in an oven at 160 °C for 3 h; (3) peeling off the PFSA membrane from the glass plate using deionized water. The IEC values of the membranes are 0.91, 0.99, 1.01, 1.05, 1.1, 1.2 and 1.4 mmol g−1, respectively, and were determined by titration.

The PFSA membranes were then immersed in 3 vol% H2O2 solution at 80 °C for 1 h, and washed with deionized water several times. Afterwards, the membranes were immersed in 1 M H2SO4 at 80 °C for 1 h, and washed with deionized water again. Finally, the membranes were immersed in deionized water at 80 °C for 1 h and repeatedly washed in fresh water until pH = 7. The treated membranes were stored in deionized water prior to use.

2.2. Wide angle X-ray diffraction (WAXD)

WAXD measurements for the membranes were conducted on the Rigaku D/Max-3C diffractometer (Rigaku, Japan), equipped with a rotating anode and a Cu Kα radiation source (λ = 0.15418 nm), and operated at 40 kV, 30 mA, and at a scanning rate of 2° min−1.

2.3. Water uptake measurement

The membranes were immersed in water for 24 h at room temperature and then weighed after blotting the surface water. Subsequently, the membranes were dried in a vacuum oven at 100 °C for 2 h and reweighed. Water uptake (WH2O) was determined by the following equation:
 
image file: c3ra46182c-t1.tif(1)
where M1 and M2 are the weights of wet and dry membranes, respectively.

2.4. Swelling ratio

The membranes were cut into approximately 2 cm × 4 cm rectangular pieces. The thickness of the membranes was measured by a thickness gauge. The volume is thus calculated as the length × width × thickness of the membrane. The wet sample volume (Vw) was measured after the membrane was boiled in deionized water for 1 h. The dry samples were obtained by drying the wet samples in a vacuum oven at 100 °C for 2 h, and then their volumes (Vd) were measured. The swelling ratio (Vs) of the membranes was calculated from the following equation:
 
image file: c3ra46182c-t2.tif(2)

2.5. Mechanical properties

The mechanical properties of the membranes were measured using a Universal Testing Machine Instron 4465 (Instron Corporation, US) at room temperature and ∼50% relative humidity (R.H.) based on the Chinese Standard GB-13022-91, with a strain rate of 50 mm min−1.

2.6. Membrane chemical durability test

It is widely recognized that hydroxyl radicals are a major source of degradation for PFSA membranes. Fenton's test, using H2O2 solution containing a small amount of Fe2+, has therefore become a common ex situ accelerated measurement for membrane durability. Herein, Fe2+ ion is a good catalyst for the decomposition of H2O2, and the formation of hydroxyl radicals, which can be seen from eqn (3).
 
H2O2 + Fe2+ → Fe3+ + OH + ˙OH (3)

It has such superiority due to its high efficiency and excellent controllability.16 Compared to the in situ degradation test, Fenton's test has the most important advantage of being able to observe the membrane degradation process without interfering with the Pt catalyst layer. During the test, membranes were immersed in 50 ml of Fenton solution (30 wt% H2O2 solution and 20 ppm Fe2+) at 80 °C for 6, 24 and 48 h, respectively. The Fenton reagents were refreshed every 3 h to maintain a constant H2O2 concentration.

2.7. Proton conductivity measurement

The in-plane proton conductivity of the membranes was measured using the two electrode AC impedance method on an Autolab PGSTA302 electrochemical test system (Eco Chemie, Netherlands) at 100% R.H., as previously described.17 Proton conductivity was calculated as follows:
 
image file: c3ra46182c-t3.tif(4)
where σ is the proton conductivity and L, A and R are the distance between two electrodes, the cross-sectional area of the sample and the membrane resistance, respectively.

2.8. Methanol permeability measurement

Methanol permeation of the membranes was measured using a self-made diffusion cell, consisting of two identical compartments, into which aqueous methanol solution (2 M) and deionized water were placed. The testing membrane was clamped between the two compartments. Methanol permeated through the membrane from the methanol compartment to the other compartment until they balanced. The concentration of permeated methanol (Cm,t) in the water compartment was measured by gas chromatography using a thermal conductivity detector (GC9790-II, Fuli, China). Methanol permeability (P) was calculated as follows:
 
image file: c3ra46182c-t4.tif(5)
where φ is the rate of change of Cm,t with time, VH2O is the volume of water, C0 is the initial methanol concentration (2 M) in the methanol compartment and S and d are the area and thickness of the membrane, respectively.

3. Results and discussion

The stability of PFSA membranes is highly dependent on the crystallinity and crystallite size. To obtain such information, WAXD measurements were carried out. As shown in Fig. 1a, all membranes show a diffraction feature at 2θ = 8–25°, which can be divided into amorphous (2θ = 16°) and crystalline (2θ = 17.5°) scatterings of the polyfluorocarbon chains of the PFSA ionomers. The other broad diffraction at 2θ = 25–50° can be assigned to the amorphous region.18,19 The relative crystallinity (χc) and crystallite size were calculated from the WAXD spectra.20 The χc value of the membranes significantly decreased with increasing IEC (Fig. 1b). While χc of the 0.91 mmol g−1 membrane is 13.2%, that of the 1.4 mmol g−1 membrane decreases to 4.5%. The decreased χc with increasing IEC is attributed to the disruptive effect of the side chains, which hamper the lamellar ordering of the tetrafluoroethylene backbone segments. Fig. 1b also shows the membrane crystallite size calculated by the Scherrer formula.21 It is found that the crystallite size also gradually decreases from 5.38 to 2.67 nm when the IEC value is increased from 0.91 to 1.4 mmol g−1, since more amorphous fractions prevent the growth of crystals. For the membranes with higher IEC values, their lower crystallinity and smaller crystallite sizes are unfavorable for membrane stability. Therefore, the rational selection of a suitable IEC value is of primary importance for the membrane applications.
image file: c3ra46182c-f1.tif
Fig. 1 (a) WAXD patterns and (b) relative crystallinity and crystallite size of the PFSA membranes with varying IEC values.

Relative crystallinity and crystallite size greatly affect the physical stability of the membranes, such as water uptake and the swelling ratio. As shown in Fig. 2, when the IEC value is increased from 0.91 to 1.4 mmol g−1, the water uptake and swelling ratio of the membranes increase from 35.7% and 37.9% to 164.1% and 348.5%, respectively. Since the water uptake of the membranes is directly associated with the hydrophilic sulfonic acid ion-clusters, whose density increases with increasing IEC, the membranes become more hydrophilic and absorb more water at higher IEC values. The swelling ratio increment indicates that fewer crystallites, which act as physical crosslinking points to prevent the membrane from swelling,22 are formed with improved membrane IEC. It is also noted that the swelling ratio and water uptake of the PFSA membranes do not linearly increase with increasing IEC, but with an inflexion at an IEC of 1.1 mmol g−1, before and after which slow and sharp enhancements are observed. Clustering or agglomeration of the ion-cluster domains is involved in the water uptake and swelling processes. A large water uptake is indicative of the presence of ion-rich regions because clustered ionic domains absorb more water.23


image file: c3ra46182c-f2.tif
Fig. 2 The water uptake and swelling ratio of PFSA membranes with various IECs at room temperature.

The mechanical strength of the membranes affects the manufacturing conditions of the MEAs and the durability of the fuel cells.24 The mechanical strength of membranes was evaluated by tensile strength. From Fig. 3, it can be seen that the tensile strength of the membranes decreases from 20.1 to 6.4 MPa with increasing IECs. This corresponds to a decrement in the mechanical stability of the membranes with IECs. A higher crystallinity and crystallite size would act as a stable physical cross-link to improve the mechanical strength of the membranes. According to the WAXD, the crystallinity and crystallite size decrease with IECs, and thus result in the decrement of mechanical stability.


image file: c3ra46182c-f3.tif
Fig. 3 Tensile strength of PFSA membranes with various IECs.

The chemical durability of the membranes was studied via a Fenton test. Considering that the membrane is stress-free during the procedure, the degree of damage of the membrane is thus dependent on the scission of the polymer main chain.25 The surface morphology of all of the membranes before Fenton testing (shown in ESI) was the same. However, a significant difference was observed after the Fenton's test, which is shown in Fig. 4. Clearly, after treatment for 6 h, some small bubbles and pinholes, which would cause gas crossover and structural failure of the membranes, have appeared on the membrane surfaces when IEC ≥ 1.05 mmol g−1. After the much longer time of 24 h, numerous bubbles occupy all of the membrane surfaces, whose deterioration extent aggravates with increasing IECs. According to Coms' theory, –SO3H groups are attacked by hydroxyl radicals, finally resulting in the scission of polymer main chains. For the high IEC membranes, the larger concentration of sulfonic acid groups results in a greater probability of being attacked. Additionally, the limited swelling ratio of the low IEC membranes also prevents the permeation of Fenton's reagent inside the membranes, which is helpful to the durability. In contrast, the large water uptake of the high IEC membranes promotes permeation, thereby resulting in rapid and serious damage to the membranes.


image file: c3ra46182c-f4.tif
Fig. 4 Surface morphology of the PFSA membranes with various IECs after Fenton testing for 6 (left) and 24 h (right).

Membrane proton conductivity is one of the most important parameters affecting PEMFC performance,26,27 which is determined by both the concentration of the –SO3H groups and the water uptake of the membranes because hydrated protons travel through the aqueous connected ionic cluster networks of the membrane. The relatively small concentration of sulfonic acid groups and the water uptake of low IEC membranes make it difficult for them to form effective ionic cluster networks for proton transfer, thus resulting in low proton conductivities. Moderate IEC values give increased sulfonic acid group concentrations and an improved water uptake for the swollen membranes, thereby resulting in enhanced proton conductivity. However, further improvement in IEC induces a swift increase in water uptake. The redundant water acts as a diluent for the ionic clusters, thus adversely giving decreased proton conductivity28 (Fig. 5). With a balance between the two competitive factors, a maximal proton conductivity of 118 mS cm−1 is achieved at an IEC of 1.05 mmol g−1.


image file: c3ra46182c-f5.tif
Fig. 5 Proton conductivity of the PFSA membranes with various IECs at room temperature.

Due to the loss of ionic groups, the membrane proton conductivity decreases during Fenton testing. Thus, the chemical stability of the membranes can also be reflected by the loss ratio of proton conductivity. As demonstrated in Fig. 6, after Fenton testing for 48 h, the loss ratio of proton conductivity increases with increasing IEC values, and completely loses conductivity when IEC ≥ 1.2 mmol g−1. For low IEC membranes, higher crystallinity and bigger crystallite sizes prevent structural damage and help maintain relatively intact ionic cluster networks upon Fenton testing. However, when IEC ≥ 1.05 mmol g−1, decreased crystallinity and enhanced absorptivity of the Fenton reagent lead to a significantly increased loss ratio of proton conductivity. When the IEC value reaches 1.2 and 1.4 mmol g−1, the membranes are completely destroyed, giving a loss ratio of 100%. Therefore, taking the physical and chemical stabilities and the proton conductivity of the PFSA membranes into account, membranes with an IEC value of 1.05 mmol g−1 might be the best candidates for PEMFC applications.


image file: c3ra46182c-f6.tif
Fig. 6 Loss ratio of proton conductivity of the PFSA membranes with various IECs after Fenton testing for 48 h.

PFSA membranes are not only widely used in PEMFCs, but also in direct methanol fuel cells (DMFCs). However, the high methanol permeability of the membranes currently prevents their extensive applications in DMFCs due to considerable methanol cross-over and thus poor cell performances. Membranes with low methanol permeability are therefore highly desirable.29–32 As shown in Fig. 7, the methanol permeability of the PFSA membranes increases with improved IECs. Methanol normally transfers through the membrane via ion clusters and ion-channels.33 The size of these ionic clusters and the extent of the interconnected domains are increased with an increasing concentration of –SO3H groups. Notably, two inflexions at ∼1.01 and 1.1 mmol g−1 are observed. Below 1.01 mmol g−1, methanol permeability slowly increases. A dramatic increase in methanol permeability is then seen between 1.01 and 1.1 mmol g−1. Above 1.01 mmol g−1, the size of the ion-cluster domains and the area of interconnected ion channels become much larger due to more water uptake, thus making methanol molecules transfer quickly. However, when IEC ≥ 1.1 mmol g−1, the redundant water diminishes the volume of the ion-cluster domains and damages the interconnected ion channels in the membranes, subsequently giving a slowly increased methanol permeability.


image file: c3ra46182c-f7.tif
Fig. 7 Methanol permeability of PFSA membranes with various IECs.

Proton conductivity and methanol permeability are two essential characteristics which determine the performance of DMFCs. To evaluate the efficiency of two separate components, the selectivity, which is defined as the ratio of proton conductivity to methanol permeability, was evaluated in this study. For DMFCs, the higher the selectivity, the better the membrane performance.34 It was found that PFSA membranes have a higher selectivity when IEC ≤ 1.01 mmol g−1, with a maximum of 9.3 × 10⁴ S s cm−2 at 0.91 mmol g−1 (Fig. 8). Therefore, PFSA membranes with an IEC of 0.91 mmol g−1 may be promising candidates for DMFC applications.


image file: c3ra46182c-f8.tif
Fig. 8 Selectivity of PFSA membranes with various IECs.

4. Conclusions

In summary, the physical, mechanical and chemical stabilities of PFSA membranes with varying IEC values were investigated. Under identical conditions, lower IEC membranes exhibited higher crystallinity and a larger crystallite size. When IEC < 1.1 mmol g−1, the membranes showed rational physical and mechanical properties, such as water uptake, swelling ratio and tensile strength. The chemical stability of the PFSA membranes was studied by Fenton's test. The results indicated that when IEC < 1.05 mmol g−1, the membranes exhibited a relatively less destroyed surface structure and a lower loss ratio of proton conductivity. The proton conductivity, which is directly related to the IEC value and water uptake, reached its maximum at an IEC of 1.05 mmol g−1, which may be the optimal IEC value for PEMFC applications. Meanwhile, PFSA membranes with lower IEC values exhibited less methanol permeability and a higher selectivity and those with an IEC of 0.91 mmol g−1 showed the highest selectively of 9.3 × 10⁴ S s cm−2, thus making them promising candidates for DMFC applications.

Acknowledgements

This project was financially supported by the National Natural Science Foundations of China (201104044), the State Hi-tech Research Development Plan of China (863 Project, 2012AA1106015), the National Key Technology R&D Program (2011BAE08B02), and the Shanghai Leading Academic Discipline Project (B202). W.Z.Y thanks the Start-up Foundation and the SMC-Chenxing Young Scholar Program of Shanghai Jiao Tong University.

Notes and references

  1. O. J. Curnick, B. G. Pollet and P. M. Mendes, RSC Adv., 2012, 2, 8368–8374 RSC.
  2. M. Doyle, S. K. Choi and G. Proulx, J. Electrochem. Soc., 2000, 147, 34–37 CrossRef CAS PubMed.
  3. T. Shimura, M. Watanabe and K. Miyatake, RSC Adv., 2012, 2, 5199–5204 RSC.
  4. Y. Cheng, T. Haolin and M. Pan, J. Power Sources, 2012, 198, 190–195 CrossRef CAS PubMed.
  5. Y. Patil, S. Kulkarni and K. A. Mauritz, J. Appl. Polym. Sci., 2011, 121, 2344–2353 CrossRef CAS.
  6. L. Ghassemzadeh, K. D. Kreuer, J. Maier and K. Müller, J. Phys. Chem. C, 2010, 114, 14635–14645 CAS.
  7. L. Fu, S.-J. You, G.-q. Zhang, F.-L. Yang and X.-h. Fang, Chem. Eng. J., 2010, 160, 164–169 CrossRef CAS PubMed.
  8. Y. Patil, S. Sambandam, V. Ramani and K. Mauritz, J. Electrochem. Soc., 2009, 156, B1092 CrossRef CAS PubMed.
  9. M. Inaba, T. Kinumoto, M. Kiriake, R. Umebayashi, A. Tasaka and Z. Ogumi, Electrochim. Acta, 2006, 51, 5746–5753 CrossRef CAS PubMed.
  10. E. Endoh, ECS Trans., 2006, 3, 9–18 CAS.
  11. F. D. Coms, ECS Trans., 2008, 16, 235–255 CAS.
  12. L. Ghassemzadeh and S. Holdcroft, J. Am. Chem. Soc., 2013, 135, 8181–8184 CrossRef CAS PubMed.
  13. C. Yoonoo, C. P. Dawson, E. P. L. Roberts and S. M. Holmes, J. Membr. Sci., 2011, 369, 367–374 CrossRef CAS PubMed.
  14. J. Park, L. Wang, S. G. Advani and A. K. Prasad, J. Electrochem. Soc., 2012, 159, F864–F870 CrossRef CAS PubMed.
  15. T.-C. Jao, G.-B. Jung, S.-C. Kuo, W.-J. Tzeng and A. Su, Int. J. Hydrogen Energy, 2012, 37, 13623–13630 CrossRef CAS PubMed.
  16. A. C. Fernandes and E. A. Ticianelli, J. Power Sources, 2009, 193, 547–554 CrossRef CAS PubMed.
  17. L. Yang, J. Tang, L. Li, F. Ai, X. Chen, W. Z. Yuan and Y. Zhang, RSC Adv., 2013, 3, 7289–7295 RSC.
  18. W. Y. Hsu and T. D. Gierke, Macromolecules, 1982, 15, 101–105 CrossRef CAS.
  19. T. Gierke, G. Munn and F. Wilson, J. Polym. Sci., Polym. Phys. Ed., 2003, 19, 1687–1704 CrossRef.
  20. J. E. Hensley, J. D. Way, S. F. Dec and K. D. Abney, J. Membr. Sci., 2007, 298, 190–201 CrossRef CAS PubMed.
  21. A. Pozio, M. De Francesco, A. Cemmi, F. Cardellini and L. Giorgi, J. Power Sources, 2002, 105, 13–19 CrossRef CAS.
  22. J. Lin, P. H. Wu, R. Wycisk, P. N. Pintauro and Z. Shi, Macromolecules, 2008, 41, 4284–4289 CrossRef CAS.
  23. S. Zaidi, S. Mikhailenko, G. Robertson, M. Guiver and S. Kaliaguine, J. Membr. Sci., 2000, 173, 17–34 CrossRef CAS.
  24. S. Kundu, L. C. Simon, M. Fowler and S. Grot, Polymer, 2005, 46, 11707–11715 CrossRef CAS PubMed.
  25. F. Wang, H. Tang, M. Pan and D. Li, Int. J. Hydrogen Energy, 2008, 33, 2283–2288 CrossRef CAS PubMed.
  26. D. K. Paul, A. Fraser and K. Karan, Electrochem. Commun., 2011, 13, 774–777 CrossRef CAS PubMed.
  27. A. G. Kannan, N. R. Choudhury and N. K. Dutta, J. Membr. Sci., 2009, 333, 50–58 CrossRef CAS PubMed.
  28. X. Luo, S. Holdcroft, A. Mani, Y. Zhang and Z. Shi, Phys. Chem. Chem. Phys., 2011, 13, 18055 RSC.
  29. C. H. Wang, C. C. Chen, H. C. Hsu, H. Y. Du, C. P. Chen, J. Y. Hwang, L. C. Chen, H. C. Shih, J. Stejskal and K. H. Chen, J. Power Sources, 2009, 190, 279–284 CrossRef CAS PubMed.
  30. B. P. Tripathi, M. Kumar and V. K. Shahi, J. Membr. Sci., 2009, 327, 145–154 CrossRef CAS PubMed.
  31. Y. Zhang, W. Cai, F. Si, J. Ge, L. Liang, C. Liu and W. Xing, Chem. Commun., 2012, 48, 2870–2872 RSC.
  32. A. Manthiram, Z. Zuo and X. Zhao, RSC Adv., 2013, 3, 6759–6762 RSC.
  33. C. Y. Yen, C. H. Lee, Y. F. Lin, H. L. Lin, Y. H. Hsiao, S. H. Liao, C. Y. Chuang and C. C. M. Ma, J. Power Sources, 2007, 173, 36–44 CrossRef CAS PubMed.
  34. Y. A. Elabd, E. Napadensky, J. M. Sloan, D. M. Crawford and C. W. Walker, J. Membr. Sci., 2003, 217, 227–242 CrossRef CAS.

Footnote

Electronic supplementary information (ESI) available. See DOI: 10.1039/c3ra46182c

This journal is © The Royal Society of Chemistry 2014
Click here to see how this site uses Cookies. View our privacy policy here.