On-chip detection of multiple serum antibodies against epitopes of celiac disease by an array of amorphous silicon sensors

Francesca Costantini *a, Augusto Nascetti b, Riccardo Scipinotti c, Fabio Domenici d, Simona Sennato e, Laura Gazza e, Federico Bordi d, Norberto Pogna e, Cesare Manetti a, Domenico Caputo c and Giampiero de Cesare c
aDipartimento di Chimica, Sapienza Università di Roma, p.le Aldo Moro 5, 00185 Rome, Italy. E-mail: costan.fra@gmail.com
bDipartimento di Ingegneria Astronautica, Elettrica ed Energetica, Sapienza Università di Roma, via Salaria 851/881, 00138 Rome, Italy
cDipartimento di Ingegneria dell'Informazione, Elettronica e Telecomunicazione, Sapienza Università di Roma, via Eudossiana 18, 00184 Rome, Italy
dDipartimento di Fisica, Sapienza Università di Roma, p.le Aldo Moro 5, 00185 Rome, Italy
eConsiglio per la Ricerca e la Sperimentazione in Agricoltura (CRA-QCE), Via Cassia 176, 00191 Rome, Italy

Received 23rd October 2013 , Accepted 8th November 2013

First published on 11th November 2013


Abstract

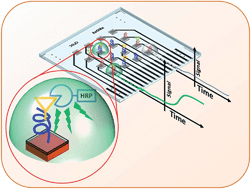
In this paper, we present the preliminary results of an ELISA-on-chip device, intended as a technological demonstrator of a novel analytical system suitable for the diagnosis and follow-up of celiac disease. The idea of the work is to combine an array of amorphous silicon photosensors with a pattern of a poly(2-hydroxyethyl methacrylate) polymer brush film, which acts as anchor for the immobilization of gliadin peptides containing the celiac disease epitopes. Recognition relies on a sandwich immunoassay between antibodies against the peptides and secondary antibodies marked with horseradish peroxidase to obtain a chemiluminescent signal. Detection is based on the measurement of photocurrent induced in the array of amorphous silicon photosensors by the chemiluminescent signal. An ad-hoc procedure has been developed in order to enable the fabrication of the photodiode array and the polymer brush pattern on the two sides of the same glass substrate ensuring the compatibility of the different technological steps. The sensitivity and the selectivity of the chip for multiplex immunoassays were demonstrated using two gliadin peptides (VEA and DEC). In particular, we found that the average amount of the bound HRP revealed by our analytical protocol is 3.5(±0.3) × 10−6 pg μm−2 and 0.85(±0.3) × 10−6 pg μm−2 for specific and non-specific interactions, respectively.

1 Introduction

Celiac disease (CD) is a gluten-sensitive enteropathy, affecting genetically susceptible individuals, characterized by an inappropriate T-cell-mediated immune response to the ingestion of some dietary cereal proteins contained in gluten. The heightened immunological responsiveness causes the destruction of the small-intestinal mucosal morphology and intestinal dysfunction. Celiac disease affects approximately 1% of individuals but remains largely unrecognized.1 The diagnosis and the treatment should be made early, since untreated disease causes growth retardation and atypical symptoms such as infertility and neurological disorders. Current diagnostic procedure is based on serological tests for detection of anti-tissue transglutaminase (anti-tTG) and anti-endomysial (anti-EmA) antibodies and afterwards the histological examination of at least one biopsy.2 Recent studies have demonstrated that the identification of antibodies to deamidated gliadin peptides (gliadin is the alcohol soluble fraction of gluten) can be applied, as novel biomarkers, for the diagnosis of CD and for monitoring the adherence of CD patients to a gluten-free diet (GFD).3 The detection of these biomarkers showed significantly higher specificity and reproducibility than the anti-tTG and anti-EmA, respectively, therefore their recognition has becoming fundamental for CD patients. Detection of these antibodies is usually performed by enzyme-linked immunosorbent assay (ELISA)-based screening tests,4 which require bulky and expensive equipment, therefore can be performed only at special laboratory facilities. Electrochemical immunosensors5–8 and tapered optical fiber biosensor9 devices have been developed for the detection of both anti-gliadin and anti-tTG antibodies, as a valuable alternative to classical ELISA tests. However, there are no reports that describe devices for the simultaneous detection of multiple antibodies against deamidated gliadin peptides (GPs).

The advent of miniaturized array technology has enabled parallel and multiple comparative measurements of different samples combining high sensitivity, low sample consumption, high-throughput and rapidity of the analysis.10,11 In this framework, microarray chips, with tens to thousand of micro-spots of immobilized capture agents (probes) having binding activity against specific analyte molecules (targets), have become a well established research tool in basic and applied science. The capture agents are spatially encoded to form a known pattern, which permits the recognition of the binding events between the probe and the target.

Currently, different kinds of microarray chip are available on the market (i.e. Affymetrix®, Agilent©, Luminex©) for the analysis of DNA, RNA10 and different biomarkers,11,12 and many others are being realized using new types of probe-biomolecules13–16 and/or microorganisms17 and cells,12 for the analysis of several targets such as biological fluids (biomedical applications)16 or extracts of food and beverages (food-safety applications).18

The key issue for the development of devices, based on microarray technology, is the integration of the physical-chemistry techniques for the fabrication of the patterned probes, and the detection system for the biochemical recognition of the targets, to create a simple and low cost solid platform accessible also to not specialized personnel.19

Several materials including glass and quartz, gold, silicon, polymers, filter membranes, optical fibres and beads can be applied to create a microarray of pattern probes,20 which are either physically adsorbed or covalently immobilized by means of different chemical strategies.21

Targets recognition relies on various different detection systems, which have been coupled to microarray platforms. These detection methods are based on either label-free or label-based approaches. The first category includes techniques such as mass spectrometry,15 optical biosensor technology (including reflectometric interference spectroscopy22 and surface plasmon resonance imaging23). Among labeled-based approaches, fluorescence,24–26 chemiluminescence27–30 and radioactivity combined with charge coupled device (CCD) cameras or laser scanners are the most applied for detection.15

Although the advantage of these methods is the high sensitivity, they can be expensive and sometimes require bulky instrumentation,23 and therefore technology has been focused in the development of sensors, which can be integrated within microarray chip. Examples are microelectrical sensors based on the use of silica nanowires, impedimetric, surface acoustic waves, magnetic nanoparticles and microantenna technologies.31 However, these systems showed limitations associated with sensor fabrication and sensitivity, which need to be resolved. An alternative approach consists in using photosensors in the microarray platform.26,32–34 This solution allows the use of conventional high-sensitivity optical detection techniques and, at the same time, it does not require major changes in the platform both in terms of substrate material and microarray layout. In particular, this is true if thin-film large-area electronic technologies as organic electronics (also referred to as plastic electronics) or amorphous silicon technology are used.35–38 In the last decade, several examples have been presented proving the feasibility of analytical systems based on both the above-mentioned technologies. These examples include both labelled and label-free techniques using different analytical methods such as stimulated fluorescence,39–42 chemiluminescence43–45 and optical absorption.37,38,46 In particular, chemiluminescence appears to be very attractive since it does not require external radiation sources as in fluorescence case and does not suffer of background signals.

In this work, for the first time, we report on the development of an ELISA-on-chip device for the simultaneous detection of multiple CD antibodies against GPs. In this system, recognition, detection and read out elements are all performed in a single glass substrate without external, bulky and expensive equipment. This aim has been achieved by combining and optimizing surface chemistry with microelectronic processes on the two opposite sides of a glass substrate.

The device is constituted by an array of a-Si:H photosensors aligned with a pattern of poly(2-hydroxyethyl methacrylate) polymer brushes (PHEMA)47–49 which act as anchors for the immobilization of GPs (probes). The test relies on a sandwich immunoassay between antibodies against these GPs (target) and a secondary antibody marked with horseradish peroxidase (HRP) which is used to obtain a chemiluminescent signal detected by the a-Si:H photosensors. We have fabricated and characterized a technological demonstrator in order to test the sensitivity and the specificity of the device for multiplex immunoassay analysis using two different GPs named VEA and DEC.

2 Experimental

2.1 Reagents

All reagents were purchased from Aldrich Chemicals. 2-Hydroxyethyl methacrylate (HEMA) was distilled prior to use, whereas the other chemicals were used without further purification. 2-Bromo-2-methyl-propionic acid 3-trichlorosylanyl-propyl ester (BMPTS) was synthesized following a reported procedure.50 Methanol and isopropanol (analytical reagent grade) were used without further purification, while toluene was distilled over sodium. Synthetic gliadine peptides PQPQLPYPQ (VEA) and QQPQDAVQPF (DEC), anti-VEA and anti-DEC rabbit antisera and secondary antibody anti-rabbit marked with HRP were provided by Primm (Milan, Italy). Water was purified with a Milli-Q Plus (MILLIPORE, R = 18.2 MΩ cm) ultra-pure water system. SU-8 2005 photoresist, its developer and its remover were purchased from Micro Resist Technology GmbH (Germany). SuperSignal West PICO Chemiluminescent reagents – Trial Kit was purchased from Thermo Scientific.

2.2 Equipment

The fabrication of the sensor array has been performed using the following apparatus: a three UHV chambers Plasma Enhanced Chemical Vapor Deposition (PECVD) system (from Glasstech Solar Inc.) for a-Si:H intrinsic and doped layers deposition; a clean room with the basic apparatus of the microelectronic technology, such as a vacuum evaporation (BALZERS 510) and magnetron sputtering (MRC) systems for thin film deposition, a photoplotter and a mask-aligner (TAMARACK 152R) for lithography process, a Reactive Ion Etching system (IONVAC PROCESS) and a chemical bench for wet and dry etching of thin film. Characterization has been performed in a laboratory for optical and electrical characterization of materials and devices. In particular, the sensors of the array were individually characterized by measuring their current–voltage characteristics in dark conditions and responsivity at 465 nm, which is the emission peak wavelength of the chemiluminescent reagents used in this study. The measurements in dark conditions were performed using a Keithley 236 Source Measure Unit (SMU) to bias the photodiode and to measure its current. The sensor responsivity was measured by using a quantum efficiency setup, which includes a tungsten light source, a monochromator (model Spex 340E from Jobin-Yvon), an UV-enhanced crystalline silicon diode (model DR 2550-2BNC from Hamamatsu) used as reference, a beam-splitter and focusing optics (from Melles-Griot). The responsivity value (R) was calculated following the equation:
 
R = Iph,sens/Pinc,sens(1)
where Iph,sens is the photocurrent of the a-Si:H photosensor and Pinc,sens is the light intensity impinging on it. This intensity has been calculated from the measured photocurrent of the reference diode taking into account its responsivity at 465 nm and the calibration factor due to the beam splitter. The a-Si:H and reference diode photocurrents were measured in short circuit conditions using two Keithley 236 SMUs.

2.3 Fabrication of the chip

The fabrication of the whole chip uses five photolithographic masks:

- four masks for the fabrication of the sensor array on one face of the glass substrate;

- one mask to define PHEMA pattern on the opposite face of the same glass chip.

2.3.1 Fabrication of the photosensors. The fabrication of the photosensor array was performed through the following steps:

(1) deposition and pattering by photolithography of the TCO window layer for the definition of the front electrode of the photodiodes (mask 1);

(2) deposition by PECVD of the a-Si:H layers;

(3) deposition by magnetron sputtering of a stack of three metal layers (Cr/Al/Cr), which acts as back electrode of the sensors;

(4) mesa patterning of the device structure by wet and reactive ion etching for the metal stack and a-Si:H layers respectively (mask 2);

(5) deposition of a 5 μm thick SU-8 layer acting as insulation layer between the back metal and the front TCO contacts;

(6) opening of via holes over the diodes on the passivation layer (mask 3);

(7) deposition by magnetron sputtering of a TiW metal layer for the definition of external connection of the photodiodes;

(8) patterning of the TiW external contacts (mask 4).

The area of each photodiode is 2 × 2 mm2.

2.3.2 Functionalization of the chip. The formation of the patterned PHEMA film was first tested on a glass slide without the a-Si:H sensors, in order to study the formation of the film and its functionalization by AFM analysis, while silicon oxide substrates were functionalized to perform FTIR (for more details see ESI).

The PHEMA dots on standard glass slides were obtained using sacrificial SU-8 layer patterned by photolithography (mask 5). In particular, the following procedure has been implemented to define the dots:

(1) rinsing with piranha and treatment with oxygen plasma. Piranha (H2SO4–H2O2 3[thin space (1/6-em)]:[thin space (1/6-em)]1) was performed for 10 min and rinsed out with MilliQ water. Oxygen plasma was performed for 90s employing reactive ion etching apparatus using the following parameters: oxygen flow 100 sccm, power density 200 mW cm−2, pressure 800 mTorr.

(2) spin-coating of the SU-8 2005 and exposure to UV light using mask 5, which has the dot pattern aligned with the array of photosensors. The glass slides were sonicated for 1 min in a solution of SU-8 developer, rinsed with isopropanol and dried with a stream of nitrogen.

(3) soaking in a solution of 0.2% of BMPTS in dry toluene over night (room temperature), rinsing with dry toluene and drying with a stream of nitrogen.

(4) removing of the SU-8 layer immersing the glass slides for a few minutes in a solution of SU-8 remover, afterwards they were rinsed with methanol and dried with the stream of nitrogen.

In order to prepare the PHEMA brush film, a solution of 20 mL 2-hydroxyethyl methacrylate (HEMA) and 20 mL water was degassed by bubbling through dry nitrogen (N2) for 30 min and transferred in a schlenk tube where it was stored under argon. Copper(I) chloride (0.110 g), copper(II) bromide (0.072 g) and 2.2′-dipyridyl (0.488 g) were added. To dissolve all the solid, the mixture was stirred for 10 min (while degassing), which yielded a dark brown solution.

The solution was then sonicated until complete dissolution of the solid and subsequently transferred with a cannula in the schlenk tube containing the glass substrates. After the polymerization (over night, in the dark), the samples were removed and washed with methanol and MilliQ water.

The PHEMA polymer films were treated (24 h, 25 °C) with a solution of succinic anhydride (100 mg) and triethylamine (100 μL) in 2 mL of dry tetrahydrofuran (THF). Subsequently, they were rinsed with THF and Milli-Q water and dried with a stream of nitrogen. 1 mL solution of n-hydroxysuccinimide (NHS) (13 mg) and of 1-ethyl-3-(3-dimethylaminopropyl) carbodiimide (EDC) (75 mg) was poured on the films and left to react for 1 h. The films were rinsed with water and dried with a stream of nitrogen. Subsequently, a phosphate buffer solution of peptide VEA or DEC at pH = 7.5 25 mM were poured on the substrates and left to react for 3 h. The substrates were rinsed with a phosphate buffer solution for 5 min (3 times) and with MilliQ water and dried with a stream of nitrogen. The substrates were treated with a solution of 10 mM ethanolamine in phosphate buffer pH = 7.5, 25 mM for 20 min in order to block the unreacted NHS-ester groups. The substrates were abundantly rinsed with MilliQ water and dried with a stream of nitrogen.

The array of a-Si:H sensors chip was functionalized following the same procedure reported for the glass slides. The glass surface of the chip was cleaned exclusively with oxygen plasma since piranha solution might affect the functionality of the array of a-Si:H sensors. During the functionalization of the chip, a custom-made holder was employed in order to avoid any contact between THF and the opposite side of the glass hosting the photosensors.

The procedure implemented for the device fabrication has been optimized to keep the functional compatibility of the different technological steps. For this purpose, the photosensors have been deposited and patterned before the peptide immobilization in order to avoid instability effects, due to the PECVD temperature (around 200 °C).

2.3.3 Procedure for the on-chip immunoenzymatic reaction. The PHEMA-peptide functionalized films were reacted with the solution of the rabbit serum containing the primary antibodies against either VEA (anti-VEA) or DEC (anti-DEC). After 1 h the substrates were rinsed with phosphate buffer solution (pH = 7.5, 25 mM, 5 min 3 times) and MilliQ water, and dried with a stream of nitrogen. Then, a solution of secondary antibody (1[thin space (1/6-em)]:[thin space (1/6-em)]250 v/v) marked with horseradish peroxidase (Ig-HRP) was spotted on the PHEMA functionalized substrates and left reacted for 15 min. The films were rinsed with the phosphate buffer solution (pH = 7.5, 25 mM, 5 min for 3 times) and with MilliQ water and dried with a stream of nitrogen.

The chip was inserted in a card edge connector that individually connects the photosensors to the bias and read-out equipment. In particular, the current of three different sensors of the array has been simultaneously measured. The experimental protocol has been designed scheduling a set of experiments each involving three reaction sites at a time.

The chip was enclosed in a light-shielded box and, for each experiment, the photodiode dark current was acquired for 2 min and the average dark current value was calculated.

In each experiment, a drop of chemiluminescent reagent (2 μL) was spotted on the selected functionalized PHEMA site. In this case, the box was opened and the photodiodes were exposed to dimmed ambient light. Thereafter, the light-shielded box was closed again and the current acquisition started after 30 s in order to get rid of the a-Si:H photodiode current transient due to charge detrapping after the exposure to ambient light.51 The acquisition lasted 10 min. The CL-induced photocurrent is calculated by subtracting the average dark current value from the current measured during the chemiluminescent reactions.

3 Results and discussion

3.1 Chip: concept and characteristics

The chip integrates the recognition and the transducing elements in a single device. In particular, one side of a glass substrate hosts an array of a-Si:H photosensors that act as optical transducer element, while the opposite side is functionalized to immobilize GPs for the recognition of the specific antibodies.

As a first step, a 4 × 4 photosensor array has been fabricated on a 5 × 5 cm2 ultrasonically cleaned glass substrate following the technological steps described in the experimental section (Fig. 1).


image file: c3ra46058d-f1.tif
Fig. 1 Picture of the fabricated photosensor array. The 16 black-squares are the photodiodes while the black U-shaped broad line and four black lines, each connecting a single column of photosensors, represent the common back contact. The front contacts connecting the p-layer of each photodiode to the 16 lines in the upper part of the device are not visible because are made in ITO.

In the fabricated array reported in Fig. 1, the squares are the photosensors and the broad external line their common back contact. The front contacts of the photodiodes are not visible because they are transparent.52 The area of the sensor (2 × 2 mm2) has been chosen to maximize the collection of the chemiluminescent signal resulting from the immunoenzimatic reaction. At the same time, as we have found from the current–voltage characteristics, this size guarantees a dark current level (4 × 10⁻¹³ A at small reverse voltage) low enough to keep noise contribution of the dark current well below the minimum detectable signal in our experimental set-up. The responsivity value at 465 nm (1.46 μW cm−2 intensity) has been found to be 247 mA W−1, which is comparable to that of state-of-the-art crystalline silicon photodiodes.

The reproducibility of these values has been verified comparing the performances of photodiodes fabricated both in the same and in different runs. Averaged values of dark current and responsivity showed a deviation below 5%.43 Furthermore, the degradation of the optoelectronic properties of the photodiode due to illumination is negligible, because the intensity radiation is very low in all the experiments performed.38

3.2 Glass chip functionalization for GPs antibodies detection

The immobilization on the chip surface of the sensing bioelement (probe), which specifically recognizes the analyte (target), is the key-step in the construction of a biosensing device. The main issues for the immobilization method are the stability, the activity and the concentration of the immobilized target that permits the transducing mechanism.

Recently, polymer films have been applied for many applications in the field of biosensing.53 In particular, the use of polymer brushes for the immobilization of biomolecules49,54 to develop microarrays55 and biomedical devices47 has been described. The main advantages of these brush films lay on the control over the amount of the immobilized biomolecules by varying the polymerization time,56,57 the preserved biological activity after the coupling reaction47,58 and the reduction of nonspecific interactions.49 In this work, a pattern of PHEMA brushes has been applied for the immobilization of GPs (target) onto the surface of the glass chip in order to create sixteen transducing sites aligned with the a-Si:H photosensors. Each site is used for the recognition of GPs antibodies: the photosensor positioned below each site allows the detection of the chemiluminescent signal, which indicates the presence of the antibodies against a specific GP present in the serum.

Sacrificial layer photolithography with SU-8 2005 photoresist was used to define the formation of the PHEMA sites on the glass chip. Being resistant to toluene, this type of photoresist permits the formation of the BMPTS self assembled monolayer (SAM) in solution (Fig. 2a) and can be easily removed after the monolayer formation.


image file: c3ra46058d-f2.tif
Fig. 2 Procedure for the immobilization of the peptides on glass/silicon oxide surfaces, (a) formation of the patterned initiator monolayer (BMPTS), (b) removal of SU-8 photoresist and formation of PHEMA pattern, (c) PHEMA functionalization with succinic anhydride (PHEMA-SA), (d) PHEMA-SA functionalization with NHS (PHEMA-SA-NHS) and (e) immobilization of GP (PHEMA-GP).

The fabrication of the PHEMA brush pattern and its functionalization was accomplished by applying a previously published procedure.47 PHEMA sites were formed by atom transfer radical polymerization (ATRP), BMPTS acting as initiator layer (Fig. 2b). Afterwards, the PHEMA sites were treated with succinic anhydride (SA) and n-hydroxysuccinimide (NHS) in presence of 1-ethyl-3-(3-dimethylaminopropyl) carbodiimide (EDC) to chemically modify the hydroxyl groups along the PHEMA brushes to carboxylic (PHEMA-SA) and NHS-ester (PHEMA-SA-NHS) functions, respectively (Fig. 2c–d).

A phosphate buffer solution (pH = 7.5, 25 mM) of peptides was poured on the functionalized PHEMA pattern and left to react for 3 h. The peptides are immobilized in the PHEMA brushes through the formation of amide bonds between the amino groups of the amino acid of the peptide and the NHS-ester groups of the functionalized PHEMA layer (Fig. 2e). After rinsing, the functionalized PHEMA sites were treated with a solution of ethanolamine in phosphate buffer, in order to block the unreacted NHS-ester groups, which might interact with other species present in the serum.

Initially, the formation and functionalization of PHEMA was performed on standard glass and silicon oxide substrates in order to study the formation and the functionalization of the brush layer by atomic force spectroscopy (AFM), Fourier transform infrared spectroscopy (FTIR) and field emission scanning electron microscopy (FESEM) (see ESI). AFM analysis showed that PHEMA film has a thickness of 190 nm after overnight polymerization time.

Following the immobilization of VEA peptide (PHEMA-VEA), the thickness of the layer increases up to 496 nm. AFM analysis performed after incubation of PHEMA-VEA with rabbit serum containing anti-VEA and secondary antibody marked with HRP (Ig-HRP) exhibited a thickness of 626 and 646 nm, respectively. The progressive increase of layer thickness suggests the successful immobilization of both peptides and antibodies.

Additional evidence was achieved by FTIR spectroscopy, which shows the characteristic absorption bands upon each step of the chemical modification of the layers (see ESI).

The FESEM analysis of the substrate confirmed the formation of PHEMA pattern sites by photolithography and images are given in the ESI.

After applying the procedure for the formation and functionalization of the PHEMA pattern onto the chip surface, the optoelectronic characteristics of the photosensors (dark current and responsivity) were verified by measuring the current–voltage curves in dark condition and under illumination with a light source at 465 nm wavelength. The results showed that the photosensors were not affected by the optimized chemical procedure.

3.3 Immunoenzymatic reaction on the glass chip

In order to show that the glass chip can be used for the simultaneous detection of multiple antibodies against GPs, an immunoenzymatic reaction was carried out on the patterned PHEMA sites aligned with the photosensors. The sites were functionalized either with peptide VEA or DEC, as schematically reported in Fig. 3, whereas some sites were left unreacted, according to the scheme reported below:
image file: c3ra46058d-f3.tif
Fig. 3 Schematic representation of CL signal formation and detection on the chip sensor array after incubation of (a) Ig-VEA and Ig-HRP with the immobilized VEA peptide, (b) Ig-DEC and Ig-HRP with the immobilized DEC peptide, and (c) Ig-VEA and Ig-HRP with DEC peptide.

(i) six sites were functionalized with VEA peptide. Afterwards, three VEA sites were incubated with the serum of rabbit containing anti-VEA (Ig-VEA), while the three other sites were left without any further functionalization (VEA-only);

(ii) six sites were functionalized with DEC peptide. Afterwards, three DEC sites were incubated with the serum of rabbit containing anti-DEC (Ig-DEC), while the other three sites were incubated with the rabbit serum containing anti-VEA;

(iii) four sites were not functionalized with the peptides. In this case, the NHS-ester functions along the brush film were reacted only with ethanolamine (PHEMA-only) to avoid any interaction with other species present in the serum.

After the incubation with the serum containing the primary antibodies, the chip was copiously rinsed with a solution of phosphate buffer. Subsequently, a solution of the secondary antibody anti-rabbit marked with HRP (Ig-HRP) was poured on all chip sites and incubated for 15 min. The chip was then inserted in the card-edge connector and connected to the read-out electronics for testing the immunoenzymatic reaction.

This experimental design should establish whether the present chip device is able to detect the binding of the GPs with its specific antibody. In fact, the primary antibody against either VEA or DEC selectively binds the specific peptides, while the antirabbit-HRP antibody (Ig-HRP) binds to all the primary antibodies previously linked to their specific peptide, forming a sandwich-like structure (Fig. 3a–b). In order to verify that the binding events have occurred, a solution of the chemiluminescent reagents was poured on the PHEMA functionalized sites. HRP catalyzes the reaction between luminol and hydrogen peroxide yielding a chemiluminescent signal, which is detected as photocurrent by the photosensors positioned underneath.

As a drop of the chemiluminescent (CL) cocktail is spotted on a PHEMA-GP sites, previously incubated with the specific primary antibody and Ig-HRP solutions, the photocurrent signal increases reaching a maximum signal of ca. 20 pA after 10 minutes. Afterwards, the signal drops to zero showing the end of the chemiluminescent reaction (solid squares in Fig. 4).


image file: c3ra46058d-f4.tif
Fig. 4 Plot of photocurrent signal versus time for each type of functionalized PHEMA site after spotting the chemiluminescent cocktail.

On the other hand, when CL cocktail is placed on a PHEMA-GP site incubated with the nonspecific primary antibody and Ig-HRP (Fig. 3c), the photocurrent signal increase only to ca. 5 pA (open squares on Fig. 4). The lowest photocurrent values are observed on those sites not incubated with the primary antibodies (i.e. VEA-only and PHEMA-only). These results demonstrate that the photosensors selectively distinguish the type of biochemical reaction occurring on each type of functionalized PHEMA sites.

In addition, the trend of the photocurrent reported in Fig. 4 shows the behaviour of the chemiluminescent reaction during the time: (i) the increase of the photocurrent corresponds to the formation of the light upon reaction between luminol and hydrogen peroxide in the presence of HRP, reaching a maximum signal which depends on the concentration of HRP, (ii) the decrease of photocurrent is ascribed to the consumption of the chemiluminescent substrate during the reaction (iii) as the CL signal extinguishes the initial dark condition is recovered. In order to prove the reproducibility of the device response to the immunoenzymatic reaction, the same experiment was also performed on multiple sites, which were functionalized using the same chemical procedure. The average value of the photocurrent signals, for each type, is reported in Fig. 5. As expected, in all the cases, the highest photocurrent intensities occurred in correspondence of the PHEMA functionalized sites where primary antibodies (anti-VEA or anti-DEC) were incubated with the specific peptides (positive control).


image file: c3ra46058d-f5.tif
Fig. 5 Photocurrent signal intensities as a function of binding event type occurring on the different PHEMA functionalized sites of the chip device. The error bars represent the standard deviations of the signals.

On the other hand, when primary antibodies were reacted with the nonspecific peptide, photocurrent was four times smaller (negative control). In addition, the small increase of photocurrent observed on the sites where, neither the primary antibodies nor antirabbit-HRP were incubated (VEA only and PHEMA only), was attributed to luminol oxidation occurring in the absence of HRP and is considered as the blank signal. This behaviour suggest that the photocurrent signal recorded during the negative control experiment is the sum of the blank signal plus possible nonspecific adsorption of the antibodies to the polymer film.

This experiment proves that this device permits to recognize the presence of the specific antibodies against GPs in the serum and to distinguish between specific and nonspecific immune interactions.

The PHEMA functionalized brush film did not detach when brought into contact with the serum solution. Moreover, both immunoenzymatic reaction and detection of CL signal by the sensors were not affected by the PHEMA functionalized brush film.

A calibration curve, in which sensor photocurrent is measured as function of HRP concentration, was performed in a precedent published work,43 where the same chip device was also used. According to these data the sensitivity of this detection method is 1.46 pA pg−1. By combining the value of the sensitivity with the photocurrent signal obtained for the specific and not specific binding, the amount of the bound HRP results to be 3.5(±0.3) × 10−6 pg μm−2 and 0.85(±0.3) × 10−6 pg μm−2, respectively. These values are within the calibration curve.

The ratio between the number of secondary and primary antibody for each binding event is not known; therefore it is not possible to calculate the concentration of the primary antibody linked to the peptides immobilized to the brush film. However, to the clinical diagnostic of this autoimmune condition the most important aspect is the qualitative detection of the serological markers (presence or not of the antibodies against GPs). For this reason the results obtained with the rabbit serum are a proof of principle to demonstrate that our device is capable to distinguish the biochemical recognition of an antibody to its CD epitopes. Further research is focused on the detection of antibodies against GPs in human serum.

The standard deviation of the blank signal was used to calculate the limit of detection (LOD) and limit of quantification (LOQ) of this chip-based detection method, which resulted to be 200 pg mL−1 and 665 pg mL−1, respectively. The LOD is comparable with the best detection limits of the conventional ELISA kit and with those obtained by novel bioaffinity-based methods.59–61 In addition, the immunoenzymatic reaction on the device exhibited the same behaviour as expected by using the standard ELISA method, with the advantages of the on-chip detection, lower sample consumption for multiple analyses.

4 Conclusions

This paper reports the fabrication and the characterization of a glass-chip based on an array of amorphous silicon photosensors and gliadin peptides as a novel ELISA-on-chip device for the diagnosis and follow-up of celiac disease. The formation and the chemical derivatization of the PHEMA film patterned on the chip surface allowed the immobilization of multiple prolamine peptides. Furthermore, the integration of the chemical procedure with the a-Si:H photosensors allows the on chip detection of multiple peptide interactions with the specific antibodies. The chip-device clearly establishes the specific and nonspecific binding of the antibodies, which is the key-issue to achieve a multiple assay system for the diagnosis of CD disease based on GPs. In addition, it is remarkable that immunoenzymatic reaction for GPs antibody recognition was performed using the rabbit serum solution without any treatment.

The present immobilization procedure can easily be extended to other biomolecules, opening a route towards a novel generation of smart ELISA kit assay for bio-analytical applications. In particular, the integration of the photosensor array chip with a dedicated microfluidic network62 will lead to easier sample handling, automation and higher reproducibility of the technique.

Notes and references

  1. P. H. R. Green and C. Cellier, N. Engl. J. Med., 2008, 358, 748–749 CAS .
  2. M. Neves, M. B. Gonzalez-Garcia, H. P. A. Nouws, C. Delerue-Matos, A. Santos-Silva and A. Costa-Garcia, Anal. Bioanal. Chem., 2010, 397, 1743–1753 CrossRef PubMed .
  3. U. Volta, A. Granito, E. Fiorini, C. Parisi, M. Piscaglia, G. Pappas, P. Muratori and F. B. Bianchi, Dig. Dis. Sci., 2008, 53, 1582–1588 CrossRef CAS PubMed .
  4. P. Vermeersch, K. Geboes, G. Marien, I. Hoffman, M. Hiele and X. Bossuyt, Clin. Chim. Acta, 2010, 411, 931–935 CrossRef CAS PubMed .
  5. T. Balkenhohl and F. Lisdat, Anal. Chim. Acta, 2007, 597, 50–57 CrossRef CAS PubMed .
  6. S. Dulay, P. Lozano-Sanchez, E. Iwuoha, I. Katakis and C. K. O'Sullivan, Biosens. Bioelectron., 2011, 26, 3852–3856 CrossRef CAS PubMed .
  7. M. Neves, M. B. Gonzalez-Garcia, H. P. A. Nouws and A. Costa-Garcia, Biosens. Bioelectron., 2012, 31, 95–100 CrossRef CAS PubMed .
  8. M. I. Pividori, A. Lermo, A. Bonanni, S. Alegret and M. del Valle, Anal. Biochem., 2009, 388, 229–234 CrossRef CAS PubMed .
  9. J. M. Corres, I. R. Matias, J. Bravo and F. J. Arregui, Sens. Actuators, B, 2008, 135, 166–171 CrossRef CAS PubMed .
  10. M. J. Heller, Annu. Rev. Biomed. Eng., 2002, 4, 129–153 CrossRef CAS PubMed .
  11. D. N. Howbrook, A. M. van der Valk, M. C. O'Shaughnessy, D. K. Sarker, S. C. Baker and A. W. Lloyd, Drug Discovery Today, 2003, 8, 642–651 CrossRef CAS .
  12. K. Ward, Am. J. Obstet. Gynecol., 2006, 195, 364–372 CrossRef PubMed .
  13. L. Berrade, A. E. Garcia and J. A. Camarero, Pharm. Res., 2011, 28, 1480–1499 CrossRef CAS PubMed .
  14. M. Hartmann, J. Roeraade, D. Stoll, M. Templin and T. Joos, Anal. Bioanal. Chem., 2009, 393, 1407–1416 CrossRef CAS PubMed .
  15. M. F. Templin, D. Stoll, M. Schrenk, P. C. Traub, C. F. Vohringer and T. O. Joos, Drug Discovery Today, 2002, 7, 815–822 CrossRef CAS .
  16. X. B. Yu, N. Schneiderhan-Marra and T. O. Joos, Clin. Chem., 2010, 56, 376–387 CAS .
  17. S. F. Al-Khaldi and M. M. Mossoba, Nutrition, 2004, 20, 32–38 CrossRef CAS PubMed .
  18. M. M. Ngundi, L. C. Shriver-Lake, M. H. Moore, M. E. Lassman, F. S. Ligler and C. R. Taitt, Anal. Chem., 2005, 77, 148–154 CrossRef CAS PubMed .
  19. P. Yager, G. J. Domingo and J. Gerdes, Annu. Rev. Biomed. Eng., 2008, 10, 107–144 CrossRef CAS PubMed .
  20. I. Barbulovic-Nad, M. Lucente, Y. Sun, M. J. Zhang, A. R. Wheeler and M. Bussmann, Crit. Rev. Biotechnol., 2006, 26, 237–259 CrossRef CAS PubMed .
  21. P. Wu, D. G. Castner and D. W. Grainger, J. Biomater. Sci., Polym. Ed., 2008, 19, 725–753 CrossRef CAS PubMed .
  22. G. Proll, L. Steinle, F. Proll, M. Kumpf, B. Moehrle, M. Mehlmann and G. Gauglitz, J. Chromatogr., A, 2007, 1161, 2–8 CrossRef CAS PubMed .
  23. S. Scarano, M. Mascini, A. P. F. Turner and M. Minunni, Biosens. Bioelectron., 2010, 25, 957–966 CrossRef CAS PubMed .
  24. C. Barzen, A. Brecht and G. Gauglitz, Biosens. Bioelectron., 2002, 17, 289–295 CrossRef CAS .
  25. M. Pawlak, E. Schick, M. A. Bopp, M. J. Schneider, P. Oroszlan and M. Ehrat, Proteomics, 2002, 2, 383–393 CrossRef CAS .
  26. C. R. Taitt, G. P. Anderson and F. S. Ligler, Biosens. Bioelectron., 2005, 20, 2470–2487 CrossRef CAS PubMed .
  27. K. A. Heyries, M. G. Loughran, D. Hoffmann, A. Homsy, L. J. Blum and C. A. Marquette, Biosens. Bioelectron., 2008, 23, 1812–1818 CrossRef CAS PubMed .
  28. F. Deiss, C. N. LaFratta, M. Symer, T. M. Blicharz, N. Sojic and D. R. Walt, J. Am. Chem. Soc., 2009, 131, 6088–6089 CrossRef CAS PubMed .
  29. X. Y. Z. Karsunke, R. Niessner and M. Seidel, Anal. Bioanal. Chem., 2009, 395, 1623–1630 CrossRef CAS PubMed .
  30. A. Roda, M. Mirasoli, L. S. Dolci, A. Buragina, F. Bonvicini, P. Simoni and M. Guardigli, Anal. Chem., 2011, 83, 3178–3185 CrossRef CAS PubMed .
  31. D. L. Arruda, W. C. Wilson, C. Nguyen, Q. W. Yao, R. J. Caiazzo, I. Talpasanu, D. E. Dow and B. C. S. Liu, Expert Rev. Mol. Diagn., 2009, 9, 749–755 CrossRef CAS PubMed .
  32. R. Duer, R. Lund, R. Tanaka, D. A. Christensen and J. N. Herron, Anal. Chem., 2010, 82, 8856–8865 CrossRef CAS PubMed .
  33. D. R. Walt, Chem. Soc. Rev., 2010, 39, 38–50 RSC .
  34. F. S. Ligler, Anal. Chem., 2009, 81, 519–526 CrossRef CAS PubMed .
  35. O. Hofmann, P. Miller, P. Sullivan, T. S. Jones, J. C. deMello, D. D. C. Bradley and A. J. deMello, Sens. Actuators, B, 2005, 106, 878–884 CrossRef CAS PubMed .
  36. T. Kamei, B. M. Paegel, J. R. Scherer, A. M. Skelley, R. A. Street and R. A. Mathies, Anal. Chem., 2003, 75, 5300–5305 CrossRef CAS .
  37. D. Caputo, G. de Cesare, A. Nascetti and M. Tucci, IEEE Trans. Electron Devices, 2008, 55, 452–456 CrossRef CAS .
  38. R. A. Street, Hydrogenated amorphous silicon, Cambridge University press, Cambridge, 2001 Search PubMed .
  39. D. Caputo, G. de Cesare, A. Nascetti and R. Negri, J. Non-Cryst. Solids, 2006, 352, 2004–2006 CrossRef CAS PubMed .
  40. F. Fixe, V. Chu, D. M. F. Prazeres and J. P. Conde, Nucleic Acids Res., 2004, 32, e70 CrossRef CAS PubMed .
  41. D. Caputo, G. de Cesare, C. Manetti, A. Nascetti and R. Scipinotti, Lab Chip, 2007, 7, 978–980 RSC .
  42. P. De Rossi, M. Reverberi, A. Ricelli, A. A. Fabbri, D. Caputo, G. De Cesare, R. Scipinotti and C. Fanelli, Ann. Microbiol., 2011, 61, 11–15 CrossRef PubMed .
  43. D. Caputo, G. de Cesare, L. Stella Dolci, M. Mirasoli, A. Nascetti, R. Scipinotti and A. Roda, IEEE Sens. J., 2012, 13, 20595–20602 Search PubMed .
  44. R. Martins, P. Baptista, L. Raniero, G. Doria, L. Silva, R. Franco and E. Fortunato, Appl. Phys. Lett., 2007, 90, 023903 CrossRef .
  45. A. C. Pimentel, A. T. Pereira, V. Chu, D. M. F. Prazeres and J. P. Conde, IEEE Sens. J., 2007, 7, 415–416 CrossRef CAS .
  46. G. de Cesare, D. Caputo, A. Nascetti, C. Guiducci and B. Ricco, Appl. Phys. Lett., 2006, 88, 083904 CrossRef .
  47. F. Costantini, R. M. Tiggelaar, S. Sennato, F. Mura, S. Schlautmann, F. Bordi, H. Gardeniers and C. Manrtti, Analyst, 2013 Search PubMed .
  48. S. M. Lane, Z. F. Kuang, J. Yom, S. Arifuzzaman, J. Genzer, B. Farmer, R. Naik and R. A. Vaia, Biomacromolecules, 2011, 12, 1822–1830 CrossRef CAS PubMed .
  49. O. Azzaroni, J. Polym. Sci., Part A: Polym. Chem., 2012, 50, 3225–3258 CrossRef CAS .
  50. M. Husseman, E. E. Malmstrom, M. McNamara, M. Mate, D. Mecerreyes, D. G. Benoit, J. L. Hedrick, P. Mansky, E. Huang, T. P. Russell and C. J. Hawker, Macromolecules, 1999, 32, 1424–1431 CrossRef CAS .
  51. H. Wieczorek, Solid State Phenomena, 1995, 44–46, 957–972 CrossRef CAS PubMed .
  52. G. de Cesare, D. Caputo and M. Tucci, IEEE Electron Device Lett., 2012, 33, 327–329 CrossRef CAS .
  53. F. R. R. Teles and L. R. Fonseca, Mater. Sci. Eng., C, 2008, 28, 1530–1543 CrossRef CAS PubMed .
  54. S. J. Peng and B. Bhushan, RSC Adv., 2012, 2, 8557–8578 RSC .
  55. J. Trmcic-Cvitas, E. Hasan, M. Ramstedt, X. Li, M. A. Cooper, C. Abell, W. T. S. Huck and J. E. Gautrot, Biomacromolecules, 2009, 10, 2885–2894 CrossRef CAS PubMed .
  56. F. Costantini, E. M. Benetti, R. M. Tiggelaar, H. Gardeniers, D. N. Reinhoudt, J. Huskens, G. J. Vancso and W. Verboom, Chem.–Eur. J., 2010, 16, 12406–12411 CrossRef CAS PubMed .
  57. F. Costantini, W. P. Bula, R. Salvio, J. Huskens, H. Gardeniers, D. N. Reinhoudt and W. Verboom, J. Am. Chem. Soc., 2009, 131, 1650–1651 CrossRef CAS PubMed .
  58. F. Costantini, E. M. Benetti, D. N. Reinhoudt, J. Huskens, G. J. Vancso and W. Verboom, Lab Chip, 2010, 10, 3407–3412 RSC .
  59. F. Domenici, A. R. Bizzarri and S. Cannistraro, Int. J. Nanomed., 2011, 6, 2033–2042 CAS .
  60. F. Domenici, A. R. Bizzarri and S. Cannistraro, Anal. Biochem., 2012, 421, 9–15 CrossRef CAS PubMed .
  61. C. P. Jia, X. Q. Zhong, B. Hua, M. Y. Liu, F. X. Jing, X. H. Lou, S. H. Yao, J. Q. Xiang, Q. H. Jin and J. L. Zhao, Biosens. Bioelectron., 2009, 24, 2836–2841 CrossRef CAS PubMed .
  62. C. Situma, M. Hashimoto and S. A. Soper, Biomol. Eng., 2006, 23, 213–231 CrossRef CAS PubMed .

Footnote

Electronic supplementary information (ESI) available: Details of equipment, AFM and FESEM imaging and FTIR analysis. See DOI: 10.1039/c3ra46058d

This journal is © The Royal Society of Chemistry 2014
Click here to see how this site uses Cookies. View our privacy policy here.