Graphene sheets anchored with high density TiO2 nanocrystals and their application in quantum dot-sensitized solar cells

Jinjin He a, Dapeng Wu *ab, Zhiyong Gao a, Fang Xu a, Shiwei Jiang a, Shuo Zhang a, Kun Cao a, Yuming Guo a and Kai Jiang *ab
aSchool of Chemistry and Chemical Engineering, Henan Normal University, Xinxiang, P. R. China
bEngineering Technology Research Center of Motive Power and Key Materials of Henan Province, Henan Key Laboratory of Photovoltaic Materials, Henan Normal University, Xinxiang, Henan 453007, P. R. China. E-mail: jiangkai6898@126.com; Fax: +86 3733326209

Received 8th October 2013 , Accepted 20th November 2013

First published on 21st November 2013


Abstract

High density TiO2 nanocrystals were successfully decorated on graphene sheets via a CTAB assisted solvothermal method. Due to the structural advantages, an improved power conversion efficiency of 4.02% was achieved in a quantum dot-sensitized solar cell, demonstrating ∼40% enhancement compared with the nanoparticle based cell.

As an alternative to dye-sensitized solar cells (DSSCs), semiconductor quantum dots sensitized solar cells (QDSSCs) have been intensively investigated for their high light-harvesting capability compared to the organic sensitizers.1–3 Semiconductor QDs exhibit attractive characteristics such as the tunable band gap for flexible absorption spectrum, higher extinction coefficients and greater intrinsic dipole moments for the rapid charge separation.4–8 Moreover, the demonstration of multiple exciton generation (MEG) in colloidal semiconductor QDs could trigger the thermodynamic photovoltaic conversion efficiency soar up to ∼44% from the current ∼31% of the Shockley–Queisser limit.9,10 Therefore, QDSSCs have been considered as the most attractive configurations to exploit these fascinating properties in solar energy conversion device.

Graphene is an expeditiously rising material in the material science community.11,12 Two-dimensional graphene with thickness of a single or several carbon atoms possesses unique physicochemical properties including high carrier mobility, good mechanical flexibility, optical transparency, large surface area, high chemical stability.13–16 Especially, the large surface area and tunable surface properties allow it to be a promising host matrix for the heterogeneous growth of desired active guest materials. Heretofore, different semiconductors with tunable size and morphologies were anchored on graphene sheet through a large variety of strategies for the applications such as photocatalysis, lithium-ion batteries, super-capacitors, DSSCs and QDSSCs.17–22

TiO2 structures have been widely applied as the photoanode materials for QDSSC, because of its high physical and chemical stabilities and compatible energy band configuration. In a working QDSSC, TiO2 not only serve as the reservoir for the injected electrons from excited QDs and provides the transport pathway for the photoelectrons from the injection sites to the transparent conductive substrate. Therefore, TiO2 photoanode with ordered structure or combined with high electron collection media than those conventionally made from random oriented nanoparticles are favorable for achieving high power conversion efficiency (PCE) of QDSCs via spurring the electron-transfer rate.23–25

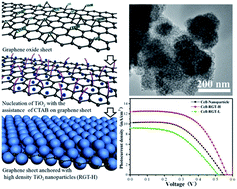
Herein, we designed and prepared a unique graphene/TiO2 heterostructure for high performance QDSSC photoanode via a CTAB assisted solvothermal method using N,N-dimethylformamide (DMF) and isopropanol as reaction medium (Experimental details, ESI). With CTAB assistance, the reduced graphene oxide could be wrapped with high density TiO2 nanocrystals (denoted as RGT-H) and the anchored TiO2 nanocrystals could be controlled at ∼15 nm, which leads to a high surface area of 83 cm2 g−1. Moreover, the inner graphene sheet could serves as a rapid electron transport path way for high carrier separation and the electron collection at the conductive substrate. In addition, the closely packed TiO2 nanocrystals could prevent the directly contact between the exposed graphene surface (rich in negatively charged electrons) and the electrolyte (rich in positively charged holes), which could substantially reduce the recombination rate of the photogenerated carriers. Therefore, when used in QDSSC, the Cell-RGT-H demonstrated a PCE of 4.02%, which experiences ∼40% improvement compared with the nanocrystal cell (2.85%).

Results and discussion

Scheme 1 depicts the formation process of the heterostructure with the assistance of CTAB. At the initial stage, the positive charged ammonium ion of CTA+ would combine with the negatively charged carboxyl group of GO through electrostatic interaction.26,27 The hydrophobic tails of CTAB will then aligned on the GO sheet, which could cross link with the organic ligands bonded with the titanium atoms (TBT). Therefore, the Ti precursor could be enriched along the RGO surface, which facilitates the nucleation and the later growth of the TiO2 nanocrystals. Moreover, during the solvothermal reaction, the reducing ambient would remove the most of the oxygen groups on GO and the conductivity of graphene is recovered.28
image file: c3ra45665j-s1.tif
Scheme 1 Illustration of anchoring high density TiO2 nanocrystals on reduced graphene oxide (RGO) sheets with assistance of CTAB.

Fig. 1a shows the SEM image of the as-prepared heterostructure. Sheet-like patterns were formed in the sample with size ranging from several hundred of nanometers to micrometers and thickness of 100–200 nm. The corresponding TEM image (Fig. 1b) shows the nanocrystals were closely packed on the graphene sheet leaving no naked surface exposing. Moreover, no individual nanocrystals were found littering aside the sheet-like patterns. The magnified image of the white square area is depicted in Fig. 1c, which indicates the anchored nanoparticles are ∼15 nm in diameter and packed with high density. The HRTEM image in Fig. 1d depicts the well-defined crystal lattice fringes of an individual nanoparticle marked within the white dot square in Fig. 1c. The planar spacing could be measured as 0.35 nm, corresponding to the (101) lattice plane of anatase phase TiO2. Fig. S1a (ESI) shows that without the CTAB assistance, the RGO was wrapped with low density TiO2 nanocrystals (denoted as RGT-L) and the particle sizes are of ∼30 nm, which are apparent larger than that of RGT-H. Moreover, a remarkable portion of the graphene surface remains uncovered (marked with white circles). The corresponding HRTEM image (Fig. S1b, ESI) discloses the planar spacing is 0.35 nm, suggesting the as-generated particle are anatase in nature.


image file: c3ra45665j-f1.tif
Fig. 1 (a) SEM, (b and c) TEM and (d) HRTEM images of the RGT-H heterostructure prepared with the assistant of CTAB.

Fig. 2a shows the XRD patterns of the as-prepared samples. For GO, a strong peak centered at 9.73° corresponds to the (002) inter-planar spacing of GO. However, in the RGT composites, the peak at the same position disappears, suggesting the graphene oxide has been reduced to graphene accompanied with the removal of oxygen groups. For RGT-H, all of the diffraction peaks can be perfectly assigned to pure anatase TiO2 (JCPDS Card no. 01-0562). No other diffraction peaks were detected. The broadened diffraction peaks implies the small particle size of TiO2. The average crystal size of the as-prepared products was estimated as ∼11 nm from the broadening of anatase (101) diffraction peak by Scherrer equation.29 The RGT-L peaks are much narrower compared with RGT-H, indicating the size growth of the primary nanocrystals. Moreover, the average size could be calculated as ∼32 nm based on the Scherrer equation, which matches well with the TEM results. Fig. 2b depicts the N2 adsorption and desorption isotherm of the synthesized RGT-H together with the Barrett–Joyner–Halenda (BJH) analysis of desorption isotherms. The N2 adsorption and desorption isotherm is of type IV with H3 hysteresis loops. The inset BJH analysis of desorption isotherms showed a bimodal pore size distribution. The smaller pores are of diameters about several nanometers, which related to aggregated primary particles anchored on the graphene sheet. While, the larger pore ranging from several tens of nanometers to 100 nm are associated with the aggregations of the secondary sheet-like RGT-H patterns. Considering the secondary sheet-like pattern of the RGT has a wild size distribution, the large pores possesses a broad distribution, confirming the hierarchical porous structure of the as-synthesized RGT-H structures, which may facilitate electrolyte diffusion and enhance light harvesting efficiency when used as the photoanode material in QDSSCs. In addition, the obtained RGT-H has a high BET surface area of 83 m2 g−1, which is favorable for the QDs loading on the photoanode film.30


image file: c3ra45665j-f2.tif
Fig. 2 (a) XRD patterns of the as-prepared samples and (b) the N2 adsorption and desorption isotherm and the Barrett–Joyner–Halenda (BJH) pore size analysis (inset) of RGT-H.

The as-prepared RGT-H heterostructure was applied as the photoanode for the QDSSC employing CdS and CdSe QDs as co-sensitizers. The energy level schematic diagram of the QDSSC including FTO, graphene, CdS/CdSe QDs and ZnS coating layer is shown in Fig. 3a. Considering the work function of a typical graphene is −4.4 to 4.5 eV, this energetic arrangement favors the multiple-step electron transfer from excited CdSe and CdS to TiO2 and graphene.31,32 The multiple-step injecting configuration could not only improve the injection rate of the electron but also prevent the backward diffusion of the photo-generated electrons, which leads to a more effective electron collection at the FTO substrate.33Fig. 3b shows the current–voltage (IV) characteristics of the three cells derived from nanoparticles, RGT-H and RGT-L under a simulated AM 1.5 G solar irradiation with light intensity of 100 mW cm−2. The photovoltaic parameters of the QDSSCs are listed in Table 1. It is seen that Cell-nanoparticle shows a short-circuit current density (Jsc) of 10.23 mA cm−2, open circuit voltage (Voc) of 542 mV, and filling factor (FF) of 50%, which results in a power conversion efficiency (PCE) of 2.85%. When graphene sheet was introduced with the assistance of CTAB, Cell-RGT-H demonstrated the maximum PCE of 4.02% and the enhancement are attributed to the collaborative augment of Jsc, Voc and FF. The graphene sheet can serve as a good conducting matrix leading to a better connection between the individual nanocrystals in the porous film, which reduce the series resistance of the photoanode and increase the FF from 50% to 57%.34 However, it is worth mention that the performance of Cell-RGT-L dramatically decreased, the Jsc and Voc respectively reduced to 9.21 mA cm−2 and 515 mV, while the FF decreased to 0.47, which leads to the lowest PCE of 2.24%.


image file: c3ra45665j-f3.tif
Fig. 3 (a) the energy level schematic diagram of the QDSSC including FTO, graphene, CdS/CdSe QDs and ZnS coating layer, (b) the IV curves of the QDSSCs, (c) the absorption spectra of the different photoanode films loaded with QDs and (d) the incident monochromatic photo-to-current conversion efficiency (IPCE) of the cells.
Table 1 Photovoltaic parameters for the QDSSCs based on different photoanodes
Cells V oc (mV) J sc (mA cm−2) FF (%) PCE (%)
Nanoparticles 542 10.23 50 2.85
RGT-H 569 12.38 57 4.02
RGT-L 515 9.21 47 2.24


The absorption spectra of the different photoanode films were displayed in Fig. 3c. Photoanode-RGT-H exhibits the higher absorbance compared with photoanode-nanoparticle, indicating more incident light could be harvested as coming through the device. Considering the photoanode films are controlled at same thickness, the higher absorbance are attributed to the unique film structure of RGT-H which could improve the QDs loading amounts due to its high surface area and suitable pore size distribution. However, for RGT-L, the large TiO2 size leads to the fewer nucleation sites in the QDs loading and finally results in the lowest light absorbance.30 Moreover, the improved Jsc of Cell-RGT-H could be also reflected in the increased incident monochromatic photo-to-current conversion efficiency (IPCE) performance (Fig. 3d). Compared to Cell-nanoparticle, the IPCE response of Cell-RGT-H at all wavelengths is enhanced, and the maximum IPCE reaches to ∼60% at the wavelength of 470 nm. However, Cell-RGT-L shows the lowest IPCE performance, which is in accord with the Jsc performance of the cells. As indicated in the equation below:

ηIPCE = ηlhηinjηcol
the IPCE result is determined by the light harvesting efficiency of the photoanode (ηlh), the injection (ηinj) and the collection efficiencies (ηcol) of the photoelectrons. The unique film structure of RGT-H leads to higher QD loading amount and the light harvesting efficiency, while the multiple-step injecting configuration helps to elevate the injection rate. Moreover, the flexible graphene sheet with high electron conductivity serve as a fast transport path to benefit the collection efficiency of the cell, which finally results in the higher IPCE value and Jsc compared with the other cells.24,31–33

To get further insights on the enhanced photovoltaic parameters of Cell-RGT-H, electrochemical impedance spectra of the cells were introduced to understand the electron recombination dynamics of the cells, which were measured at a bias voltage of −0.55 V in dark. In the QDSSC system, the recombination between the injected electrons and the oxidized species primarily take place at the TiO2/QDs and the TiO2/electrolyte interfaces. Moreover, the defect states formed at the junction of the adjacent QDs may also serve as the recombination centers to spur the electron leaking. The recombination resistance of these processes could be evaluated by the radius size of the medium frequency circle in the Nyquist plots.35 As displayed in Fig. 4a, the greater radius of the medium frequency circle suggests Cell-RGT-H has the higher carrier recombination resistance compared with the other cells, indicating more photogenerated electrons could be collected at the conductive substrate and transported to the external circuit. Moreover, as shown in the corresponding Bode plots (Fig. 4b), the medium frequency peaks of the Cell-nanoparticle (8.26 Hz) and Cell-RGT-H (5.63 Hz) shift to lower frequency region. Based on the equation of τn = 1/2πfmax, where τn is the electron recombination lifetime and fmax is the frequency peak at the intermediate region,36–38 the corresponding τn of Cell-nanoparticle and Cell-RGT-H could be calculated as 19.3 and 28.3 ms, which indicates that incorporated graphene could reduce the undesired electron recombination of the cell. Moreover, the shift of Cell-RGT-L frequency peak (21.60 Hz) suggests that the electron recombination resistance of the cell decreases and the corresponding τn is reduced to 7.3 ms, which may result from the directed contact between the graphene sheet (rich in negatively charged electrons) and the electrolyte (rich in positively charged holes) through the naked part. The Voc of the QDSSC device could be expressed as:25,39,40

image file: c3ra45665j-t1.tif
where R is the molar gas constant, T the temperature, β the reaction order of Sn and electrons, F the Faraday constant, A the electrode surface area, I the incident photon flux, n0 the accessible electronic state concentration in the conduction band, kb the backward reaction kinetic constant of the injected electrons with polysulfide electrolyte and kr the recombination kinetic constant of the electrons with oxidized QDs (D+). Therefore, the Voc is greatly affected by the population of the free electron in the conduction band of TiO2. Although the photon flux remains at a constant, the increased light absorption of RGT-H would produce more injected electrons to the TiO2 photoanode, which enhances the Voc effectively. Moreover, the greater recombination lifetime of Cell-RGT-H indicated that the back reaction constants kb and kr are also reduced, which could also contribute to the improved Voc. However, for Cell-RGT-L, the lower surface area together with the continuous leaking of the collected photoelectrons to the positively charged electrolyte through the uncovered graphene sheet inevitably triggers the fast electron concentration drop, which decreases the Voc and the other performances like Jsc, FF and the PCE of the cell.


image file: c3ra45665j-f4.tif
Fig. 4 (a) Nyquist and (b) Bode plots of the electrochemical impedance spectra of the cells.

Conclusions

A solvothermal approach was developed to synthesize unique graphene/TiO2 heterostructure for QDSSC application. The cell deriving from sample RGT-H, prepared with the assistance of CTAB, exhibits a high PCE of 4.02%, indicating a ∼40% enhancement compared with the nanoparticle cell. The improved QDSSC performance could be ascribed to the unique structural advantages of the RGT-H composites: (a) the flexible graphene sheet could serves as the high rate electron diffusion media to improve the collection efficiency of the photoelectrons; (b) the stepwise build-in energy gradient could increase the injection rate and prohibit the backward diffusion of the injected electrons; (c) the closely decorated TiO2 nanocrystals could not only provide a high surface area for QDs loading but also prevent the directed contact between the graphene sheet and the electrolyte, which further improves the recombination resistance of the charge carriers; (d) the secondary sheet-like RGT-H composites may also enhance the light harvesting efficiency by taking advantage of the light scattering effect compared with the nanoparticles cells.

Acknowledgements

This work is supported by National Natural Science Foundation of China (61204078, 61176004 and U1304505), Program for Innovative Research Team (in Science and Technology) in University of Henan Province (no. 13IRTSTHN026), Key Project of Science and Technology of Henan Province (no. 122102210561).

Notes and references

  1. P. V. Kamat, J. Phys. Chem. C, 2008, 112, 18737–18753 CAS .
  2. I. Robel, V. Subramanian, M. Kuno and P. V. Kamat, J. Am. Chem. Soc., 2006, 128, 2385–2393 CrossRef CAS PubMed .
  3. F. Hetsch, X. Q. Xu, H. K. Wang, S. V. Kershaw and A. L. Rogach, J. Phys. Chem. Lett., 2011, 2, 1879–1887 CrossRef CAS .
  4. V. G. Pedro, X. Xu, I. Mora-Sero and J. Bisquert, ACS Nano, 2010, 4, 5783–5790 CrossRef PubMed .
  5. G. Zhu, L. Pan, T. Xu and Z. Sun, ACS Appl. Mater. Interfaces, 2011, 3, 3146–3151 CAS .
  6. M. A. Hossain, J. R. Jennings, Z. Y. Koh and Q. Wang, ACS Nano, 2011, 5, 3172–3181 CrossRef CAS PubMed .
  7. Z. X. Pan, H. Zhang, K. Cheng, Y. M. Hou, J. L. Hua and X. H. Zhong, ACS Nano, 2012, 6, 3982–3991 CrossRef CAS PubMed .
  8. Z. H. Chen, W. Q. Peng, K. Zhang, J. Zhang, M. Yanagida and L. Y. Han, Nanoscale, 2012, 4, 7690–7697 RSC .
  9. M. C. Hanna and A. J. Nozik, J. Appl. Phys., 2006, 100, 074510 CrossRef .
  10. W. Shockley and H. J. Queisser, J. Appl. Phys., 1961, 32, 510 CrossRef CAS .
  11. A. K. Geim and K. S. Novoselov, Nature, 2007, 6, 183–191 CrossRef CAS PubMed .
  12. S. Stankovich, D. A. Dikin, G. H. B. Dommett, K. M. Kohlhaas, E. J. Zimney and E. A. Stach, Nature, 2006, 442, 282–286 CrossRef CAS PubMed .
  13. Y. M. Lin, C. Dimitrakopoulos, K. A. Jenkins, D. B. Farmer, H. Y. Chiu, A. Grill and P. Avouris, Science, 2010, 327, 662 CrossRef CAS PubMed .
  14. F. Schwierz, Nat. Nanotechnol., 2010, 5, 487–496 CrossRef CAS PubMed .
  15. M. Freitag, M. Steiner, Y. Martin, V. Perebeinos, Z. Chen, J. C. Tsang and P. Avouris, Nano Lett., 2009, 9(5), 1883–1888 CrossRef CAS PubMed .
  16. M. Freitag, H. Y. Chiu, M. Steiner, V. Perebeinos and P. Avouris, Nat. Nanotechnol., 2010, 5, 497–501 CrossRef CAS PubMed .
  17. Y. J. Su, X. N. Lu, M. M. Xie, H. J. Geng, H. Wei, Z. Yang and Y. F. Zhang, Nanoscale, 2013, 5, 8889–8893 RSC .
  18. B. T. Liu, Y. J. Huang, Y. Wen, L. J. Du, W. Zeng, Y. R. Shi, F. Zhang, G. Zhu, X. H. Xua and Y. H. Wang, J. Mater. Chem., 2012, 22, 7484–7491 RSC .
  19. J. Lu, M. Y. Wang, Y. Li and C. H. Deng, Nanoscale, 2012, 4, 1577–1580 RSC .
  20. Z. Y. Wang, B. B. Huang, Y. Dai, Y. Y. Liu, X. Y. Zhang, X. Y. Qin, J. P. Wang, Z. K. Zheng and H. F. Cheng, CrystEngComm, 2012, 14, 1687–1692 RSC .
  21. G. Cheng, M. S. Akhtar, O. Yang and F. J. Stadler, ACS Appl. Mater. Interfaces, 2013, 5, 6635–6642 CAS .
  22. Y. C. Qiu, K. Y. Yan, S. H. Yang, L. M. Jin, H. Deng and W. S. Li, ACS Nano, 2010, 4, 6515–6526 CrossRef CAS PubMed .
  23. D. Wu, F. Zhu, L. Li, H. Dong, Q. Li, K. Jiang and D. Xu, J. Mater. Chem., 2012, 22, 11665–11671 RSC .
  24. J. Ahn, J. Kim, K. Moon, S. Park and S. Kim, Nanoscale, 2013, 5, 6842–6850 RSC .
  25. F. Zhu, H. Dong, Y. Wang, D. Wu, J. Li, J. Pan, Q. Li, X. Ai, J. Zhang and D. Xu, Phys. Chem. Chem. Phys., 2013, 15, 17798–17803 RSC .
  26. Y. F. Fan, Y. S. Liu, Q. Cai, Y. Z. Liu and J. M. Zhang, Synth. Met., 2012, 162, 1815–1821 CrossRef CAS PubMed .
  27. M. Zhao, D. P. Wu, J. L. Chang, Z. Y. Bai and K. Jiang, Mater. Chem. Phys., 2009, 117, 422–424 CrossRef CAS PubMed .
  28. Y. Y. Liang, H. L. Wang, H. Casalongue, Z. Chen and H. J. Dai, Nano Res., 2010, 10(3), 701–705 CrossRef PubMed .
  29. D. P. Wu, Z. Y. Gao, F. Xu, J. L. Chang, W. G. Tao, J. J. He, S. Y. Gao and K. Jiang, CrystEngComm, 2013, 15, 1210–1217 RSC .
  30. J. J. Tian, Q. F. Zhang, L. L. Zhang, R. Gao, L. F. Shen, S. Zhang, X. H. Qua and G. Z. Cao, Nanoscale, 2013, 5, 936–943 RSC .
  31. J. Chen, F. Xu, J. Wu, K. Qasim, Y. D. Zhou, W. Lei, L. T. Sun and Y. Zhang, Nanoscale, 2012, 4, 441–443 RSC .
  32. J. Chen, C. Li, G. Eda, Y. Zhang, W. Lei, M. Chhowalla, W. Milnecf and W. Q. Deng, Chem. Commun., 2011, 47, 6084–6086 RSC .
  33. N. Yang, J. Zhai, D. Wang, Y. S. Chen and L. Jiang, ACS Nano, 2010, 4, 887–894 CrossRef CAS PubMed .
  34. D. P. Wu, Y. Wang, H. Dong, F. Zhu, S. Y. Gao, K. Jiang, L. M. Fu, J. P. Zhang and D. S. Xu, Nanoscale, 2013, 5, 324–330 RSC .
  35. I. Mora-Seró, S. Giménez, F. Fabregat-Santiago, R. Gómez, Q. Shen, T. Toyoda and J. Bisquert, Acc. Chem. Res., 2009, 11, 1848–1857 CrossRef PubMed .
  36. R. Kern, R. Sastrawan, J. Ferber, R. Stangl and J. Luther, Electrochim. Acta, 2002, 47, 4213–4225 CrossRef CAS .
  37. J. Chen, W. Lei and W. Q. Deng, Nanoscale, 2011, 3, 674–677 RSC .
  38. D. P. Wu, Z. Y. Gao, F. Xu, Z. P. Shi, W. G. Tao and K. Jiang, CrystEngComm, 2012, 14, 7934–7941 RSC .
  39. K. Lee, S. W. Park, M. J. Ko, K. Kim and N. G. Park, Nat. Mater., 2009, 8, 665–671 CrossRef CAS PubMed .
  40. J. Tian, Q. Zhang, E. Uchaker, Z. Liang, R. Gao, X. Qu, S. Zhang and G. Cao, J. Mater. Chem. A, 2013, 1, 6770–6775 CAS .

Footnote

Electronic supplementary information (ESI) available: Experimental details, SEM and TEM figures of the sample (RGT-L) prepared without using CATB. See DOI: 10.1039/c3ra45665j

This journal is © The Royal Society of Chemistry 2014
Click here to see how this site uses Cookies. View our privacy policy here.