One-step hydrothermal fabrication and enhancement of the photocatalytic performance of CdMoO4/CdS hybrid materials
Yundan Liuab,
Long Renab,
Xiang Qi*ab,
Yao Wangab,
Xuejun Liuab and
Jianxin Zhong*ab
aHunan Key Laboratory of Micro-Nano Energy Materials and Devices, Xiangtan University, Hunan 411105, P. R. China. E-mail: xqi@xtu.edu.cn; jxzhong@xtu.edu.cn
bLaboratory for Quantum Engineering and Micro-Nano Energy Technology and Faculty of Materials and Optoelectronic Physics, Xiangtan University, Hunan 411105, P. R. China
First published on 9th December 2013
Abstract
A series of CdMoO4/CdS hybrid composites were synthesized via a one-step hydrothermal method. The products were characterized by X-ray diffraction, scanning electron microscopy, X-ray photoelectron spectroscopy, Raman and UV-vis diffuse reflection spectroscopy. The photocatalytic activities of the CdMoO4/CdS hybrid materials compared with CdMoO4 microspheres and dendritic CdS nanostructures were evaluated by rhodamine B (RhB) decomposition under sunlight irradiation. The results revealed that the as-prepared CdMoO4/CdS hybrid composites showed superior photocatalytic activities for the degradation of RhB under sunlight irradiation, especially compared with dendritic CdS decorated with 22% CdMoO4 microspheres. The superior photodegradation performance of the as-prepared CdMoO4/CdS hybrid composites can be ascribed to the presence of CdMoO4 as an electron acceptor which improves the effective charge separation in CdS.
1. Introduction
As a promising green technology for environmental purification, photocatalytic degradation of organic compounds in wastewater by semiconductor photocatalysts has attracted increasing attention.1 Titanium dioxide (TiO2), a typical wide band-gap semiconductor photocatalyst, has been widely investigated in environmental pollutant degradation under ultraviolet (UV) illumination.2–6 However, the proportion of UV light in the solar spectrum is only 5%, which greatly limits the practical applications of wide band-gap semiconductor photocatalysts.4,7 Cadmium sulphide (CdS) is a typical candidate for visible light photocatalysts because its band gap is 2.4 eV which corresponds to the visible light region and the photogenerated charge carriers can move to the surface of the catalyst. Nevertheless, the low separation efficiency of photogenerated electrons is still an obstacle for the development of CdS in environmental remediation and solar conversion.2,7 To improve the photocatalytic efficiency, recent attempts focus on combining CdS photocatalysts with other semiconductor materials such as ZnO8 and TiO2.2,9,10 Xu and co-workers synthesized one-dimensional CdS@TiO2 core–shell nanocomposites, which exhibited an excellent photocatalytic performance under visible light irradiation, since the photogenerated electrons from the conduction band (CB) of CdS nanowires can transfer to the TiO2 shell to improve the separation efficiency of electron–hole pairs.2 Therefore, coupling with suitable materials with a relatively low conduction band potential to facilitate the transference of photogenerated electrons is regarded as an efficient way to improve the photocatalytic efficiency.Cadmium molybdate (CdMoO4) is an interesting semiconductor with a scheelite type structure due to its excellent optical and chemical properties, as well as its exotic electronic structure.11–16 The studies of CdMoO4 usually focus on electronic excitation with vacuum ultraviolet synchrotron radiation, pressure-induced phase transformation, and spin-lattice relaxation.15,17–20 Recently, the photocatalytic performances of CdMoO4 have also been well studied for its superior UV photocatalysis performance.13,18 CdMoO4 is a wide band-gap semiconductor and its band gap is 3.25 eV, which indicates that CdMoO4 can only use UV irradiation for photocatalysis.21 Interestingly, Zhou et al. have reported that the photocatalytic activity of the as-prepared CdMoO4 hollow microspheres was higher than commercially available TiO2 by evaluating results of measuring the photodegradation performance of rhodamine B (RhB) under UV light illumination,18 which has proved that CdMoO4 is an excellent photocatalyst under UV light, however little research has extended the photocatalytic performance of CdMoO4 to the visible light region.
In this paper, we firstly synthesize CdMoO4/CdS composites via a simple one-step hydrothermal reaction. The photocatalytic properties of the as-prepared CdMoO4/CdS composites were evaluated by the degradation of RhB in aqueous solution under simulated solar irradiation. Compared with as-pristine CdMoO4 microspheres and dendritic CdS, the results showed that CdMoO4/CdS exhibits an enhanced photocatalytic performance, which may benefit from the transfer of photogenerated electrons and the lower electron–hole recombination in the CdMoO4/CdS composites.
2. Experimental
2.1 Photocatalyst preparation
In a typical synthetic process, 0.55 mmol cadmium chloride (CdCl2·10.5H2O) was dissolved in 15 mL deionized water to form a homogeneous aqueous solution. 0.6 mmol Thiourea (CH4N2S) and sodium molybdate (Na2MoO4·2H2O) were dissolved in 15 mL deionized water under constant stirring to obtain a solution. Samples of different amounts of MoO42− (0.01, 0.03 and 0.05 mmol, respectively) were prepared by the same procedure except for changing the ratio of CdS and CdMoO4, which were designated CdMoO4/CdS(i), CdMoO4/CdS(ii) and CdMoO4/CdS(iii), respectively. Then the former two solutions were mixed together with vigorous stirring. After being stirred for 0.5 h, the suspension was transferred into a 50 mL Teflon-lined stainless steel autoclave. The autoclave was heated at 160 °C for 12 h and then cooled to room temperature naturally. The products were separated by centrifugation and washed with deionized water and absolute ethanol several times before drying in vacuum at 60 °C for 12 h.2.2 Photocatalyst characterization
The crystal structures of the samples were analyzed by X-ray diffraction (XRD, Rigaku D/Max 2500) using Cu Kα radiation in the 2θ range of 10–80°. The morphologies of the samples were characterized using scanning electron microscopy (SEM, JEOL JSM-6360). X-ray photoelectron spectroscopy (XPS) measurements were performed by Axis Ultra instrument using an Al Kα source (Kratos Analytical Ltd., UK). A binding energy of 284.8 eV for the C 1s level was used as an internal reference. UV-vis diffused reflectance spectra were obtained for the dry-pressed disk samples using an ultraviolet-visible spectrometer (UV-vis, Shimadzu UV-2550). BaSO4 was used as a reflectance standard in UV-vis diffuse reflectance experiments. Raman spectra were measured with an InVia Raman microscope (Raman, Renishaw) at an excitation laser wavelength of 532 nm. The photoluminescence spectra were acquired at room temperature using a fluorescence spectrometer (PL, Hitachi F-4500). Brunauer–Emmett–Teller (BET) nitrogen-adsorption–desorption measurements were performed using TriStarII 3020 (BET, Micromeritics Instrument Corporation).2.3 Photocatalytic experiments
The photodegradation of RhB dyes was observed based on the absorption spectroscopic technique. The photocatalyst powders (20 mg) were suspended in 40 mL of RhB (1.0 × 10⁻⁵ M) aqueous solution. In order to ensure the establishment of an adsorption–desorption equilibrium, the suspensions were stirred in a dark environment for 1 h before irradiation. The excitation light source was a 150 W high-pressure xenon lamp (Beijing Trusttech Co. Ltd., China), which provided a full-spectrum emission with an AM 1.5 filter to simulate the sunlight source. The illumination intensity was 100 mW cm−2. In the given intervals of irradiation time, 4 mL aliquots were sampled and centrifuged to remove remnant photocatalyst. Subsequently, the solution was analyzed by UV-vis spectroscopy using the Lambda 25 spectrophotometer. The percentage of degradation is reported as C/C0, where C0 is the initial concentration of the reactant, C is the concentration of the reactant at irradiation time.3. Results and discussion
3.1 Structure and morphology characterization
The phase purity and crystallinity of the as-prepared CdMoO4/CdS hybrid, pure CdMoO4 and CdS samples were characterized using X-ray diffraction (XRD). The samples were prepared using the hydrothermal procedure with different Mo/S ratios in the reagent. As shown in Fig. 1, compared with the XRD patterns of the pure CdMoO4 and CdS, the diffraction peaks of the composite samples indicate that the hybrids consist of tetragonal phase CdMoO4 (JCPDS 88-0182) and hexagonal phase CdS (JCPDS 77-2306). The peak at ∼29.2° is the main peak of CdMoO4, corresponding to a (112) reflection. The peak intensities display a visible increase, which demonstrates that the mass percentages of CdMoO4 increase with increasing amounts of MoO42− in the initial materials. In order to further prove it, complete quantitative analyses were refined by fitting the full XRD pattern using the Rietveld refinement method.22 The calculated mass percentages of the samples are listed in Table 1. Quantitative results gave the CdMoO4![[thin space (1/6-em)]](https://www.rsc.org/images/entities/char_2009.gif) :CdS mass ratios of 13.9:86.1, 22.6:77.4 and 47.8:55.2 corresponding to CdMoO4/CdS(i), CdMoO4/CdS(ii) and CdMoO4/CdS(iii), respectively. The results are in accordance with the analysis for the peak intensity of various samples which are consistent with the raw material added in the preparation process.
:CdS mass ratios of 13.9:86.1, 22.6:77.4 and 47.8:55.2 corresponding to CdMoO4/CdS(i), CdMoO4/CdS(ii) and CdMoO4/CdS(iii), respectively. The results are in accordance with the analysis for the peak intensity of various samples which are consistent with the raw material added in the preparation process.
 | ||
| Fig. 1 The XRD patterns of CdMoO4 with different amounts of CdS . | ||
| Samples | Ratio (%) | |
|---|---|---|
| CdMoO4 | CdS | |
| CdMoO4/CdS(i) | 13.9 | 86.1 |
| CdMoO4/CdS(ii) | 22.6 | 77.4 |
| CdMoO4/CdS(iii) | 47.8 | 55.2 |
As shown in Fig. 2, the SEM images reveal the morphological characteristics of the different samples. The microspheres and dendritic nanostructures with uniform size are clearly observed in Fig. 2(a) and (b), which display the morphologies of the pure CdMoO4 and CdS, respectively. In comparison, the SEM images of the hybrid materials with different amounts of MoO42− are presented in Fig. 2(c)–(e), demonstrating that these hybrid samples are composed of CdMoO4 microspheres and dendritic CdS nanostructures. Moreover, the ratio of the CdMoO4 microspheres in the composites increases with increasing amount of MoO42− in the initial hydrothermal reagent, which is consistent with the XRD results shown in Fig. 1. The high magnification SEM image of CdMoO4/CdS(ii) clearly shows that the dendritic CdS nanostructure is coupled with CdMoO4 microspheres, as shown in Fig. 2(f).
 | ||
| Fig. 2 Low magnification SEM images of (a) pure CdMoO4 microspheres, (b) pure CdS dendritic structures, (c) CdMoO4/CdS(i), (d) CdMoO4/CdS(ii) and (e) CdMoO4/CdS(iii). (f) High magnification SEM image of CdMoO4/CdS(ii). | ||
According to the above mentioned data, CdMoO4/CdS(ii) with coupled features has an appropriate mass ratio and a uniform morphology. Therefore, the CdMoO4/CdS(ii) product was selected as a typical sample for the optical characterization. The optical properties of the as-prepared samples were measured by an UV-vis diffuse reflectance spectrometer. Fig. 3 shows the UV-vis absorption spectra of the bare CdMoO4, CdS and CdMoO4/CdS(ii), respectively. The absorption edge for bare CdMoO4 is ∼370 nm, indicating that CdMoO4 has strong UV light absorption. The hybrid CdMoO4/CdS(ii) and bare CdS showed excellent light absorption within the visible light region. Therefore, the diffuse reflectance spectra indicate that the as-prepared composites are able to be photoexcited by both UV and visible light irradiation, and these novel hybrid structures could serve as an efficient solar light photocatalyst.2
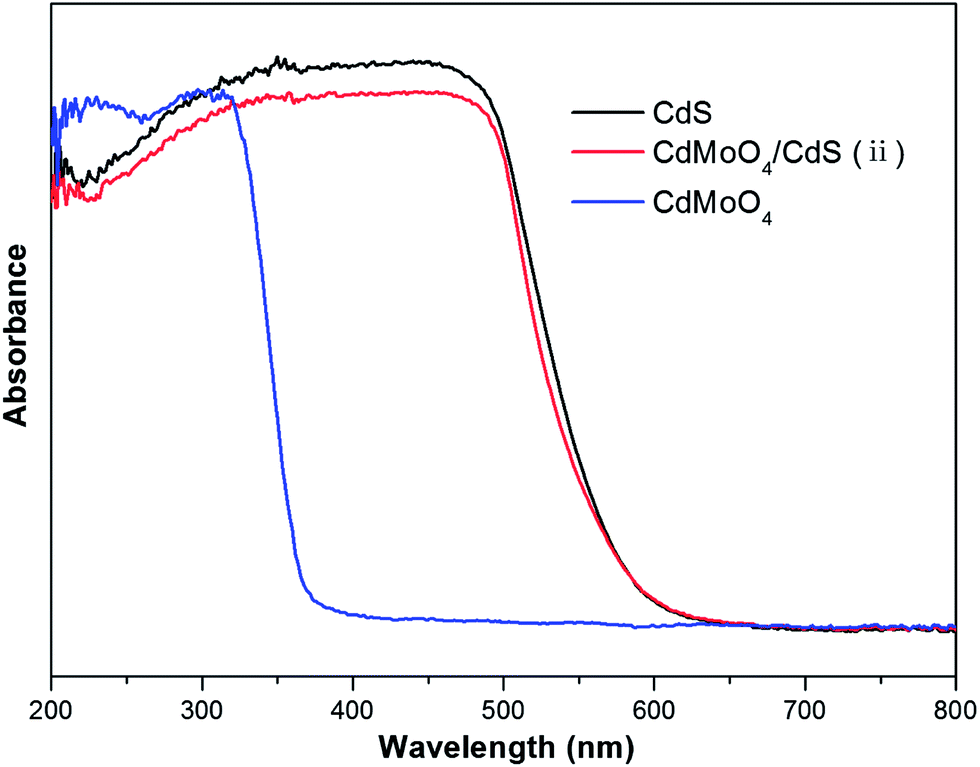 | ||
| Fig. 3 UV-vis diffuse reflectance spectra of CdMoO4/CdS(ii), pure CdMoO4 and CdS. | ||
The CdMoO4/CdS(ii) hybrid material was also characterized by Raman spectroscopy to confirm the constituent parts of the composite. The Raman features of the samples are shown in Fig. 4. Firstly, Raman spectra of the pure CdMoO4 and CdS were measured, which are in good agreement with the results reported in the literature.14,21,23–25 In contrast, the Raman peaks of CdMoO4/CdS(ii) appear at 303 cm−1 and 599 cm−1, which belong to the first and second-order LO phonon vibrational modes of CdS, respectively.24–26 Whilst, the other peaks at 399 cm−1 and 865 cm−1 correspond to the bending vibrations of v4(Bg) and the stretching of v1(Ag) of CdMoO4.14,21,23,27 These results strongly demonstrate the as-prepared composites are composed of CdMoO4 and CdS.
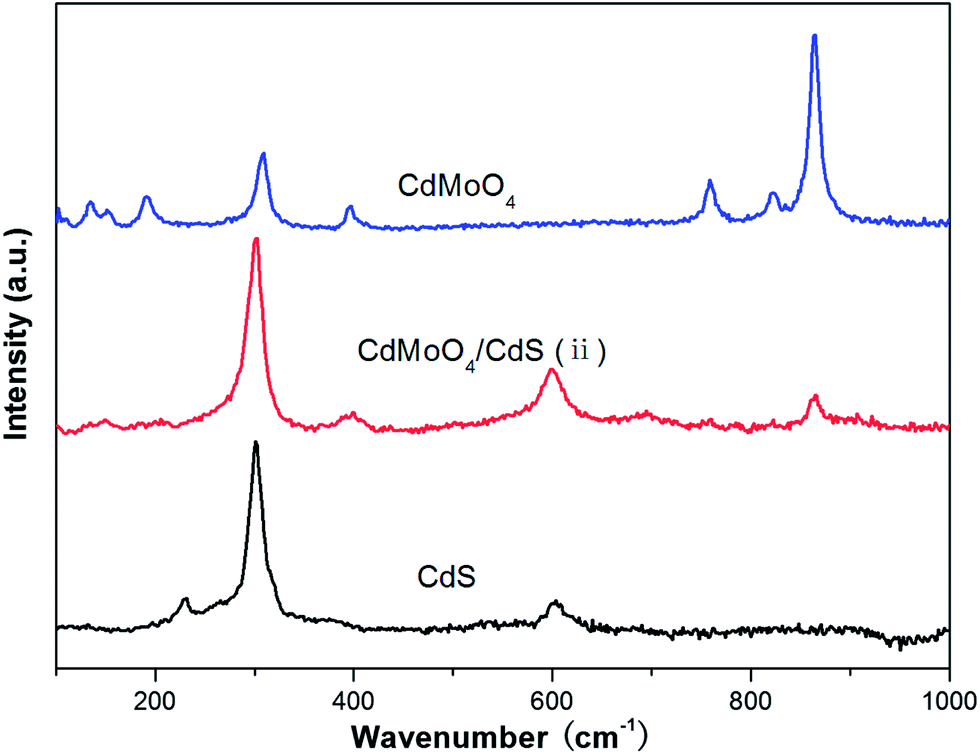 | ||
| Fig. 4 Raman spectra of CdMoO4/CdS(ii), pure CdMoO4 and CdS. | ||
The photoluminescence at room temperature of the as-prepared CdMoO4/CdS(ii) composite has been intensively studied. Fig. 5 displays the photoluminescence spectra of the as-prepared samples with the excitation wavelength of 310 nm. The emission peak at 372 nm in the PL spectrum is regarded to come from the charge-transfer transition between the O 2p orbital and the Mo 4d orbital within the MoO42− complex in the CdMoO4 structure.28,29 As has been reported in the literature, the PL properties of MMoO4 (where M = metal) are sensitive to synthetic conditions, morphologies, size, surface defect states, etc.30,31 Changes in microstructure and size would modify the electronic structures of MMoO4, and can influence the carriers excited from the valence band to the conduction band. Potential energy relaxation of the carriers on the product surface finally results in the luminescence variations.32 Therefore, the blue shift of the emission peak at 372 nm shown in the hybrid material is possibly due to the smaller size of CdMoO4. Moreover, it is obvious that CdMoO4/CdS(ii) also has a green emission centered at 531 nm, which is derived from the surface-defect emission of CdS caused by surface states such as sulphur vacancies and/or sulphur dangling bonds.33–35 The clear blue shift of this peak indicates the CdMoO4/CdS(ii) composite possesses a lower electron–hole recombination and quick charge transfer.36,37
 | ||
| Fig. 5 Photoluminescence spectra measured at room temperature for CdMoO4/CdS(ii), pure CdMoO4 and CdS. The excitation wavelength was 310 nm. | ||
X-ray photoelectron spectroscopy is a surface analytical technique that can provide useful information on the chemical composition of surfaces. In order to further investigate the chemical composition of the as-prepared CdMoO4/CdS(ii), XPS characterization was conducted. To further clarify and understand the chemical bonding between CdMoO4 and CdS in the CdMoO4/CdS nanocomposites presented here, the XPS analysis of the physical mixture of CdMoO4 and CdS (CdMoO4/CdS-p) was also carried out for comparison. The CdMoO4 and CdS mass ratios of CdMoO4/CdS-p were equal to the CdMoO4 and CdS mass ratios of CdMoO4/CdS(ii). Fig. 6(a) shows the XPS survey spectra of CdMoO4/CdS-p and CdMoO4/CdS(ii). The existence of C, S, Cd, Mo and O elements could be clearly observed both in the composite and the physical mixture. The XPS peak for C 1s at 284.8 eV was ascribed to unexpected carbon from the XPS instrument. The high resolution XPS spectra of Mo 3d in CdMoO4/CdS-p and CdMoO4/CdS(ii) are presented in Fig. 6(b). Two peaks at 232.3 and 235.5 eV of CdMoO4/CdS-p and CdMoO4/CdS(ii) can be ascribed to MoO3 which originates from the Mo(6+) ion of the CdMoO4.1,38 Interestingly, compared with CdMoO4/CdS-p, the spectrum of CdMoO4/CdS(ii) has two additional peaks at 228.0 and 231.1 eV. These two peaks, correspond to the Mo(4+) 3d orbital, indicating the possibility of an interaction between Mo with the superficial atoms of S in the as-prepared CdMoO4/CdS composites.39–41 In contrast with CdMoO4/CdS-p, new chemical bonding is observed in the hybrid character of the CdMoO4/CdS(ii) nanocomposite, which explains the close binding between the in situ grown CdMoO4 and CdS nanocrystals in the composite. Brunauer–Emmett–Teller (BET) nitrogen-adsorption measurements show that the specific surface areas of CdMoO4/CdS(ii) nanocomposite and CdMoO4/CdS-p are 1.17 m2 g−1 and 0.30 m2 g−1, respectively. The slightly higher specific surface areas of the as-prepared composites may be because the combination between CdMoO4 and CdS during the in situ growth process restricts the integration of the homogeneous material, and more surface areas could be explored in the case of a one-pot growing nanocomposite. It indicates that the CdMoO4/CdS(ii) nanocomposite may have a better adsorption capacity which is beneficial for the performance of a photocatalyst.
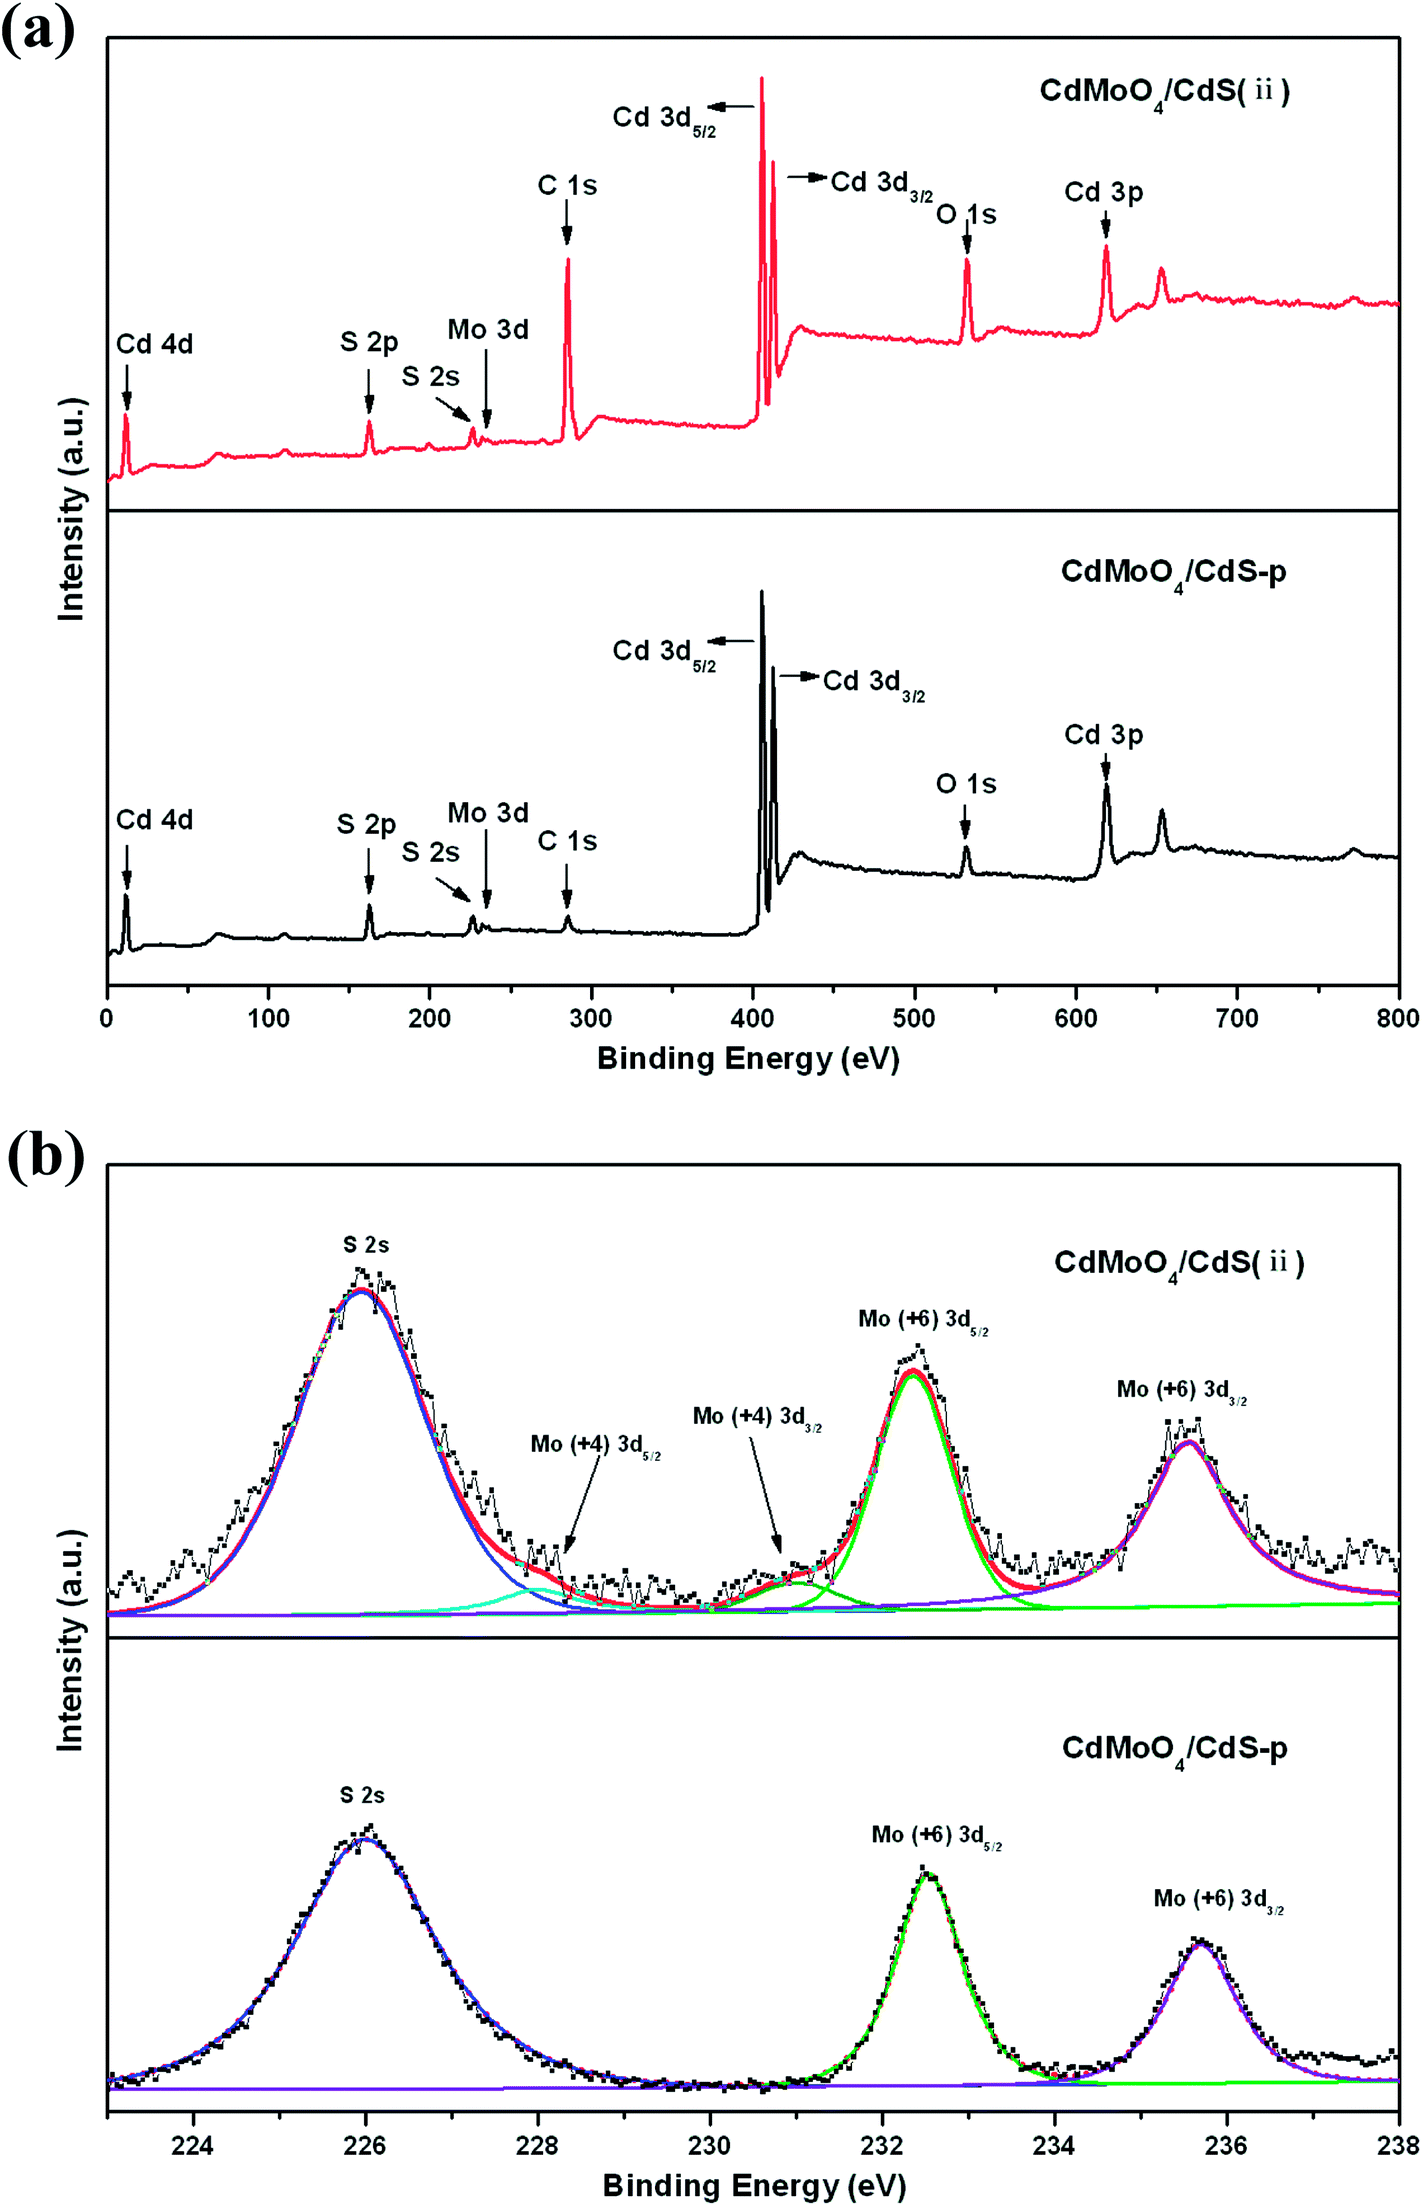 | ||
| Fig. 6 XPS spectra of (a) survey spectrum and (b) Mo 3d for CdMoO4/CdS(ii) and CdMoO4/CdS-p. | ||
To gain insight into the photocatalytic activity of the CdMoO4/CdS hybrid materials, the photo-degradation of RhB was performed. Before irradiation, the dark adsorption tests were carried out to estimate the adsorptivity of CdMoO4/CdS composites. As shown in Fig. 7, a bar chart shows the remaining RhB solution after reaching absorption equilibrium in the dark over the CdMoO4/CdS, CdMoO4/CdS-p, bare CdS and CdMoO4 photocatalysts. It can be seen that the most dye molecules remained in solution with bare CdMoO4 after equilibration in the dark for 1 h, whereas a large amount of dye molecules was adsorbed on the surface of other samples in the presence of CdS.
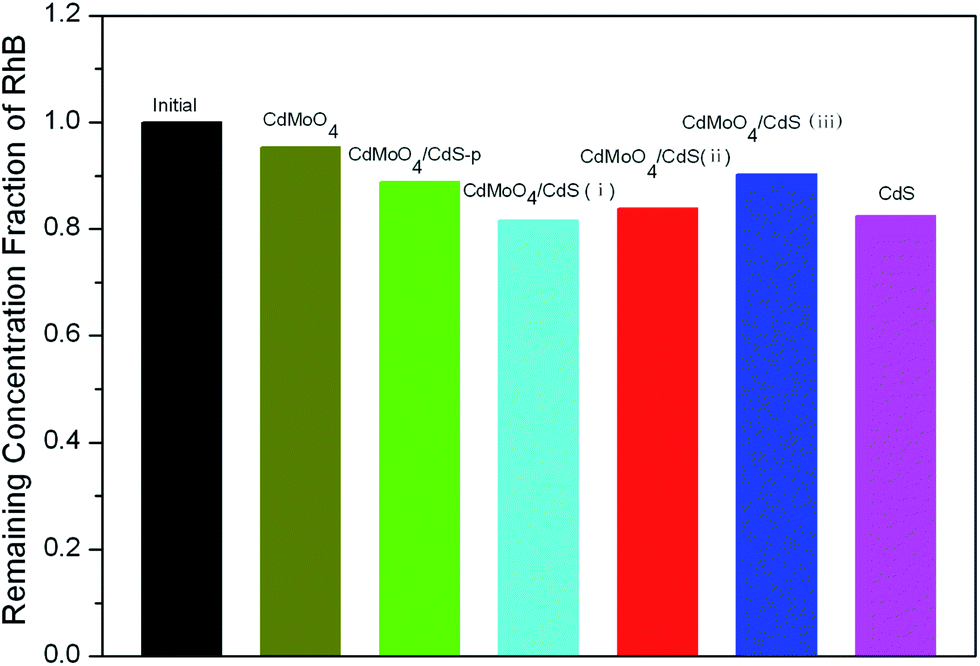 | ||
| Fig. 7 Bar chart showing the remaining RhB in solution after reaching the adsorption equilibrium in the dark over pure CdMoO4, pure CdS, CdMoO4/CdS-p, CdMoO4/CdS(i), CdMoO4/CdS(ii) and CdMoO4/CdS(iii). | ||
Fig. 8 shows the degradation of RhB using CdMoO4/CdS hybrid materials with different mass ratios, CdMoO4/CdS-p, bare CdS and CdMoO4 as photocatalysts under simulated solar irradiation. About 37.3% of RhB molecules were degraded in the first 10 min with the aid of as-prepared CdMoO4/CdS(ii); in contrast, only 9.7%, 26.1% and 2.1% of RhB molecules were degraded in the same reactions with CdMoO4/CdS-p, bare CdS and bare CdMoO4, respectively. Furthermore, after 40 min of simulated sunlight irradiation, 71.3% of the initial dyes were decomposed by CdMoO4/CdS(ii). Contrastingly, only 35.0% of the initial contaminants diminished after 40 min for CdMoO4/CdS-p, and the RhB molecules with the bare CdS and CdMoO4 were degraded by 58.5% and 12.2%. Clearly, the as-prepared CdMoO4/CdS(ii) composite photocatalyst exhibited the highest photoactivity under solar irradiation among all the photocatalysts presented here. The enhanced photodegradation efficiencies of the composites may benefit from the close binding and synergy effects between CdMoO4 and CdS in the CdMoO4/CdS(ii) composite.
 | ||
| Fig. 8 Photodegradation of RhB by pure CdMoO4, pure CdS, CdMoO4/CdS-p, CdMoO4/CdS(i), CdMoO4/CdS(ii) and CdMoO4/CdS(iii) under irradiation by simulated sunlight. | ||
The effects of CdMoO4 concentration on the photocatalytic activities of the composites were also investigated. After 40 min of simulated sunlight irradiation, 59.9% and 50.0% of the initial dyes were decomposed by CdMoO4/CdS(i) and CdMoO4/CdS(iii), respectively. Compared to the other hybrid materials, CdMoO4/CdS(ii) shows a superior photocatalytic activity. This could be explained by the different transfer efficiency of the photoelectrons in the composites, the low CdMoO4 concentration means that the photoelectrons from CdS couldn't effectively move to the CdMoO4 surface and the high CdMoO4 concentration suppresses the CdS meaning that not enough photoelectrons could be excited .
It is well known that the improved photocatalytic activities of the multi-band gap semiconductor composites depends on the position of their conduction and valence bands as well as their geometrical arrangement.37,42,43 As proposed in Scheme 1, when the hybrid material is under simulated sunlight irradiation, both CdMoO4 and CdS are excited; electrons are injected from the conduction band of CdS to CdMoO4. In addition, more photoelectrons are generated from the valence band of CdMoO4 microspheres by harvesting UV photons. In this case, a high concentration of electrons is obtained in the conduction band of CdMoO4 compared to the bare one.37,44 Beside the thermodynamically favorable energy bands, the geometrical architecture of the composite with coupled features and uniform morphologies is also an important factor which benefits the separation of photo-induced electron–hole pairs and improves the transfer of the charge carriers to the solid–liquid interface. Whereas the relatively low photoactivity of CdMoO4/CdS(i) and (iii) composites might be the result of the unbalance between the coupling effect and UV light absorption. Overall, lower concentrations of CdS in the hybrid material reduces the absorption of UV light, and higher concentrations of CdS hinder the coupling ultimately decreasing the overall photocatalytic activity of the composite.
 | ||
| Scheme 1 Diagram of CdMoO4/CdS nanostructures with the proposed photocatalytic mechanism. | ||
4. Conclusion
In summary, CdMoO4/CdS hybrid materials have been fabricated through a one-step hydrothermal method. Compared with bare CdMoO4 and CdS, the degradation performances of CdMoO4/CdS hybrid materials are obviously improved under solar irradiation. The superior photocatalytic activity is proposed to be the result of the extended light absorption range and enhanced charge separation. This work is anticipated to promote practical applications of photocatalysts under solar irradiation.Acknowledgements
This work was supported by the Grants from National Natural Science Foundation of China (no. 51172191, 51002129 and 11074211), National Basic Research Program of China (2012CB921303), the Hunan Provincial Innovation Foundation for Graduate (no. CX2012B265) and the Open Fund based on innovation platform of Hunan colleges and universities (no. 13K045).References
- G. Gyawali, R. Adhikari, B. Joshi, T. H. Kim, V. Rodríguez-González and S. W. Lee, J. Hazard. Mater., 2013, 263, 45–51 CrossRef CAS PubMed.
- S. Liu, N. Zhang, Z.-R. Tang and Y.-J. Xu, ACS Appl. Mater. Interfaces, 2012, 4, 6378–6385 CAS.
- J. Hou, C. Yang, Z. Wang, S. Jiao and H. Zhu, RSC Adv., 2012, 2, 10330–10336 RSC.
- L. Ren, X. Qi, Y. Liu, Z. Huang, X. Wei, J. Li, L. Yang and J. Zhong, J. Mater. Chem., 2012, 22, 11765–11771 RSC.
- J. Zhang, W. Chen, J. Xi and Z. Ji, Mater. Lett., 2012, 79, 259–262 CrossRef CAS PubMed.
- J. Zhang, J. Xi and Z. Ji, J. Mater. Chem., 2012, 22, 17700–17708 RSC.
- T. Peng, K. Li, P. Zeng, Q. Zhang and X. Zhang, J. Phys. Chem. C, 2012, 116, 22720–22726 CAS.
- X. Wang, G. Liu, G. Q. Lu and H.-M. Cheng, Int. J. Hydrogen Energy, 2010, 35, 8199–8205 CrossRef CAS PubMed.
- J. S. Jang, H. G. Kim, U. A. Joshi, J. W. Jang and J. S. Lee, Int. J. Hydrogen Energy, 2008, 33, 5975–5980 CrossRef CAS PubMed.
- Z. Shao, W. Zhu, Z. Li, Q. Yang and G. Wang, J. Phys. Chem. C, 2011, 116, 2438–2442 Search PubMed.
- J. L. Brito and A. L. Barbosa, J. Catal., 1997, 171, 467–475 CrossRef CAS.
- A. Kaddouri, R. Del Rosso, C. Mazzocchia, P. Gronchi and D. Fumagalli, J. Therm. Anal. Calorim., 2001, 66, 63–78 CrossRef CAS.
- D. Li and Y. Zhu, CrystEngComm, 2012, 14, 1128–1134 RSC.
- A. Phuruangrat, N. Ekthammathat, T. Thongtem and S. Thongtem, J. Phys. Chem. Solids, 2011, 72, 176–180 CrossRef CAS PubMed.
- Q. Dai, G. Zhang, P. Liu, J. Wang and J. Tang, Inorg. Chem., 2012, 51, 9232–9239 CrossRef CAS PubMed.
- X. e. Wang, T. Liu, Q. Zhang, H. Zhang, J. Yin, M. Song and X. Guo, Phys. Status Solidi B, 2008, 245, 132–135 CrossRef CAS.
- M. Fujita, M. Itoh, T. Katagiri, D. Iri, M. Kitaura and V. B. Mikhailik, Phys. Rev. B: Condens. Matter Mater. Phys., 2008, 77, 155118 CrossRef.
- L. Zhou, W. Wang, H. Xu and S. Sun, Cryst. Growth Des., 2008, 8, 3595–3601 CAS.
- V. B. Mikhailik, H. Kraus, D. Wahl and M. S. Mykhaylyk, Phys. Status Solidi B, 2005, 242, R17–R19 CrossRef CAS.
- Y. Abraham, N. A. W. Holzwarth and R. T. Williams, Phys. Rev. B: Condens. Matter Mater. Phys., 2000, 62, 1733–1741 CrossRef CAS.
- G. Xing, Y. Xu, C. Zhao, Y. Wang, Y. Li, Z. Wu, T. Liu and G. Wu, Powder Technol., 2011, 213, 109–115 CrossRef CAS PubMed.
- M. G. Aylmore and G. S. Walker, Powder Diffr., 1998, 13, 136–143 CrossRef CAS.
- A. Jayaraman, S. Y. Wang and S. K. Sharma, Phys. Rev. B: Condens. Matter Mater. Phys., 1995, 52, 9886–9889 CrossRef CAS.
- J. S. Suh and J. S. Lee, Chem. Phys. Lett., 1997, 281, 384–388 CrossRef CAS.
- S. Rengaraj, S. Venkataraj, S. H. Jee, Y. Kim, C.-w. Tai, E. Repo, A. Koistinen, A. Ferancova and M. Sillanpää, Langmuir, 2010, 27, 352–358 CrossRef PubMed.
- X. Li, Y. Gao, L. Yu and L. Zheng, J. Solid State Chem., 2010, 183, 1423–1432 CrossRef CAS PubMed.
- M. Daturi, G. Busca, M. M. Borel, A. Leclaire and P. Piaggio, J. Phys. Chem. B, 1997, 101, 4358–4369 CrossRef CAS.
- R. Grasser, E. Pitt, A. Scharmann and G. Zimmerer, Phys. Status Solidi B, 1975, 69, 359–368 CrossRef CAS.
- Y. Li, S. Tan, J. Jiang, Z. Huang and X. Tan, CrystEngComm, 2011, 13, 2649–2655 RSC.
- J. H. Ryu, J.-W. Yoon, C. S. Lim, W.-C. Oh and K. B. Shim, J. Alloys Compd., 2005, 390, 245–249 CrossRef CAS PubMed.
- J.-W. Yoon, J. H. Ryu and K. B. Shim, Mater. Sci. Eng., B, 2006, 127, 154–158 CrossRef CAS PubMed.
- L. Zhen, W. S. Wang, C. Y. Xu, W. Z. Shao, M. M. Ye and Z. L. Chen, Scr. Mater., 2008, 58, 461–464 CrossRef CAS PubMed.
- P. V. Kamat, N. M. Dimitrijevic and R. W. Fessenden, J. Phys. Chem., 1987, 91, 396–401 CrossRef CAS.
- G. Q. Xu, B. Liu, S. J. Xu, C. H. Chew, S. J. Chua and L. M. Gana, J. Phys. Chem. Solids, 2000, 61, 829–836 CrossRef CAS.
- Q. Pan, K. Huang, S. Ni, Q. Wang, F. Yang and D. He, Mater. Lett., 2007, 61, 4773–4776 CrossRef CAS PubMed.
- K. Fujihara, S. Izumi, T. Ohno and M. Matsumura, J. Photochem. Photobiol., A, 2000, 132, 99–104 CrossRef CAS.
- L. Wang and W. Wang, CrystEngComm, 2012, 14, 3315–3320 RSC.
- R. Adhikari, S. Malla, G. Gyawali, T. Sekino and S. W. Lee, Mater. Res. Bull., 2013, 48, 3367–3373 CrossRef CAS PubMed.
- X. Zong, H. Yan, G. Wu, G. Ma, F. Wen, L. Wang and C. Li, J. Am. Chem. Soc., 2008, 130, 7176–7177 CrossRef CAS PubMed.
- Y. Liu, Y.-X. Yu and W.-D. Zhang, J. Phys. Chem. C, 2013, 117, 12949–12957 CAS.
- X. Zong, G. Wu, H. Yan, G. Ma, J. Shi, F. Wen, L. Wang and C. Li, J. Phys. Chem. C, 2010, 114, 1963–1968 CAS.
- Y. C. Zhang, Z. N. Du, K. W. Li, M. Zhang and D. D. Dionysiou, ACS Appl. Mater. Interfaces, 2011, 3, 1528–1537 CAS.
- M. Wang, J. Jiang, G. Liu, J. Shi and L. Guo, Appl. Catal., B, 2013, 138–139, 304–310 CrossRef CAS PubMed.
- D. Kannaiyan, E. Kim, N. Won, K. W. Kim, Y. H. Jang, M.-A. Cha, D. Y. Ryu, S. Kim and D. H. Kim, J. Mater. Chem., 2010, 20, 677–682 RSC.
| This journal is © The Royal Society of Chemistry 2014 |