Synthesis and characterization of graphene oxide–polyimide nanofiber composites†
S. Ramakrishnana,
M. Dhakshnamoorthyb,
E. J. Jelmya,
R. Vasanthakumarib and
Nikhil K. Kothurkar*a
aCenter of Excellence for Advanced Materials and Green Technologies, Department of Chemical Engineering and Materials Sciences, Amrita Vishwa Vidyapeetham, Coimbatore-641112, Tamil Nadu, India. E-mail: nikhil.kothurkar@gmail.com; Tel: +91-422-2685000 ext. 5557
bPolymer Nanotechnology Centre, B. S. Abdur Rahman University, Chennai-600 048, Tamil Nadu, India
First published on 11th December 2013
Abstract
Graphene oxide–polyimide (GO–PI) nanofiber composites were made by electrospinning poly(amic acid) (PAA) containing up to 2 wt% graphene oxide (GO), followed by thermal imidization of PAA. The resulting GO–PI nanofiber composites were characterized by Fourier transform infrared spectroscopy, X-ray diffraction, Raman spectroscopy, thermogravimetric analysis, transmission electron microscopy (TEM) and high resolution scanning electron microscopy (HRSEM). The formation of GO was confirmed by X-ray diffraction, infrared and Raman spectroscopy. Morphological analysis of the nanocomposites done with HRSEM indicates that the GO is bunched up into bead or spindle-like structures within the nanofibers. Dynamic mechanical analysis indicates that adding up to 2 wt% GO to PI leads to an improvement in the storage modulus from 1.4 × 10⁸ to 3.8 × 10⁸ Pa and an improvement in the glass transition temperature from 317 to 323 °C over neat PI. Thermogravimetric analysis also shows increasing thermal stability with increasing GO content.
1. Introduction
Aromatic polyimides (PI) are one of the most important high performance materials in microelectronics and aircraft industries because of their superior mechanical properties, excellent thermal stability, high glass transition temperature, and good resistance to solvents.1,2 Electrospun nanofibers possess many unique properties including a large specific surface area and superior mechanical properties, and they have a potential use as nanoscale building blocks. Nanofibers have been successfully prepared for many applications such as filters, nanoelectronic3 optical and chemical sensors, catalyst systems, scaffolds for tissue regeneration and immobilized enzymes.3–6 The main advantage of electrostatic spinning is the ability to produce ultrafine fibers ranging from nanometer to submicron diameters.G. Wu et al. reported polyimide-based composite films containing carbon black (CB), carbon nanotubes (CNTs) and carbon nanofibers (CNFs). They were prepared using low molecular weight poly(amic acid) (PAA), a precursor of PI, as an impurity-free dispersant. A significant improvement in the Young's modulus of the composites was observed compared to neat PI and the CNT-loaded composites showed a higher Young's modulus than the CB or CNF-loaded composites.7 Hopkins et al. made PI and polyaniline nanofiber nanocomposites.8 Cheng et al. synthesized non-woven polyimide and silica nanofiber composites combining electrospinning and controlled in situ sol–gel techniques. These composites with a 6.58 wt% of SiO2 content showed an increase of 133 °C in the decomposition temperature and a four-fold increase in the ultimate tensile strength, compared to a neat PI fabric.9
Graphene and related materials, make attractive materials for electric, optoelectronic, and photonic devices,10 due to their fascinating electrical and mechanical properties such as superior Hall mobilities, thermal conductivity, current-carrying capabilities, and room temperature ballistic transport. However, pristine graphene is unsuitable for intercalation of polymer chains, because graphene tends to agglomerate in the polymer matrix during processing. Graphene converted to graphene oxide shows improved dispersability in polymer matrices and organic systems. Wu et al. demonstrated that the functionalization of graphene oxide (GO) sheets with PI enables a layer-by-layer fabrication of a GO–PI hybrid resistive switching device and leads to high reproducibility of the memory effect.11 Yuan-Li Huang et al. reported graphene nanosheet–polyimide (GNS–PA66) and polyvinylpyrrolidone-modified graphene nanosheet–polyamide (PVP-GNS–PA66) composite films with a surface resistance of up to 8.6 × 10³ Ω per square, while maintaining 88% light transmittance.12 Longun, et al. reported composites of polyimide with nanoscale graphene synthesized via in situ condensation polymerization. They reported that the presence of graphene significantly influenced the storage modulus, the damping ability and the glass transition temperature of the composite. Graphene contents (≥18 vol%) were found to hinder polymer chain flexibility and chain motion13 due to the 2D geometry of graphene.
The present study deals with the synthesis and characterization of GO and PI nanofiber composites for potential electronic applications. GO was synthesized from graphite (<20 μm; Sigma Aldrich) by Hummers' method and dispersed in N,N′-dimethyl formamide (DMF). The polymerization of poly(amic acid) (PAA) was carried out in the GO–DMF dispersion. The resulting nanofiber composites were characterized by Fourier transform infrared spectroscopy (FTIR), high resolution scanning electron microscopy (HRSEM), X-ray diffraction (XRD), Raman spectroscopy analysis and dynamic mechanical analysis (DMA).
2. Experimental
2.1 Chemicals and materials
Pyromellitic dianhydride (PMDA)-97%, and N,N′-dimethyl formamide (DMF, boiling point 153 °C) were obtained from Sigma-Aldrich, 4,4′-oxydianiline (ODA) 98% was supplied by Alfa Aesar. Graphite powder (<20 μm) was purchased from Sigma Aldrich. All chemicals were used without further purification.2.2 Synthesis of the poly(amic acid)–graphene oxide solution
Graphene oxide was synthesized from graphite powder using Hummers' method.14 The desired amount of GO was dispersed in DMF by ultrasonication for 1 h. ODA was added to it and dissolved completely. An equimolar quantity of PMDA was added and the solution was stirred at room temperature for 12 h, forming a viscous solution of GO–PAA in DMF. This is the precursor for GO–PI.2.3 Electrospinning of the GO–PAA solution
The GO–PAA solution was electrospun into a non-woven nanofiber mat using an electrostatic spinning unit (Espin-Nano, Physics Instruments, Chennai, India). It had a 2 mL syringe with a needle inner diameter of 0.40 mm. The GO–PAA solution was extruded from the syringe at an applied voltage of 15 kV and a flow rate of 0.2 mL h−1 onto a piece of aluminum foil, which was wrapped around a negatively charged drum collector rotating at 2000 rpm, placed 12 cm away.2.4 Imidization of the GO–PAA nanofiber mat
The imidization of the GO–PAA nanofiber mats on the aluminium foil was conducted with a 3-step heat treatment in a hot air oven at 100 °C for 1 h (solvent removal), 250 °C for 1 h (dehydration and cyclization) and 350 °C for 1 h (imidization). The heating rate was 5 °C min−1 between the steps. Thus, a GO–PI nanofiber mat was obtained.2.5 Characterization
The morphological analysis of the nanofiber composites was carried out on a HRSEM FEI Quanta FEG 200 instrument. High Resolution Transmission Electron Microscopy (HRTEM) analysis was carried out using a JEOL JEM 2100 transmission electron microscope. Atomic Force Microscopy (AFM) was carried out by using an NTEGRA Prima from NT-MDT. The fiber diameter was calculated using the ImageJ software. Raman spectroscopy was carried out on a LabRAM HR UV-VIS-NIR Raman microscope from HORIBA Jobin Yvon (633 nm laser source). Wide-angle XRD measurements were performed at room temperature (25 °C) on a Bruker D8 Focus X-ray diffractometer having a Ni-filtered Cu Kα radiation (λ = 1.541 Å) and a scintillator detector (40 kV, 40 mA). The measurements were done in a 2θ range of 5–90° at 0.04°/step and 1 s/step. FTIR spectra were recorded on a Thermo Nicolet iS10 FTIR spectrometer (ATR mode) in the range of 650–4000 cm−1. Thermogravimetric analysis was done using Seiko Instruments TG/DTA 6200 and EXSTAR 6000 under a 140 mL min−1 N2 flow and a heating rate of 20 °C min−1. Dynamic mechanical analysis for GO–PI nanofiber webs was carried out under a tensile mode on a Seiko Instrument DMS 6100 at a frequency of 1 Hz and heating rate of 2 °C min−1 in air. The dynamic mechanical property values reported in this paper are an average test run on at least three samples. Electrical resistance was measured with a two point probe setup from Lab Equipments, Chennai, India, consisting of two silver probes in a voltage range of 0–30 V DC.3. Results and discussion
Fig. 1(a) shows PAA solutions with different contents of graphene oxide. A neat PAA solution has a dark yellow colour and with increasing contents of graphene oxide, the colour becomes black. Fig. 1(b) shows webs of GO–PAA electrospun on an aluminum foil, with different contents of GO. Fig. 1(c) shows GO–PI films after imidization of the GO–PAA mat. GO–PI can be easily detached from the Al foil substrate compared to the GO–PAA mat due to the loss of water after imidization. | ||
| Fig. 1 (a) Poly(amic acid) (PAA) solutions with different levels of graphene oxide (GO) loading, (b) electrospun webs of poly(amic acid) (PAA) with different levels of graphene oxide (GO) loading, before imidization and (c) after imidization. | ||
3.1 Characterization of the nanofiber composites
The Raman spectrum of graphene is characterized by two prominent features: a G-band at 1567 cm−1 arising due to the first order Raman scattering of the E2G phonon at the Brillouin zone center of sp2 carbon atoms, and a D-band arising from the breathing mode of the k-point phonons of A1G symmetry at 1356 cm−1. The D-band requires a defect for its activation and hence is an indicator of defects. The Raman spectrum of GO (Fig. 2(b)) shows an intense D-band at 1321 cm−1 as expected, and a broad G-band at 1575 cm−1. The ratio of the intensities of the D-band and G-band is 0.85 and it indicates the presence of defects introduced in graphene during the oxidation process.15–17 | ||
| Fig. 2 (a) FTIR spectra of graphite (GR) and graphene oxide (GO), (b) Raman spectrum of the graphene oxide (GO), (c) X-ray powder diffractograms of graphite, and (d) graphene oxide. | ||
The distinctive X-ray powder diffractogram features of graphite and the synthesized GO are presented in Fig. 2(c) and (d). For the graphite sample, the characteristic peak of hexagonal graphite corresponding to a d-spacing of 0.334 nm was found at 26.6°. Upon conversion of the graphite into GO, the peak position shifted to 10.06° corresponding to an interlayer spacing of 0.878 nm. This increase in d-spacing is due to the intercalation of –OH and other functional groups in between the graphene layers.15,18
The HRSEM image indicates GO to be a few micrometers in length and width (Fig. 3(a)). Fig. 3(b) shows the AFM image of GO deposited on a freshly cleaved mica slide, which confirms the HRSEM observations. The GO sheets appear to be folded, wrinkled and stacked above one another in places. A line scan was conducted on this sample as shown in Fig. 3(b). Fig. 3(c) shows the height profile of the line scan. The thickness of this layer from the mica surface is roughly 7 nm. Assuming the thickness of each layer of GO to be about 0.878 nm, we can infer that this is a 8-layer sheet of GO.
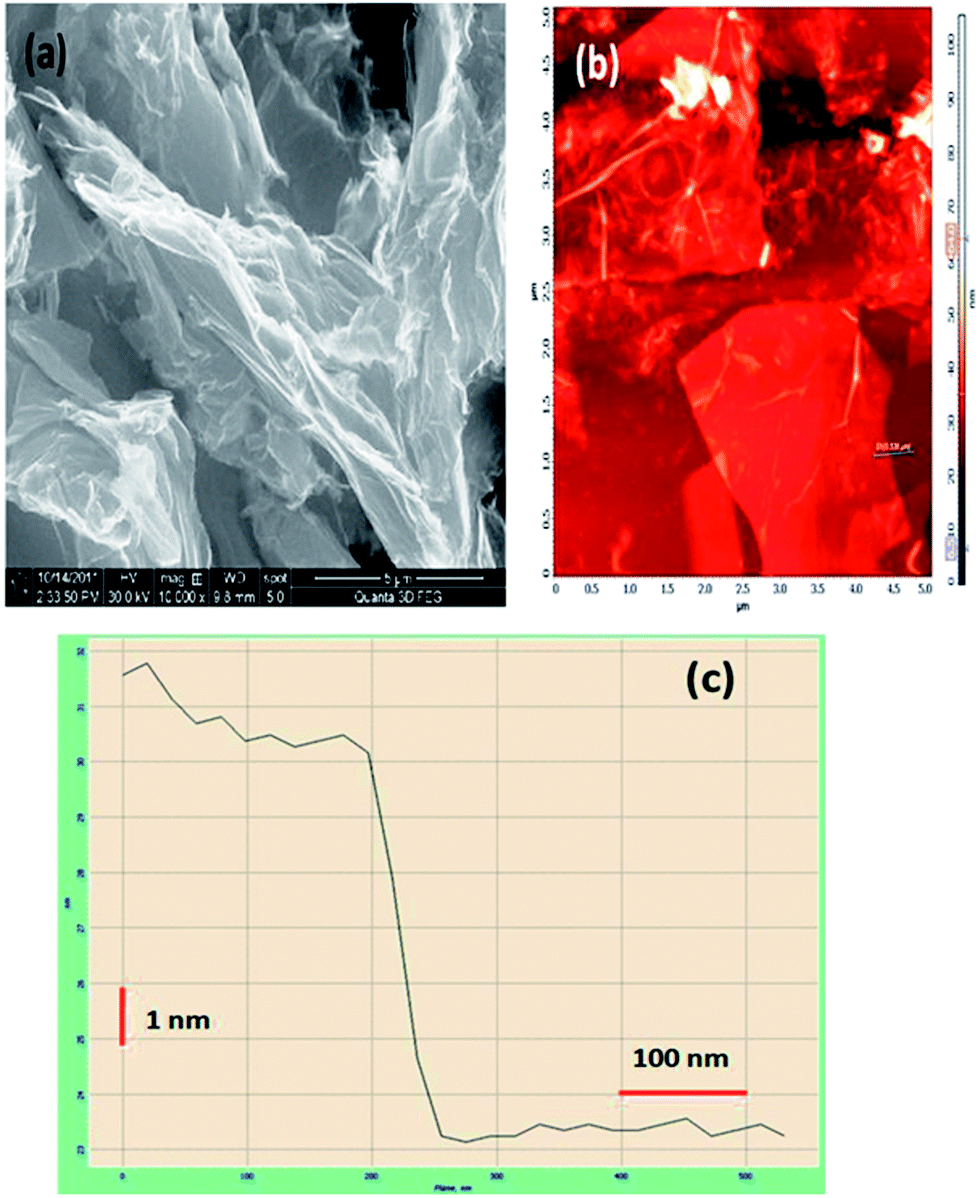 | ||
| Fig. 3 (a) SEM image of graphene oxide, (b) AFM image of graphene oxide and (c) height profile of graphene oxide. | ||
The FTIR spectra of graphite and GO are shown in Fig. 2(a). Among the salient features observed are the bands at 1716, 1557 and 1035 cm−1, corresponding to the stretching modes of C![[double bond, length as m-dash]](https://www.rsc.org/images/entities/char_e001.gif) O, –CC and C–O–C groups in GO respectively.15,17,19 Fig. 4(a) and (b) depict the FTIR spectra of GO–PAA and GO–PI nanofiber composites respectively. The composites electrospun on Al foil, showed the carboxylic –OH stretching (3500 cm−1), the –CO stretching (1719 cm−1) and amide group vibration modes (1660 and 1544 cm−1), consistent with the presence of PAA. After heat treatment, which led to amidation of PAA between 50 and 125 °C and imidization at around 350 °C, the carboxylic –OH stretching band was found to be absent, indicating the conversion of PAA to PI. The other characteristic peaks of polyimide such as the CO asymmetric stretching (1775 and 725 cm−1), C–N stretching (1377 cm−1) and CO bending (725 cm−1) were also observed.9 The absence of the C–N–H stretching (1544 cm−1) indicated complete imidization of the sample.2,7
O, –CC and C–O–C groups in GO respectively.15,17,19 Fig. 4(a) and (b) depict the FTIR spectra of GO–PAA and GO–PI nanofiber composites respectively. The composites electrospun on Al foil, showed the carboxylic –OH stretching (3500 cm−1), the –CO stretching (1719 cm−1) and amide group vibration modes (1660 and 1544 cm−1), consistent with the presence of PAA. After heat treatment, which led to amidation of PAA between 50 and 125 °C and imidization at around 350 °C, the carboxylic –OH stretching band was found to be absent, indicating the conversion of PAA to PI. The other characteristic peaks of polyimide such as the CO asymmetric stretching (1775 and 725 cm−1), C–N stretching (1377 cm−1) and CO bending (725 cm−1) were also observed.9 The absence of the C–N–H stretching (1544 cm−1) indicated complete imidization of the sample.2,7
 | ||
| Fig. 4 FTIR spectra of (a) GO–PAA and (b) GO–PI with GO contents of 0% (neat PAA & PI), 0.1%, 1.0% and 2.0% (by weight). | ||
Raman spectroscopy has been widely used for characterizing polymers and graphene. Fig. 5(a) shows the Raman spectra of neat PI and its nanofiber composites with different GO contents. The peak at 1390 cm−1 in neat PI indicates the C–N stretching of the imide ring. The characteristic Raman features of graphene namely the D-band (∼1321 cm−1) and the G-band (∼1575 cm−1) can also be observed in the composite samples. However, in the composite samples, the band of PI at 1390 cm−1 and the D-band of GO at 1321 cm−1 were found to overlap and could not be distinguished as they were broad and close to each other. With increasing GO content in the nanofiber composites, the peaks in the vicinity of 1320 cm−1 (predominantly due to the graphene D-band) and 1575 cm−1 (graphene G-band) were both found to increase as expected.1,13
 | ||
| Fig. 5 (a) Raman spectra and (b) TGA curves of GO–PI with GO contents of 0% (neat PI), 0.1%, 1.0% and 2.0% (by weight). | ||
Thermal stability is an important property for PI-based nanocomposites since they are often used as high-performance engineering plastics. The presence of inert nanofillers in PI can improve the thermal and mechanical properties.1 Fig. 5(b) shows the TGA curves of GO and GO–PI composites. The TGA curve of GO indicates weight losses of 17%, 33% and 50% at 150 °C, 200 °C and 350 °C, respectively. These have been respectively attributed to the evaporation of absorbed water, the decomposition of labile oxygen functional groups (such as hydroxyl, epoxy and carbonyl) and the removal of the more stable oxygen functionalities (such as phenol, carbonyl and quinone).20–22 In the TGA curve of the PAA nanofiber mat (Fig. 5(b)), there was a significant weight loss (10.7%) at 250 °C. This is due to the loss of H2O molecules during the formation of the imide linkage of the amic acid. In the case of the PI nanofiber mat, there was a weight loss of only about 3% up to 300 °C. These results are indicative of the conversion of PAA to PI. Further, all the PI samples showed an increase in thermal stability with increasing GO content, compared to neat PI. The temperatures for a 10% weight loss in GO–PI samples containing 0%, 0.1%, 1% and 2% GO (by weight) were found to be 503 °C, 527 °C, 543 °C, and 603 °C, respectively.
Fig. 6(a) shows PAA nanofibers with a few tens of micrometers in length and an average diameter of 94 ± 18 nm. Fig. 7(a) shows the presence of PI nanofibers with a few tens of micrometers in length and an average diameter of 84 ± 16. Thus, shrinkage in the average fiber diameter from 94 nm in PAA to 84 nm in PI was observed after thermal imidization. This can be attributed to the elimination of water molecules during imidization. Table 1 indicates the diameters of the nanofibers with composites containing 0%, 0.1%, 1% and 2% of GO (by weight).
 | ||
| Fig. 6 Scanning electron micrographs of GO–PAA with GO contents of (a) 0% (neat PAA), (b) 0.1% (GO), (c) 1% (GO), and (d) 2% (GO). | ||
 | ||
| Fig. 7 Scanning electron micrographs of GO–PI with GO contents of (a) 0% (neat PI), (b) 0.1% (GO), (c) 1% (GO), and (d) 2% (GO). | ||
| Sample | GO–PAA diameter | GO–PI diameter | ||
|---|---|---|---|---|
| GO content | Fiber (nm) | Bead (μm) | Fiber (nm) | Bead (μm) |
| Neat (0%) | 94 ± 18 | — | 84 ± 16 | — |
| 0.1% | 120 ± 25 | 0.67 ± 0.14 | 134 ± 27 | 0.91 ± 0.23 |
| 1.0% | 125 ± 23 | 0.77 ± 0.22 | 105 ± 20 | 0.83 ± 0.12 |
| 2.0% | 143 ± 25 | 0.65 ± 0.11 | 141 ± 27 | 0.79 ± 0.13 |
Fig. 6(b–d) and 7(b–d) show the HRSEM images of GO–PAA and GO–PI nanofiber composites. Bead or spindle-like structures were observed in the nanofibers in both the GO–PAA and GO–PI composites. The density of these beads (numbers over an area of 11 × 11 μm) as observed in the SEM images was found to increase with increasing content of GO (35, 100 and 110 beads respectively for PI–GO (0.1%), PI–GO (1%) and PI–GO (2%)). The sizes of the nanofibers in the GO–PAA composites as observed in Fig. 6(b–d) were 94–143 nm and the sizes of the beads were in the range of 0.65–0.77 μm (Table 1). After thermal imidization, the GO–PI nanofiber composites (Fig. 7(b–d)) did not show a significant change in either the nanofiber diameters (84–143 nm) or the bead sizes (0.79–0.91 μm). This is due to the large variability in the nanofiber diameters and bead sizes relative to the change in mass (volume) of PAA upon conversion to PI.
The TEM images of PAA–GO (0.1, 1 and 2 wt% GO) are shown in Fig. 8(a–c) and S2(a–c).† It can be clearly observed from these images that the bead-like structures (0.50–1.20 μm) are nanofibers that have bulged due to the GO present inside them (Fig. 8(e)). Rolled GO sheets can also be seen to extend from the bulged areas into the nanofibers (Fig. 8(d)). Samples with a higher GO content show a greater density of beads.23,24
 | ||
| Fig. 8 Transmission electron micrographs of GO–PAA with GO contents of (a,d,e) 0.1% (GO), (b) 1% (GO), and (c) 2% (GO). | ||
We propose that during the electrospinning process as the GO–polymer solution is squeezed through the syringe needle, the GO gets deformed under shear. As the jet of the polymer solution exits the needle towards the collecting drum, the GO in the jet relaxes and gets bunched up before the solidification of the jet into a nanofiber.23,25,26 H. Fong et al.27 have reported similar bead and spindle-like structures in electrospun nanofibers of poly(ethylene oxide) with NaCl.
Since the sizes of the GO sheets are in the order of a few microns and the nanofiber diameters are in the order of 100 nm, the bulging of the nanofibers due to the inclusion of the GO sheets is highly probable. The formation of the beads is indicative of a low interfacial interaction between GO and the polymer matrix, which encourages GO to bunch up rather than conform to the shape of the matrix. It is possible to avoid bead formation only at very low contents of GO (∼0.07 wt%) and by specific functionalization of the GO so as to improve its compatibility with the polymer matrix.26 However, since the GO used for this study was not specifically functionalized, an increasing GO content is likely to lead to a higher number of beads per unit area.
3.2 Dynamic mechanical and electrical properties of GO–PI with GO contents of 0% (neat PI), 0.1%, 1.0% and 2.0% (by weight)
The DMA spectra of the electrospun PI mats with different GO contents (0–2 wt%) are shown in Fig. 9. The glass transition temperature (Tg) of the samples measured from the peaks in the tan![[thin space (1/6-em)]](https://www.rsc.org/images/entities/char_2009.gif) δ vs. temperature curves, increased from 317 °C to 323 °C as the GO content increased from 0 to 2 wt%. The storage modulus (E′) values also increased from 1.4 × 10⁸ to 3.8 × 10⁸ Pa for the same samples. This is indicative of some interaction between the PI matrix and the GO filler. This interaction might be the result of carrying out the polymerization of the samples in the presence of GO, leading to possible hydrogen bonding between the PI matrix and the functional groups of GO. Moreover, the beads in the nanofiber mat are likely to provide better interlocking between the fibers, leading to an overall stiffer material (higher E′).
δ vs. temperature curves, increased from 317 °C to 323 °C as the GO content increased from 0 to 2 wt%. The storage modulus (E′) values also increased from 1.4 × 10⁸ to 3.8 × 10⁸ Pa for the same samples. This is indicative of some interaction between the PI matrix and the GO filler. This interaction might be the result of carrying out the polymerization of the samples in the presence of GO, leading to possible hydrogen bonding between the PI matrix and the functional groups of GO. Moreover, the beads in the nanofiber mat are likely to provide better interlocking between the fibers, leading to an overall stiffer material (higher E′).
 | ||
| Fig. 9 Dynamic mechanical analysis of GO–PI with GO contents of 0% (neat PI), 0.1%, 1.0% and 2.0% (by weight). | ||
The tanδ values of the composites with different contents of GO are shown in Table 2. The tanδ values of the composites showed a decrease at 0.1% GO content followed by an increase at 1% and 2% GO content. Similar trends have been found in the literature.28 The decrease in tanδ at 0.1% GO can be explained by the increased value of E′ upon addition of the GO. The increase in tanδ at higher GO contents could be the consequence of GO interrupting the connectivity of the polymer chains and facilitating chain slippage, leading to a higher loss modulus (E′′).23
| Sample | Tg (°C) | Storage modulus × 108 Pa | Tanδ |
|---|---|---|---|
| PI (neat) | 317 ± 3 | 1.4 ± 0.23 | 0.428 ± 0.05 |
| GO–PI (0.1%) | 319 ± 2 | 2.5 ± 0.21 | 0.395 ± 0.03 |
| GO–PI (1.0%) | 320 ± 2 | 2.8 ± 0.18 | 0.533 ± 0.06 |
| GO–PI (2.0%) | 323 ± 3 | 3.8 ± 0.24 | 0.510 ± 0.07 |
The electrical resistivity of GO–PI composites was measured for different contents of GO (Table 3 and Fig. S3†). In spite of the higher conductivity of graphene oxide as compared to PI, the composites with up to 2 wt% GO did not show a drastic increase in the electrical conductivity as compared to neat PI since the GO remains bunched up in the form of beads and isolated from other beads in the insulating PI nanofibers.29
| Samples | Resistance (Ω) | Volume resistivity (Ω m) | Conductivity (S m−1) |
|---|---|---|---|
| PI neat | 1.96 ± 0.023 × 10⁹ | 1.29 ± 0.01 × 10¹² | 7.74 ± 0.03 × 10⁻¹³ |
| GO–PI (0.1%) | 1.91 ± 0.15 × 10⁹ | 9.75 ± 0.80 × 10¹¹ | 1.23 ± 0.01 × 10⁻¹² |
| GO–PI (1.0%) | 1.90 ± 0.13 × 10⁹ | 9.72 ± 0.91 × 10¹¹ | 1.021 ± 0.15 × 10⁻¹² |
| GO–PI (2.0%) | 1.86 ± 0.37 × 10⁹ | 1.90 ± 0.31 × 10¹² | 6.26 ± 0.95 × 10⁻¹³ |
Conclusions
Graphene oxide–polyimide (GO–PI) nanofiber composite mats with up to 2 wt% of GO were made by electrospinning poly(amic acid) followed by thermal imidization. The presence of graphene oxide in the composites and the complete conversion of poly(amic acid) to polyimide was confirmed by Raman spectroscopy, XRD and FTIR. The graphene oxide formed bead or spindle-shaped structures in the nanofibers as observed by HRSEM and TEM. The composites showed a significant improvement in the storage modulus, glass transition temperatures and thermal stability with increasing graphene oxide content. The electrical resistance of the composites was found to be largely unaltered by the addition of up to 2 wt% GO to PI. Potential applications of these nanocomposites are being investigated.Acknowledgements
The authors thank Amrita Vishwa Vidyapeetham, Coimbatore and the Polymer Nanotechnology Centre, B. S. Abdur Rahman University, Chennai for providing a platform to carry out this research.Notes and references
- D. Chen, H. Zhu and T. Liu, ACS Appl. Mater. Interfaces, 2010, 2, 3702–3708 CAS.
- K. S. Yang, D. D. Edie, D. Y. Lim, Y. M. Kim and Y. O. Choi, Carbon, 2003, 41, 2039–2046 CrossRef CAS.
- I. D. Norris, M. M. Shaker, F. K. Ko and A. G. MacDiarmid, Synth. Met., 2000, 114, 109–114 CrossRef CAS.
- F. Yang, R. Murugan, S. Wang and S. Ramakrishna, Biomaterials, 2005, 26, 2603–2610 CrossRef CAS PubMed.
- K. Sawicka, P. Gouma and S. Simon, Sens. Actuators, B, 2005, 108, 585–588 CrossRef CAS PubMed.
- L. Chen, L. Bromberg, T. A. Hatton and G. C. Rutledge, Polymer, 2007, 48, 4675–4682 CrossRef CAS PubMed.
- G. Wu, Y. Tang and R. Weng, Polym. Degrad. Stab., 2010, 95, 1449–1455 CrossRef CAS PubMed.
- A. R. Hopkins, S. J. Tomczak, V. Vij and A. J. Jackson, Thin Solid Films, 2011, 520, 1617–1620 CrossRef CAS PubMed.
- S. Cheng, D. Shen, X. Zhu, X. Tian, D. Zhou and L. J. Fan, Eur. Polym. J., 2009, 45, 2767–2778 CrossRef CAS PubMed.
- Y. Lee, S. Bae, H. Jang, S. Jang, S. E. Zhu, S. H. Sim, Y. I. Song, B. H. Hong and J. H. Ahn, Nano Lett., 2010, 10, 490–493 CrossRef CAS PubMed.
- C. Wu, F. Li, Y. Zhang, T. Guo and T. Chen, Appl. Phys. Lett., 2011, 99, 042108 CrossRef PubMed.
- Y. L. Huang, A. Baji, H. W. Tien, Y. K. Yang, S. Y. Yang, C. C. M. Ma, H. Y. Liu, Y. W. Mai and N. H. Wang, Nanotechnology, 2011, 22, 475603 CrossRef PubMed.
- J. Longun and J. O. Iroh, Carbon, 2012, 50, 1823–1832 CrossRef CAS PubMed.
- W. S. Hummers and R. E. Offeman, J. Am. Chem. Soc., 1958, 80, 1339 CrossRef CAS.
- V. Eswaraiah, S. S. Jyothirmayee Aravind and S. Ramaprabhu, J. Mater. Chem., 2011, 21, 6800–6803 RSC.
- R. Yamuna, S. Ramakrishnan, K. Dhara, R. Devi, N. Kothurkar, E. Kirubha and P. K. Palanisamy, J. Nanopart. Res., 2013, 15, 1–9 CrossRef.
- P. Manivel, S. Ramakrishnan, N. K. Kothurkar, N. Ponpandian, D. Mangalaraj and C. Viswanathan, J. Exp. Nanosci., 2013, 8, 311–319 CrossRef CAS.
- A. Kaniyoor, T. T. Baby and S. Ramaprabhu, J. Mater. Chem., 2010, 20, 8467–8469 RSC.
- K. Zhang, L. L. Zhang, X. S. Zhao and J. Wu, Chem. Mater., 2010, 22, 1392–1401 CrossRef CAS.
- Y. Liu, J. Zhou, X. Zhang, Z. Liu, X. Wan, J. Tian, T. Wang and Y. Chen, Carbon, 2009, 47, 3113–3121 CrossRef CAS PubMed.
- N. Karousis, A. S. D. Sandanayaka, T. Hasobe, S. P. Economopoulos, E. Sarantopoulou and N. Tagmatarchis, J. Mater. Chem., 2011, 21, 109–117 RSC.
- J. I. Paredes, S. Villar-Rodil, A. MartiÌnez-Alonso and J. M. D. TascoÌn, Langmuir, 2008, 24, 10560–10564 CrossRef CAS PubMed.
- J. J. Mack, L. M. Viculis, A. Ali, R. Luoh, G. Yang, H. T. Hahn, F. K. Ko and R. B. Kaner, Adv. Mater., 2005, 17, 77–80 CrossRef CAS.
- N. T. Xuyen, E. J. Ra, H.-Z. Geng, K. K. Kim, K. H. An and Y. H. Lee, J. Phys. Chem. B, 2007, 111, 11350–11353 CrossRef CAS PubMed.
- F. Ko, Y. Gogotsi, A. Ali, N. Naguib, H. Ye, G. L. Yang, C. Li and P. Willis, Adv. Mater., 2003, 15, 1161–1165 CrossRef CAS.
- Q. Bao, H. Zhang, J. X. Yang, S. Wang, D. Y. Tang, R. Jose, S. Ramakrishna, C. T. Lim and K. P. Loh, Adv. Funct. Mater., 2010, 20, 782–791 CrossRef CAS.
- H. Fong, I. Chun and D. H. Reneker, Polymer, 1999, 40, 4585–4592 CrossRef CAS.
- D. Chen, R. Wang, W. W. Tjiu and T. Liu, Compos. Sci. Technol., 2011, 71, 1556–1562 CrossRef CAS PubMed.
- S. M. Yuen, C. C. M. Ma, Y. Y. Lin and H. C. Kuan, Compos. Sci. Technol., 2007, 67, 2564–2573 CrossRef CAS PubMed.
Footnote |
| † Electronic supplementary information (ESI) available. See DOI: 10.1039/c3ra46004e |
| This journal is © The Royal Society of Chemistry 2014 |