 Open Access Article
 This Open Access Article is licensed under a
 Creative Commons Attribution 3.0 Unported Licence
Revoking excited state intra-molecular hydrogen transfer by size dependent tailor-made hierarchically ordered nanocapsules
Mai Mouslmani and
Digambara Patra*
Department of Chemistry, American University of Beirut, Beirut, Lebanon. E-mail: dp03@aub.edu.lb; Fax: +961 1 365 217; Tel: +961 1 350 000 ext. 3985
First published on 28th November 2013
Abstract
Curcumin associated poly(allylamine hydrochloride) cross-links with dipotassium phosphate and subsequently is assembled with ∼24 nm SiO2 nanoparticles to form hierarchically ordered nanocapsule structures, which are 100–1000 nm in size depending on the concentration of dipotassium phosphate. These structures reverse the excited state intra-molecular hydrogen transfer in curcumin depending on the size of the nanocapsules.
Excited state hydrogen transfer has sparked the curiosity to understand the intrinsic mechanisms involved in chemical and biological processes.1–4 Excited State Intra-molecular Hydrogen Transfer (ESIHT) occurs on a unimolecular basis and serves as a model to mimic catalytic reactivity.5 ESIHT has been associated with medicinal properties.6 At the same time, in material research fluorescence switching of chromophores has drawn intense excitement because of its desirable physicochemical behaviour for sensing and imaging applications.7 Curcumin (CU)8 is proven to have antioxidant, anti-inflammatory, anti-cancer, anti-amyloid, anti-HIV, anti-microbial, etc. properties and its antioxidant mechanism has been linked with H-atom transfer.6 CU is found to exist in enolic form and undergoes ESIHT during the deactivation process.9–18 Thus, understanding ESIHT of CU sheds light on its medicinal values. Although normal (N*) and ESIHT (E*) forms can be simultaneously observed for many organic molecules in steady state spectra, no steady state emission spectrum from the normal form of CU (N*) has been simultaneously detected in solution or solid state, despite the indication of an ESIHT phenomenon in CU by ultra-fast time-resolved spectra and fluorescence up-conversion data,10–12 which is further supported by theoretical calculations.14–18
With the objective of revoking the ESIHT deactivation process of a model molecule, CU, we apply nanotechnology19–22 to prepare new materials which have unique optical properties that can be controlled with the size dependency of nanocapsules (NCs). Structurally well-defined architectures with dynamic and stimulus responsive properties have been designed and have been among important trials.23–29 CU was identified because of its (i) growing pharmaceutical relevance, (ii) use as a popular food spice and, (iii) exciting photophysical properties. Moreover, CU meets our present goal as the emission from only the E* form is detected and the emission from the N* form is completely masked/undetected in solution as shown in steady state fluorescence spectra. In this study, NCs were prepared by mixing 1.3 mL of 3 mg mL−1 poly(allylamine hydrochloride), PAH, with 0.5 mL of 1 mg mL−1 CU. The interaction of CU with PAH was found to be strong due to the electrostatic and hydrophobic interactions between them.
The self-assembly of the mixture was achieved by cross-linking the CU–PAH chains with 7.8 mL of 2.5 mM dipotassium phosphate in aqueous media at pH 4.4 for 30 minutes. Afterwards 7.8 mL of a 40 wt% suspension of ∼24 nm silica nanoparticles (SiO2 NPs) at pH ∼9.8 was added to this aggregated solution. It should be noted that the pH of the colloid solution increased to 9.5 while adding the silica sol. The cloudy solution was kept for 2 h. The solution was centrifuged and washed three times in deionized water and then dispersed in 3 mL of water for further characterization and investigation. Due to their overall net positive charge these aggregates of CU–PAH–dipotassium phosphate could assist the assembly of negatively charged silica nanoparticles, which then shape into hierarchically ordered nanocapsule structures19 as illustrated in Scheme 1. The SEM images, depicted in Fig. 1A, show that the NCs are spherical. The SEM image of the CU–PAH–dipotassium phosphate mixture, before silica nanoparticles were added, is shown in the inset of Fig. 1A, which suggests that smaller size spherical aggregates are formed before the silica nanoparticles are added. The particle size distribution of the nanocapsules was analyzed by a dynamic light scattering (DLS) method and was found to have an effective hydrodynamic radius (Rh) of 480 nm for 2.5 mM of dipotassium phosphate. The hydrodynamic diameter size distribution was found to be 0.2–1 μm. Increasing the concentration of dipotassium phosphate to 5 mM increased the Rh value to 610 nm, similarly decreasing the salt concentration to 10 μM produced NCs with a Rh of 133 nm (see Fig. 1B–E). However, the SEM images show that the NCs were found to be much smaller (Rh = ∼60 nm) at the low salt concentration. The high effective hydrodynamic radius is due to the further aggregation of smaller size NCs in solution. The increase in the concentration of dipotassium phosphate increases the negative charges of the salt per positive charge of PAH, which encourages the formation of larger aggregates, thus, increasing the size of the core as well as the hydrodynamic radius of the NC.20 Such an aggregation was also noticed when NCs were prepared in solution and dried on a carbon adhesive before taking the SEM images. The TEM image, Fig. 1F, of NCs confirms that the silica particles are at the surface and the material at the center is thinner. The thickness of silica was about 100–250 nm (Fig. 1G). The fluorescence image, Fig. 1H, indicates that the fluorescence is coming from all over the capsules suggesting that CU is present all over the capsules. As CU is strongly and ionically bound to PAH, we expect that CU will be present along with PAH. This result also established that NCs are core–shell structures instead of being hollow in nature.
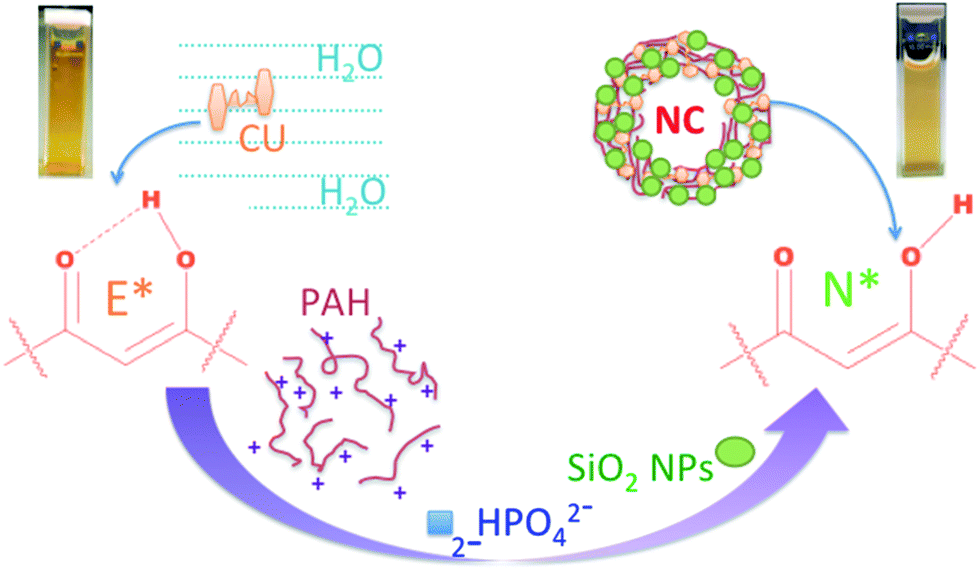 | ||
| Scheme 1 Illustration of CU interacting with PAH, dipotassium phosphate and SiO2 NPs to form NCs that revoke the ESIHT process of CU and introduce a normal emitting pathway. | ||
 | ||
| Fig. 1 (A) SEM images of NCs, the inset shows a SEM image of the CU–PAH–dipotassium phosphate mixture before SiO2 NPs were added; (B) plot of the hydrodynamic radius (Rh) vs. the concentration of dipotassium phosphate; (C)–(E) show the corresponding SEM images; (F) and (G) TEM images and (H) STED confocal fluorescence image of NCs. F–H show particles from the same batch. | ||
The absorption spectrum of the NCs was found to be similar to that of CU (see Fig. 2A), however, the S0 → S2 transition of CU at ∼266 nm was not well resolved in the NCs. The β-diketone moiety of CU exists entirely in enol form with a trans-geometry in both solid state30 and solution,8 thereby getting two feruloyl chromophores to interact with each other via a central sp2-hybridised carbon atom in a common conjugated π-system.31,32 The strong π(HOMO) → π(LUMO) transition of CU was found to be 426 nm in a buffer solution that masked the weak electronic dipole forbidden n → π band. This band is in agreement with the theoretically predicted value for CU in the enol form.14–18 Interestingly, the excitation spectrum of CU in the buffer solution shows two excitation wavelength bands at ∼368 nm and ∼445 nm (Fig. 2B), unlike the absorption spectrum, which clearly suggests that the absorbing and emitting species for CU are different. The first excited state of CU is highly polar due to the intramolecular charge transfer from the phenyl ring towards the carbonyl moiety9,31,32 and ESIHT is a major photophysical process in the deactivation of the excited state of CU.9–13 The absorption shoulder at ∼370 nm is due to the weakly allowed π(HOMO−1) → π(LUMO) transition and/or the virtually forbidden n → π(LUMO) transition.16 The emission spectrum obtained for CU in water, while having excitation bands at 355 nm, 427 nm and 450 nm, was similar with a maximum at ∼552 nm (for λex = 355 nm) and a maximum at 555 nm (for λex = 427 and 450 nm) without any emitting band at ∼450 nm for N*, thus, the variation in the excitation spectrum of CU is due to ESIHT, since an unusually longer wavelength emission of CU in solution has been found to be due to ESIHT.9–18 However, the excitation spectrum of NCs showed a completely different behavior compared to CU in water, despite the fact that both CU and NCs have a similar strong π(HOMO) → π(LUMO) transition absorption (Fig. 2A) at 427 nm. In the NCs, the excitation maximum was ∼50 nm blue shifted compared to the strong π(HOMO) → π(LUMO) transition absorption band, thus, the weakly allowed π(HOMO−1) → π(LUMO) transition and the virtually forbidden n → π(LUMO) transition play a vital role during the fluorescence process in NCs. The emission spectra for NCs at λex = 427 nm (Fig. 2C) and 450 nm were similar with a maximum centered at ∼540 nm, the ∼10 nm blue shift of emission maximum of NCs compared to CU in water at these excitation wavelengths is due to the change in local environment and solvent.9,33–35 However, the emission spectrum for NCs obtained at λex = 355 nm (Fig. 2D) is largely different with a maximum at ∼536 nm and an additional new peak at a lower wavelength. The deconvolution of this spectrum gave two separate emission spectra centered at ∼456 nm and ∼535 nm (see Fig. 3A). The additional peak observed is not due to the change in the solvent of the NCs but due to the fact that even at λex = 427 nm CU alone gives a much larger blue shift (∼80 nm) in a non-polar solvent environment,33 however, in the present case of λex = 427 nm, the blue shift in emission spectrum was only 15 nm for the NCs (Fig. 2C) instead of the ∼80 nm expected for a non-polar solvent environment. Therefore, a 10 nm shift (from 550 nm in water to 540 nm in NCs) at λex = 355 nm is due to the change in solvent for the NCs whereas the additional peak at ∼456 nm is due to other phenomena as explained subsequently.
 | ||
| Fig. 2 UV-Visible absorption spectra (A), fluorescence excitation spectra at λem = 427 nm (B), fluorescence emission spectra at λex = 427 nm (C), and fluorescence emission spectra at λex = 355 nm (D) for CU in buffer and NCs in water. | ||
 | ||
| Fig. 3 (A) Fluorescence emission spectrum of the NCs at λex = 355 nm along with deconvoluted spectra, the peak at ∼400 nm is due to scattering; (B) FT-IR spectra of CU, PAH and NC; (C) plot of N*/E* vs. Rh of NCs; (D) fluorescence lifetime decay profiles for CU and NCs at λex = 460 nm and λem = 560 nm, IRF is the instrument response function. | ||
In the steady state fluorescence spectrum in water or alcohol, the band at ∼456 nm was never resolved. However, using an ultrafast time resolved spectroscopic method the normal emission spectrum (N*) of CU in methanol at a 0 picosecond (ps) time scale has been resolved with a maximum at ∼460 nm, whereas the emission spectrum of the ESIHT (E*) form at more than 20 ps is centered at ∼555 nm and resembles the steady state fluorescence spectrum.10 It should be noted that there is no remarkable emission band at ∼465 nm for CU in methanol at λex = 355 nm (ref. 9) indicating that the weakly allowed π(HOMO−1) → π(LUMO) transition and the virtually forbidden n → π(LUMO) transition play insignificant roles during the steady state fluorescence process of CU in solution. Thus, the observed emission at ∼456 nm in NCs is because of the molecular deactivation without undergoing ESIHT. We further propose that the six membered ring path of the ESIHT deactivation process (see Scheme 2) is hindered due to the interaction of N+ of PAH with the O-atoms of the enol form of CU. FT-IR spectral data (Fig. 3B) further support our hypothesis. The phenolic O–H vibration of CU was observed at ∼3509 cm−1 and 3400 cm−1 whereas the peaks found in the range 3392–3033 cm−1 in PAH are associated with the N–H stretch. All these prominent peaks in the control samples were not visible in the NCs, instead a major peak was found at 3448 cm−1. Similarly a peak at 2972 cm−1 due to enolic O–H vibration could be detected in CU, but was not clear in the NCs. Further, the control peaks at 1627 cm−1 and 1603 cm−1 for CU are associated with the C![[double bond, length as m-dash]](https://www.rsc.org/images/entities/char_e001.gif) O and CC vibrations. The CO vibration has another peak at 1510 cm−1. On the other hand for PAH, the peaks at 1608 cm−1 and 1457 cm−1 are associated with the N–H asymmetric bending and C–H bending. In the NCs the only prominent peak was obtained at 1636 cm−1 in these regions, confirming strong interactions from –NH2 of PAH and enol of CU inside the NC.
O and CC vibrations. The CO vibration has another peak at 1510 cm−1. On the other hand for PAH, the peaks at 1608 cm−1 and 1457 cm−1 are associated with the N–H asymmetric bending and C–H bending. In the NCs the only prominent peak was obtained at 1636 cm−1 in these regions, confirming strong interactions from –NH2 of PAH and enol of CU inside the NC.
 | ||
| Scheme 2 Absorption and excited state deactivation processes of CU in water and NCs. | ||
The ratio of N*/E* was evaluated by measuring the fluorescence ratio at 460 nm (normal emission) and at 540 nm (ESIHT emission). N*/E* was found to be 0.25 for CU in water, which increased 3 fold in NCs. Further, N*/E* enhanced with the increase in NC size as shown in Fig. 3C. The maximum value was found for the NCs having the largest size and N*/E* could be linearly correlated with the hydrodynamic radius of the NCs. The fluorescence lifetime at λex = 460 nm and λem = 560 nm for CU in buffer could be best fitted with a biexponential decay giving a short component lifetime (τ1) of ∼62 ps (99%) and a long component lifetime (τ2) of 3.1 ns (1%). The biexponential decay for NCs at these excitation and emission wavelengths provided τ1 = ∼242 ps (80%) and τ2 = 1.90 ns (20%) when Rh = 133 nm. The decay profiles are shown in Fig. 3D. The increase in the size of NCs decreased τ1 to 178 ps (85%) but increased τ2 to 3.00 ns (15%) when Rh = 610 nm. The decrease in τ2 correlated with the increase in the size of NCs, thus, could be rationalised with the decrease in the ESIHT process in the NCs. However, while exciting at 373 nm the biexponential decay of CU in buffer at emission 460 nm (for N*) gave τ1 = 0.35 ns (90%) and τ2 = 3.9 ns (10%) whereas the emission at 560 nm (for E*) gave τ1 = 0.33 ns (90%) and τ2 = ∼1.0 ns (10%). This emission wavelength dependency of CU is not surprising as a similar dependency in ethanol is known.36 At λex = 373 nm and λem = 460 nm, the τ1 value dramatically improved to 0.40 ns in NCs and later on to 0.60 ns with the increase in Rh of NCs, therefore, the increase in τ1 could be logically related to the emission of N*.
In summary, CU in the presence of PAH and dipotassium phosphate directly assembles with silica nanoparticles into spherical NCs in the size range of 100–1000 nm. The size of the NCs was tailored by varying salt concentration and the fluorescence was switched to understand the intrinsic mechanisms in chemical and biological processes. For example, revoking the ESIHT process of CU inside the NCs opens up a new emitting deactivation pathway that was never observed in water, thus, applying nanotechnology, optical behaviour could be tuned by tailor-made capsules for multiple applications in electronics, sensing and biomedical uses. At the same time the ESIHT phenomenon may help to understand the key fundamental questions of various H-atom transfer pathways of medicinally important and water insoluble drug molecules, like CU, while using various capsules as a drug delivery system.
Acknowledgements
The financial support from the Lebanese National Council of Scientific Research (LNCSR) and American University of Beirut through URB and the long term faculty development grant are acknowledged.Notes and references
- T. Elsässer and H. J. Bakker, Ultrafast hydrogen bonding dynamics and proton transfer processes in the condensed phase, Kluwer Academic Publishers, Dordrecht, Boston, 2002 Search PubMed.
- T. J. Meyer, M. H. V. Huynh and H. H. Thorp, Angew. Chem., Int. Ed., 2007, 46, 5284 CrossRef CAS PubMed.
- S. Hammes-Schiffer, Chem. Rev., 2010, 110, 6937 CrossRef CAS PubMed.
- U. Pischel, D. Patra, A. L. Koner and W. M. Nau, Photochem. Photobiol., 2006, 82(1), 310 CrossRef CAS PubMed.
- A. P. Demchenko, K.-C. Tang and P.-T. Chou, Chem. Soc. Rev., 2013, 42, 1379 RSC.
- S. V. Jovanovic, S. Steenken, C. W. Boone and M. G. Simic, J. Am. Chem. Soc., 1999, 121, 9677 CrossRef CAS.
- C. Yun, J. You, J. Kim, J. Huh and E. Kim, J. Photochem. Photobiol., C, 2009, 10, 111 CrossRef CAS PubMed.
- M. M. Yallapu, M. Jaggi and S. C. Chauhan, Drug Discovery Today, 2012, 17, 71 CrossRef CAS PubMed.
- S. M. Khopde, K. I. Priyadarsini, D. K. Palit and T. Mukherjee, Photochem. Photobiol., 2000, 72, 625 CrossRef CAS.
- R. Adhikari, P. Mukeerjee, T. W. Kee and J. W. Petrich, J. Phys. Chem. B, 2009, 113, 5255 CrossRef PubMed.
- R. Adhikary, P. J. Carlson, T. W. Kee and J. W. Petrich, J. Phys. Chem. B, 2010, 114, 2997 CrossRef CAS PubMed.
- T. W. Kee, R. Adhikary, P. J. Carlson, P. Mukherjee and J. W. Petrich, Aust. J. Chem., 2011, 64, 23 CrossRef CAS.
- I. Presiado, Y. Erez, R. Gepshtein, N. Koifman and D. Huppert, J. Photochem. Photobiol., A, 2012, 247, 42 CrossRef CAS PubMed.
- L. Kong, K. I. Priyadarsini and H.-Y. Zhang, J. Mol. Struct., 2004, 684, 111 CrossRef CAS PubMed.
- C. R. Baiz and B. D. Dunietz, J. Phys. Chem. A, 2007, 111, 10139 CrossRef CAS PubMed.
- V. Galasso, B. Kovač, A. Modelli, M. F. Ottaviani and F. Pichierri, J. Phys. Chem. A, 2008, 112, 2331 CrossRef CAS PubMed.
- L. Shen, H.-Y. Zhang and H.-F. Ji, Org. Lett., 2005, 7, 243 CrossRef CAS PubMed.
- L. Shen and H.-F. Ji, Spectrochim. Acta, Part A, 2007, 67, 619 CrossRef PubMed.
- D. Patra, A. J. Amali and R. K. Rana, J. Mater. Chem., 2009, 19, 4017 RSC.
- R. K. Rana, V. S. Murthy, J. Yu and M. S. Wong, Adv. Mater., 2005, 17, 1145 CrossRef CAS.
- A. J. Amali, N. H. Awwad, R. K. Rana and D. Patra, Anal. Chim. Acta, 2011, 708, 75 CrossRef CAS PubMed.
- D. Patra, R. Aridi and K. Bouhadir, Microchim. Acta, 2013, 180, 59 CrossRef CAS.
- J. N. Anker, W. P. Hall, O. Lyandres, N. C. Shah, J. Zhao and R. P. Van Duyne, Nat. Mater., 2008, 7, 442 CrossRef CAS PubMed.
- S. Nayak and L. A. Lyon, Angew. Chem., Int. Ed., 2004, 43, 6706 CrossRef CAS PubMed.
- R. C. Bailey, J. M. Nam, C. A. Mirkin and J. T. Hupp, J. Am. Chem. Soc., 2003, 125, 13541 CrossRef CAS PubMed.
- P. M. Mendes, Chem. Soc. Rev., 2008, 37, 2512 RSC.
- Z. S. Liu and P. Calvert, Adv. Mater., 2000, 12, 288 CrossRef CAS.
- D. Roy, J. N. Cambre and B. S. Sumerlin, Chem. Commun., 2009, 2106 RSC.
- K. S. Soppimath, D. C. W. Tan and Y. Y. Yang, Adv. Mater., 2005, 17, 318 CrossRef CAS.
- H. H. Tonnesen, J. Karlsen and A. Mostad, Acta Chem. Scand., Ser. B, 1982, 36, 475 CrossRef PubMed.
- P. H. Bong, Bull. Korean Chem. Soc., 2000, 21, 81 CAS.
- F. Zsila, Z. Bikádi and M. Simonyi, Tetrahedron: Asymmetry, 2003, 14, 2433 CrossRef CAS.
- D. Patra and C. Barakat, Spectrochim. Acta, Part A, 2011, 79, 1034 CrossRef CAS PubMed.
- D. Patra, E. E. Khoury, D. Ahmadieh, S. Darwish and R. M. Tafech, Photochem. Photobiol., 2012, 88, 317 CrossRef CAS PubMed.
- D. Patra, C. Barakat and R. M. Tafech, Colloids Surf., B, 2012, 94, 354 CrossRef CAS PubMed.
- Y. Erez, I. Presiado, R. Gepshtein and D. Huppert, J. Phys. Chem. A, 2011, 115, 10962 CrossRef CAS PubMed.
| This journal is © The Royal Society of Chemistry 2014 |