A novel benzoxazine/epoxy blend with multiphase structure†
Pei
Zhao
,
Qian
Zhou
,
Yuyuan
Deng
,
Rongqi
Zhu
and
Yi
Gu
*
College of Polymer Sciences and Engineering, State Key Laboratory of Polymer Materials Engineering, Sichuan University, Chengdu, China. E-mail: guyi@scu.edu.cn; Fax: +86-28-85405138; Tel: +86-28-85400377
First published on 5th November 2013
Abstract
A novel benzoxazine (BOZ)/epoxy resin (ER) blend with multiphase structure was successfully prepared under the catalysis of imidazole (MZ) via reaction-induced phase separation. The toughness and thermal properties of the novel blend were greatly improved compared with the homogeneous PBOZ and PBOZ/ER systems.
Introduction
Due to their prominent processability and excellent thermal and mechanical properties, epoxy (ER) modified benzoxazine (BOZ) blending systems have attracted more and more attention in a wide range of application areas, including adhesives, filler-reinforced composite materials, and coatings for electronic circuits.1–4 However, because of the highly crosslinked structures, BOZ/ER blending systems are brittle materials that show unsatisfied toughness and elongation at break. Therefore, effective toughening strategies are of high interest to enable powerful new applications.Of various toughing methods, reaction induced phase separation (RIPS), which is designed as the uniform precursor system undergoing a phase separation into a two separated phase structures during the development of the curing process, is the most effective one.5,6 This method can enhance the fracture toughness of material notably without sacrificing its desirable properties (e.g. glass transition temperatures (Tg) and modulus), therefore has been widely used in the toughening modification of thermosetting (TS) resin with thermoplastic (TP) resin, such as poly (ether imide)- or ploy (ether sulfones)-modified ER, BOZ, cyanate ester, and bismaleimide resins.7–14
Although the RIPS method is very effective, it is not easy to be realized in BOZ/ER blending system. According to the Gibbs free energy theory (ΔG = ΔH − TΔS – W, where, ΔG represents the free energy of mixing; ΔH represents the enthalpy of mixing which can be characterized by Flory–Huggins interaction parameter χ; ΔS represents the entropy of mixing; and W represents the specific interactions between the components),5,15,16 there are at least three factors that make it much more difficult to get phase separation structures in BOZ/ER blends than in the reported RIPS systems.7–14 Firstly, the χ value for most of BOZ/epoxy blends is low estimated according to the Flory–Huggins theory and Hildebrand formula.15,17,18 Secondly, the two components are initial dynamic symmetry (e.g. similar low molecular weight), so the contribution of ΔS to ΔG is huge. Thirdly, both components can react with each other and tend to form three dimensional networks. As a result, the mutual entanglement of polymer chains and the copolymerization between the two components always lead to the formation of permanent interlocked structures with the curing process.19,20 Therefore, it remains a challenge to obtain micro-sized phase separation structures in BOZ/ER blends.
In our previous reports,16 we studied the possible polymerizations existed in BOZ/ER blends via model compounds and concluded that if the ER molecular could preferentially polymerize to high molecular weight (4370 g mol−1) before the polymerization of BOZ resin, phase separation could occur, and decreasing the content of ER is beneficial to get extensive phase separation. What's more, Wang et al. studied the curing reaction of BOZ/ER/imidazole blends and found that the preferential polymerization of ER resin in BOZ/ER blends is possible under the catalysis of imidazole.21
Following these studies, here we designed and successfully prepared a novel BOZ/ER blend with multiphase structure under the catalysis of imidazole (MZ). The curing sequence, phase morphology, and the finial impact strengths and thermal properties of BOZ/ER/MZ blend were investigated.
Experimental
Materials
Aromatic diamine-phenol-based benzoxazine (BOZ) resin based on 4,4′-diaminodiphenyl methane (DDM), phenol and paraformaldehyde was synthesized and characterized as previous reports.22 Diglycidyl ether of bisphenol-A epoxy resin (ER) was provided by Shanghai synthetic resin factory (China) and has an epoxy equivalent of 227–246 g eq.−1. The chemical structures of BOZ and ER were shown in Scheme 1.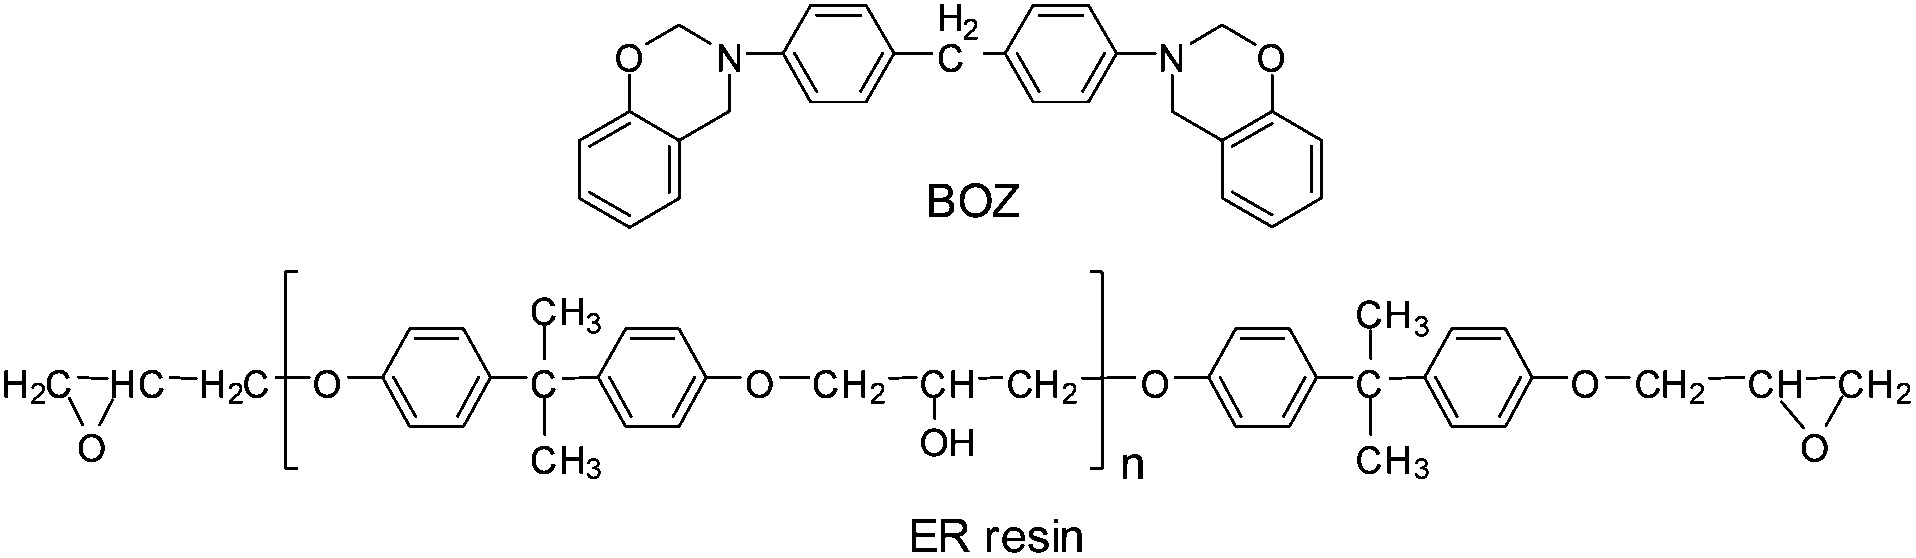 | ||
| Scheme 1 Chemical structures of BOZ and ER. | ||
Phenol, DDM, paraformaldehyde, tetrahydrofuran (THF), imidazole (MZ, Tm = 90 °C) were purchased commercially from Chengdu Kelong Chemical Reagents Corp. (China) and used as received.
Preparation of the blends
The blend of BOZ/ER/MZ was prepared by mixing BOZ and ER resin (mass ratio: 90/10) at 110 °C for 20 min, and when the mixture was cooled to 95 °C, MZ (8 wt% with respect to the content of ER) was added, and the mixture was stirred vigorously for 2 min until MZ completely dissolved. The sample was degassed under vacuum for another few minutes afterward and then refrigerated (−18 °C) to avoid any further curing reaction. Samples for BOZ/ER, BOZ/MZ and ER/MZ were prepared by the same way for comparison.All the samples for property measurements were prepared by casting their blends into a metal mould, and curing with a profile as following: 110 °C/15 h, 150 °C/2 h, 180 °C/2 h, 200 °C/2 h.
Measurement
The turbidity of the blending system was investigated by placing the badge of Sichuan University at the bottom of the reaction mould. The pictures that reflected systemic states at specific curing stage were recorded with a camera.The phase morphology of the blend was investigated by field emission scanning electron microscope (SEM) FEI Inspect F. Samples for SEM measurement were fractured under liquid nitrogen, and etched with THF at room temperature for 2 min. The fractured surfaces were dried at room temperate under vacuum and then coated with gold before SEM observation.
The component of each rich phase was investigated by Fourier transform-infrared spectroscopy (FTIR) and ATR-FTIR measurements which were performed on a Nicolet 5700 FTIR spectrometer. Sample for FTIR was prepared by casting THF solutions onto potassium bromide window at room temperature. All of the spectra were obtained at a resolution of 4 cm−1 and the average of 32 scans.
The curing sequence of BOZ and ER in BOZ/ER/MZ blend was investigated by differential scanning calorimetry (DSC, TA Q20). The non-isothermal scans were conducted with the heating rate of 10 °C min−1 from room temperature to 350 °C (Fig. S1-A†). The isothermal scans for BOZ with 3 wt% of MZ and ER with 3 wt% of MZ were conducted at 110 °C to obtained conversion–time curves (Fig. S1-B†). The conversion, α, was calculated as α = Ht/Hp, where Ht was the enthalpy within time t, Hp was the total enthalpy obtained by non-isothermal scanning. All DSC tests were under a nitrogen flow rate of 50 mL min−1.
The viscoelastic properties of the finial systems were investigated by dynamic mechanical analyzer (DMA, TA Q800) with sample dimension of 30 × 10 × 3 mm3 (length × width × thickness) in three point bend mode from 40 to 300 °C with a heating rate of 5 °C min−1 and frequency of 1 Hz.
Thermo gravimetric analysis (TGA) were performed on a NETZSCH Instruments (TG 209 F1 Iris) with a heating rate of 10 °C min−1 under nitrogen flow (100 mL min−1) from 30 °C to 800 °C.
Un-notched charpy impacted strength tests were carried out using a pendulum-type testing machine (XJJD-5, Jinjian, China) in accordance with GB/T2571-1995. The dimension of sample was 80 × 10 × 4 mm3. Five specimens were tested to obtain an average. The test was performed with a pendulum of 2 J with a velocity of 2.9 m s−1.
Result and discussion
Phase separation and morphology
Before the curing reaction, both BOZ/ER and BOZ/ER/MZ blends were miscible and presented a transparent yellow color. After curing at 110 °C for 15 h (Fig. 1), the visual appearance of PBOZ/ER blend was still transparent (a), while that of PBOZ/ER/MZ blend became opaque (b), implying the existence of heterogeneous morphologies in PBOZ/ER/MZ blend. To further prove the phase separation structures, the fractured surface of PBOZ/ER/MZ blend was etched with THF and investigated by SEM. Different with PBOZ/ER blend, in which the morphology was smooth and homogeneous (Fig. 1A), clearly heterogeneous morphology where irregular spherical domains (1–2 μm) dispersed in the matrix was observed in PBOZ/ER/MZ blend (Fig. 1B). Continue the curing process to the end, the visual appearance state of PBOZ/ER/MZ blend nearly had no change, which indirectly proved the retaining of the multiphase structures.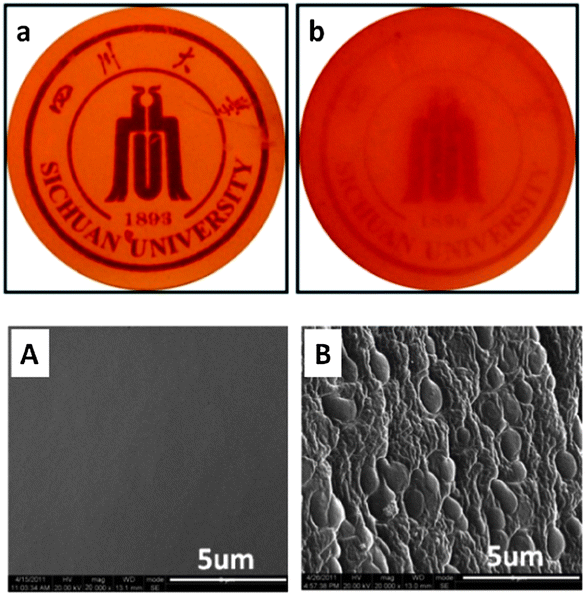 | ||
| Fig. 1 Transparency (upper) and SEM morphology (lower) of PBOZ/ER blend (a and A) and PBOZ/ER/MZ blend (b and B) after curing at 110 °C for 15 h. | ||
Composition of each phase
After etching with THF for 12 h, the half cured PBOZ/ER/MZ bulk gradually decomposed into a large amount of white insoluble floccules (Fig. S2†). This phenomenon implies that the matrix (continuous phase) of PBOZ/ER/MZ is soluble in THF, while the dispersed phase cannot dissolve in THF at the phase separation point. In order to distinguish the component of each rich phase, THF-soluble part (Fig. 2b) and THF-insoluble part (Fig. 2c) were run FTIR and ATR-FTIR scanning, respectively. Meanwhile, the FTIR spectrum of original BOZ/ER/MZ blend was shown in Fig. 2a for comparison.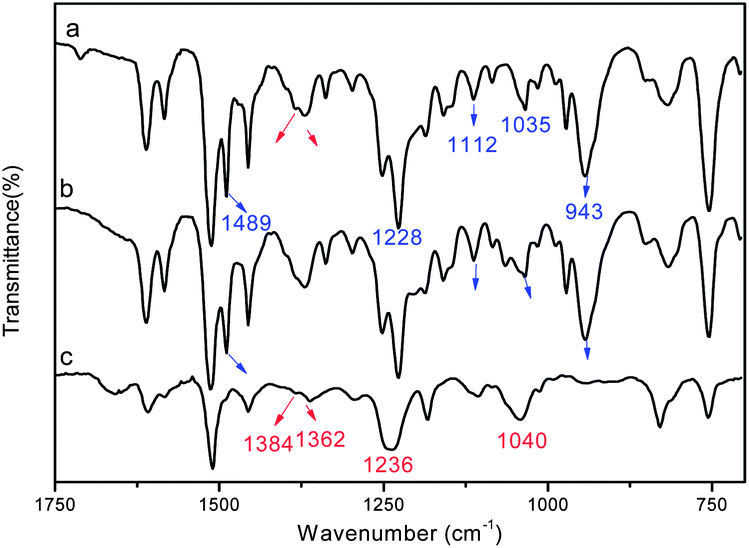 | ||
| Fig. 2 FTIR spectra of BOZ/ER/MZ blend (a), and the THF-soluble part (b) and THF-insoluble part (c) of BOZ/ER/MZ blend after curing at 110 °C for 15 h and etching with THF for 24 h. | ||
As shown in Fig. 2a, the characteristic absorption bands of BOZ resin at 943 cm−1 (oxazine ring), 1035 cm−1 (νs,C–O–C), 1228 cm−1 (νas,C–O–C), 1112 cm−1 (νas,C–N–C) and 1489 cm−1 (1,2-disubstituted benzene) were observed, which covered the characteristic absorption bands of ER resin at 912 cm−1 (epoxy group), 1041 cm−1 (νs,C–O–C) and 1236 cm−1 (νas,C–O–C). In Fig. 2b, all of the characteristic peaks of BOZ monomer were found, indicating that the main component of THF-soluble part was unpolymerized BOZ resin. While in Fig. 2c, the disappearance of the peaks of BOZ resin at 943 cm−1 and 1489 cm−1, and the observation of absorption bands of ER resin at 1384 cm−1 and 1362 cm−1 (δC–H of isopropyl structures), 1041 cm−1 and 1236 cm−1 indicated that the main component of THF-insoluble part was ER resin. The absence of characteristic absorption band of epoxy group at 912 cm−1 revealed the complete polymerization of ER resin. Therefore, it could be concluded that the dispersed domain was ER-rich phase, and the matrix was BOZ-rich phase.
Curing behavior
DSC measurement was used to investigate the curing sequence of BOZ and ER in BOZ/ER/MZ blend at 110 °C, and the results were shown in Fig. 3. Unlike the DSC curves of BOZ/ER blend which only has a single exothermal peak at 247 °C (Fig. 3A-a), there are three peaks in BOZ/ER/MZ blend: the first exothermal peak has an onset at 110 °C with a maximum at 164 °C; the second one with a maximum at 205 °C; the third one with a maximum at 241 °C (Fig. 3A-b). After curing at 110 °C for 15 h, the first peak disappeared, but the other two peaks did not show much change (Fig. 3A-c). According to our previous report21 and the above FTIR results, it can be inferred that the first exothermic peak should correspond to the reaction of ER with MZ, while the other two peaks should correspond to the reaction of BOZ. This inference was further confirmed by the conversion–time curves at 110 °C. As shown in Fig. 3(B), with the same MZ content, the conversion of ER is nearly 85%, while that of BOZ is less than 10% after curing at 110 °C for 30 min. The above results indicate that the curing reaction of ER resin occurs preferentially, which may drive the phase separation in BOZ/ER/MZ blend.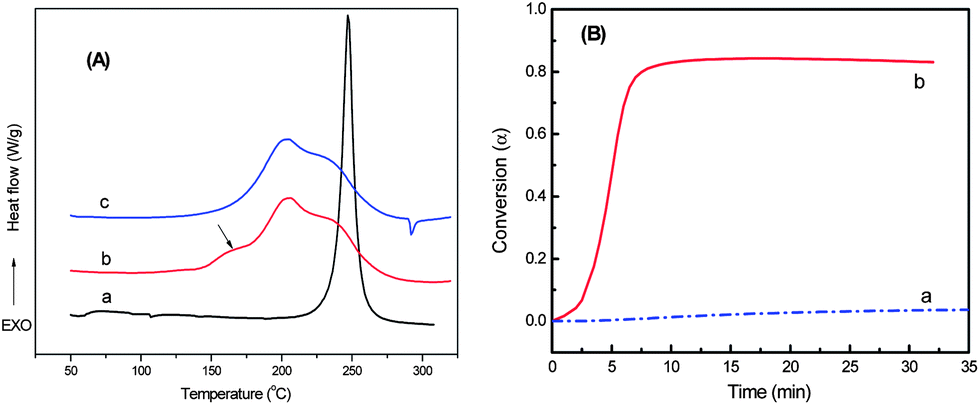 | ||
| Fig. 3 (A) DSC curves of BOZ/ER (a) and BOZ/ER/MZ blend before (b) and after (c) curing at 110 °C for 15 h. (B) Conversion–time curves at 110 °C: (a) BOZ with 3 wt% of MZ; (b) ER with 3 wt% of MZ. | ||
Formation of multiphase structure
Due to the complexity of the ternary blending system, phase separation and phase morphology may be influenced by a lot of factors, such as the composition ratios, temperatures, the competition between the kinetics of phase separation and crosslink chemical reaction,14,23 the solubility and diffusibility of the catalyst,24,25 vitrification or chemical gelation, et al.15 According to the Gibbs free energy theory and our present results, the formation of multiphase structures in the BOZ/ER/MZ blend can be explained as follows: at the early stage of curing (110 °C), most of ER took part in the polymerization and formed high molecular weight polymers, while only a small amount of BOZ was polymerized, and the rest of them were still in the state of low molecular weight. The preferential polymerization of ER not only reduced the possibility of copolymerization between BOZ and ER, but also increased the dynamic asymmetry (difference of molecular weight, viscosity, etc.) between ER and BOZ in situ. What's more, the increase of molecular weight owing to the polymerization of ER resin resulted in the significant decrease of ΔS, which pushed the increase of ΔG (when ΔG > 0, phase separation occurred). During this process, the ΔH mainly associated with chemical structures was almost unchanged. Hence the compatibility of ER–polymers with the surrounding BOZ resins decreased. Then due to the viscoelastic property of polymer, ER polymers tended to shrink to exclude the entrapped BOZ molecules, which led to the formation of micro-sized sea-island structure. As the curing reaction going on, phase separation was gradually suppressed and the phase morphology was fixed due to the vitrification or chemical gelation.Thermal and mechanical properties
The viscoelastic properties of PBOZ, PBOZ/ER and PBOZ/ER/MZ blends were examined by DMA. Unlike the reported phase separation systems,10,26,27 which have two relaxation peaks in the tan![[thin space (1/6-em)]](https://www.rsc.org/images/entities/char_2009.gif) δ or loss modulus curves, the heterogeneous PBOZ/ER/MZ system has only one relaxation peak (Fig. S3-A†). This may be explained by the similar Tg values of PBOZ and poly–ER. The results of the Tg and the storage modulus (E′) were summarized in Table 1. The Tg of PBOZ/ER/MZ blend was 228.9 °C, which increased by 16.5 °C and 15.2 °C, comparing with the Tg of PBOZ and PBOZ/ER blend, respectively. The modulus of PBOZ/ER/MZ system has a little bit decrease comparing with that of PBOZ, but still kept in a relatively high level.
δ or loss modulus curves, the heterogeneous PBOZ/ER/MZ system has only one relaxation peak (Fig. S3-A†). This may be explained by the similar Tg values of PBOZ and poly–ER. The results of the Tg and the storage modulus (E′) were summarized in Table 1. The Tg of PBOZ/ER/MZ blend was 228.9 °C, which increased by 16.5 °C and 15.2 °C, comparing with the Tg of PBOZ and PBOZ/ER blend, respectively. The modulus of PBOZ/ER/MZ system has a little bit decrease comparing with that of PBOZ, but still kept in a relatively high level.
| System | T g a (°C) | E′b (GPa) | T onset c (°C) | T peak d (°C) | Impact strength (KJ m−2) |
|---|---|---|---|---|---|
|
a Peak temperature of tanδ.
b Storage modulus at 50 °C.
c Temperature at the onset of decomposition.
d Temperature at the peak mass loss rate.
|
|||||
| PBOZ | 212.4 | 4.7 | 341.9 | 392.5 | 17.3 |
| PBOZ/ER | 213.7 | 4.1 | 338.9 | 391.8 | 23.7 |
| PBOZ/ER/MZ | 228.9 | 4.3 | 336.2 | 392.1 | 33.8 |
The thermal stability of PBOZ, PBOZ/ER and PBOZ/ER/MZ systems were investigated by TGA, and the results were shown in Fig. S3-B† and Table 1. For the onset temperature of the decomposition (Tonset, 5% mass fraction loss) and the temperature at the peak mass loss rate (Tpeak), there are nearly no significant difference between these systems, which indicated that the novel PBOZ/ER/MZ system retained the good thermal stability of PBOZ.
Finally, the impact strength of PBOZ, PBOZ/ER and PBOZ/ER/MZ blend was measured separately. As shown in Table 1, the impact strength of PBOZ/ER blend increased by 37.0% compared with that of PBOZ. However, PBOZ/ER/MZ blend with sea-island phase structure showed even higher impact strength, which increased by 95.4% compared with PBOZ. The increase of material toughness may be caused by the formation of multiphase structure which can change the direction of crack propagation and absorb more energy in the blend.28
Conclusions
A novel PBOZ/ER blend with sea-island micro-phase structure, where ER formed dispersed phase and BOZ formed the continuous phase, was prepared under the catalysis of MZ. The thermal and impact strength of the phase separated blend greatly improved compared with those of homogeneous PBOZ and PBOZ/ER blend.Acknowledgements
Supports for this project were provided by the National Natural Science Foundation of China (Project no. 50873062) and Doctoral Fund of Ministry of Education of China (Project no. 20090181110030).Notes and references
- C. Jubsilp, T. Takeichi and S. Rimdusit, in Handbook of Benzoxazine Resins, ed. H. Ishida and T. Agag, Elsevier, Amsterdam, 1nd edn, 2011, ch. 7, pp. 169–172 Search PubMed.
- H. Ishida and S. Rimdusit, US Pat., 6 207 786 B1, 2001.
- S. Rimdusit and H. Ishida, Polymer, 2000, 41, 7941 CrossRef CAS.
- S. Tragoonwichian, N. Yanumet and H. Ishida, J. Appl. Polym. Sci., 2007, 106, 2925 CrossRef CAS.
- R. J. J. Williams, B. A. Rozenberg and J. P. Pascault, Adv. Polym. Sci., 1997, 128, 95 CrossRef CAS.
- T. Inoue, Prog. Polym. Sci., 1995, 20, 119 CrossRef CAS.
- J. B. Cho, J. W. Hwang, K. Cho, J. H. An and C. E. Park, Polymer, 1993, 34, 4832 CrossRef CAS.
- Y. S. Kim and S. C. Kim, Macromolecules, 1999, 32, 2334 CrossRef CAS.
- H. Lv and S. Zheng, Polymer, 2003, 44, 4689 CrossRef.
- P. Zhao, X. Liang, J. Chen, Q. Ran and Y. Gu, J. Appl. Polym. Sci., 2013, 128, 2865 CrossRef CAS.
- X. Liu, Y. Yu and S. Li, Eur. Polym. J., 2006, 42, 835 CrossRef CAS PubMed.
- W. J. Gan, Y. F. Yu, M. H. Wang, Q. S. Tao and S. J. Li, Macromol. Rapid Commun., 2003, 24, 952 CrossRef CAS.
- E. Girard-Reydet, H. Sautereau, J. P. Pascault, P. Keates, P. Navard, G. Thollet and G. Vigier, Polymer, 1998, 39, 2269 CrossRef CAS.
- Y. Yu, M. Wang, W. Gan, Q. Tao and S. Li, J. Phys. Chem. B, 2004, 108, 620 CrossRef.
- L. A. Utracki, in Polymer blends handbook, Kluwer Academic Publishers, Netherlands, 2002, vol. 1, ch. 2, pp. 123–194 Search PubMed.
- P. C. Painter, Y. Park and M. Coleman, Macromoleculars, 1988, 21, 66 CrossRef CAS.
- P. J. Flory, in Principles of Polymer Chemistry, Cornell University Press, New York, 1nd edn, 1953, ch. 12, pp. 495–540 Search PubMed.
- P. A. Small, J. Appl. Chem., 1953, 3, 71 CrossRef CAS.
- H. Ishida and D. J. Allen, Polymer, 1996, 37, 4487 CrossRef CAS.
- P. Zhao, Q. Zhou, X. Liu, R. Zhu, Q. Ran and Y. Gu, Polym. J., 2013, 45, 637 CrossRef CAS.
- H. Wang, P. Zhao, H. Ling, Q. Ran and Y. Gu, J. Appl. Polym. Sci., 2013, 127, 2169 CrossRef CAS.
- H. Xiang, H. Ling, J. Wang, L. Song and Y. Gu, Polym. Compos., 2005, 26, 563 CrossRef CAS.
- Q. Tao, W. Gan, Y. Yu, M. Wang, X. Tang and S. Li, Polymer, 2004, 45, 3505 CrossRef CAS PubMed.
- U. Müller, M. Philipp, J. C. Gaukler, W. Possart, R. Sanctuary and J. K. Krüger, J. Adhes., 2012, 88, 253 CrossRef.
- M. Philipp, U. Müller, R. Sanctuary, J. Kieffer, W. Possart and J. K. Krüger, Soft Matter, 2011, 7, 118 RSC.
- A. Bonnet, B. Lestriez, J. P. Pascault and H. Sautereau, J. Polym. Sci., Part A: Polym. Chem., 2001, 39, 363 CrossRef CAS.
- C. B. Bucknall and A. H. Gilbert, Polymer, 1989, 30, 213 CrossRef CAS.
- B. Wetzel, P. Rosso, F. Haupert and K. Friedrich, Eng. Fract. Mech., 2006, 73, 2375 CrossRef PubMed.
Footnote |
| † Electronic supplementary information (ESI) available: The pictures of BOZ/ER/MZ blend cured at 110 °C for 15 h before and after etching with THF; the non-isothermal and isothermal DSC curves for BOZ/MZ and ER/MZ blends; DMA and TGA curves of PBOZ, PBOZ/ER and PBOZ/ER/MZ blends. See DOI: 10.1039/c3ra44738c |
| This journal is © The Royal Society of Chemistry 2014 |