The stability of insulin in the presence of short alkyl chain imidazolium-based ionic liquids

Awanish Kumar and Pannuru Venkatesu*
Department of Chemistry, University of Delhi, Delhi-110 007, India. E-mail: venkatesup@hotmail.com; pvenkatesu@chemistry.du.ac.in; Fax: +91-11-2766 6605; Tel: +91-11-27666646-142

Received 19th August 2013 , Accepted 5th November 2013

First published on 6th November 2013


Abstract

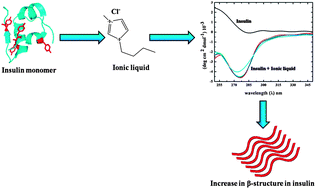
Fibril or aggregation formation in insulin (In) has been a subject of severe biomedical and biotechnological complications. The search for a novel solvent/co-solvent that can provide long term stabilization for In monomeric form has not been completed yet. In this quest, for the first time we have successfully explored the stability of the monomeric form of In in the presence of ammonium-based ionic liquids (ILs) [A. Kumar and P. Venkatesu, RSC Adv., 2013, 3, 362–367]. Further, in continuation, in this study, we have established the stability of In in the presence of imidazolium-based ILs with different anions. These anions represent the Hofmeister series of anions of ILs. In this regard, we have carried out UV-vis, fluorescence, circular dichroism spectral analysis and dynamic light scattering (DLS) measurements of In in various concentrations of these ILs. Our experimental findings reveal that Br and Cl ILs stabilized the native state while the rest of the ILs with anions such as SCN, HSO4, CH3COO and I were denaturants for the In. Further, the results show that IL–In interactions are difficult to classify on the basis of the Hofmeister series, as bromide containing ILs show more stabilizing properties on the In structure. The disulfide bonds were almost intact in the presence of Br IL as compared to Cl and the rest of the Hofmeister anions. On the other hand, a strongly hydrated kosmotropic anion like HSO4 interacts with the structure of In, leading it towards complete denaturation of the In structure. Additionally, all ILs failed to protect the native state of In with increasing temperature.

1. Introduction

The specificity and precision of protein stability has fascinated chemists and biologists from the very beginning of modern biochemistry or protein science, and is one of the most rapidly advancing fields at the present time. The quantitative description of the thermodynamic forces that govern the formation of biomolecular complexes is a part of this endeavor. Virtually, the net stability of a protein is defined as the difference in the free energy (ΔG) of the native (folded) and denatured (unfolded) states which are in equilibrium with each other.1,2 It is a well-known fact that even a marginal change in the natural environment (pressure, temperature, co-solvent effects, etc.) around the protein may cause adverse effects in its properties finally leading it to a denatured state.3 These environmental stresses trigger the alternative folding pathway for amyloidogenic proteins, leading to partial unfolding of proteins followed by the formation of amyloid fibrils having a cross β-sheet structure.4,5 These misfolded or partly unfolded globular proteins often form aggregates (amyloids or fibrils) slowly and are essentially irreversible. Diseases such as Alzheimer's, Creutzfeldt–Jacob, prion disease, etc. are associated with deposition of fibrillar protein aggregates in various organs.6

In this context, researchers have widely considered insulin (In) as one of the best protein systems to study the mechanism of fibril formation. In is a globular protein containing two chains, A (21 residues) and B (30 residues), which are interconnected via two disulfide linkages, CysA7-CysB7 and CysA20-CysB19. Moreover, the A-chain contains an intra-chain disulfide bridge (CysA6-CysA11).7,8 In contains 12.5% of Tyr and no Trp; 12.5% of Cys, which is all present in the disulfide form; and some Phe.8–10

The physical and chemical stability of In is strongly influenced by several different parameters. Under denaturation conditions, including heating, pH change, agitation, and the presence of denaturants, e.g. urea and guanidine hydrochloride, In is known to assemble into amyloid-like fibrils, highly ordered aggregates with a characteristic β-structure.11–14 Variations of the solution pH can significantly alter the electrostatic interactions by altering the charge present on the amino acid residues with ionizable side chains. Circular dichroism (CD) spectroscopy indicates that the initial aggregates retain their predominantly α-helical structure, but that there is a subsequent conversion to a β-sheet structure as the fibrillation process continues.15 Interestingly, In crystals are insoluble in water and tend to precipitate to the bottom of the vial, which has to be tipped to resuspend them before use.16

The long term stability of In in its monomeric state at pH 7.0 has not been achieved yet. Our experience with the protic ammonium-based ILs suggests that these ILs acts as biocompatible solvent media for the globular protein17–21 and as stabilizing agents for several amino acids.22–25 However, the prevention of self-aggregation of proteins in ILs has not been systematically explored. In this quest, for the first time, we have reported a remarkable achievement in stabilization of the monomer form of In against aggregation and unfolding has been observed in ammonium-based ILs by our group.26 The tendency of In to self-aggregate in aqueous media25 was reduced in the presence of ILs. Furthermore, the thermal stability of the monomeric form of In was considerably increased in the presence of these ILs.

ILs have become very important solvents for protein stability and biological transformation studies.2 The advantages of these compounds are due to their non-volatility, good solvating properties, variable polarity range, and recyclability, which render these compounds as green solvents.27,28 However, stabilizing proteins in ILs for a long time is a multivariate problem.29 ILs as solvents and additives vary, as some provide thermal stabilization and enhanced refoldability, while other ILs acts as denaturants and induce aggregation.30,31

As an extension of our research on the effect of stability of In in the presence of ILs and to improve our understanding of the impact of ILs on biomolecules, we have exploited the structural stability of In, in imidazolium-based ILs such as 1-butyl-3-methylimidazolium thiocyanate [Bmim][SCN], 1-butyl-3-methylimidazolium hydrogensulfate [Bmim][HSO4], 1-butyl-3-methylimidazolium chloride [Bmim][Cl], 1-butyl-3-methylimidazolium bromide [Bmim][Br], 1-butyl-3-methylimidazolium acetate [Bmim][CH3COO], and 1-butyl-3-methylimidazolium iodide [Bmim][I]. Significant structural behavior of In is observed indicating that the local environment of the protein is considerably changed in the presence of these ILs. Additionally, through this work we could examine the effect of the Hofmeister series of anions of ILs on In stability, since we have taken a common cation with a combination of various anions.

2. Materials and methods

2.1. Materials

Insulin (Zn free), 1-butyl-3-methylimidazolium thiocyanate (0.7% water), 1-butyl-3-methylimidazolium hydrogensulfate (≤1.0% water), 1-butyl-3-methylimidazolium chloride (≤0.2% water), 1-butyl-3-methylimidazolium bromide (≤200 ppm water), 1-butyl-3-methylimidazolium acetate (≤0.5% water) and 1-butyl-3-methylimidazolium iodide (≤0.5% water), were obtained from Sigma-Aldrich Chemical Company (USA). All materials were used without further purification. Phosphate buffer solution of pH 7.0 was prepared using distilled deionized water at 18.3 MΩ. All mixture samples were prepared gravimetrically using a Mettler Toledo balance with a precision of ±0.0001 g. The protein concentration was ∼0.2 mg ml−1 for UV-vis, fluorescence and 0.5 mg ml−1 for thermal fluorescence, circular dichroism (CD), and dynamic light scattering (DLS) measurements.

In order to check the concentration dependent effect of ILs on In, we have taken two sets of IL concentrations. The first set consists of aqueous (i.e. in buffer) IL solutions ranging between 0.01 and 0.04 M and the other set consists of 0.5–2.0 M IL solutions.

2.2. Methods

2.2.1. Absorption spectroscopy. Absorption spectra for In as well as In in the presence of various concentrations of ILs were recorded on a Shimadzu UV-1800 (Japan) spectrophotometer with the highest resolution (1 nm) using matched 1 cm path length quartz cuvettes.
2.2.2. Fluorescence spectroscopy. Steady-state fluorescence measurements were conducted with a Cary Eclipse spectrofluorometer (Varian optical spectroscopy instruments, Mulgrave, Victoria, Australia) equipped with thermostatted cell holders and temperature was kept constant by a circulating water bath using a Peltier device attached to the sample holder of the fluorimeter. The excitation wavelength was set at 275 nm in order to calculate the contribution of the tyrosine (Tyr) residues to the overall fluorescence emission. The experiments were performed at 25 °C by using a 1 cm sealed cell and both excitation and emission slit widths were set at 5 nm, and corrected for background signal. The fluorescence intensity at the emission maximum for the native enzyme (304 nm) was continuously recorded as the temperature was raised from 25 to 70 °C at an approximate rate of 2 °C min−1. Both the change in fluorescence intensity and the shift in fluorescence maximum wavelength were recorded to monitor the unfolding transition.
2.2.3. Time resolved fluorescence spectroscopy. Fluorescence lifetime measurements were performed using a Fluorocube TCSPC system from Horiba Scientific, Japan. The excitation wavelength for time resolved measurements was 275 nm to selectively excite the Tyr residues in In and the emission intensities were recorded at the λmax 303 nm. Slit widths of 15 nm were used on both the excitation and emission monochromators. The multi-exponential decay curves were analyzed using Data Analysis Software (DAS v6.3) provided with the instrument. The fluorescence decay was acquired with a peak preset of 10[thin space (1/6-em)]000 counts. All lifetimes were fit to a χ2 value of less than 1.2 and with a residuals trace that was fully symmetrical about the zero axis.
2.2.4. Circular dichroism. CD spectroscopic studies were performed using a PiStar-180 spectrophotometer (Applied Photophysics, UK) equipped with a Peltier system for temperature control. CD calibration was performed using (1S)-(+)-10-camphorsulphonic acid (Aldrich, Milwaukee, WI), which exhibits a 34.5 M cm−1 molar extinction coefficient at 285 nm, and 2.36 M cm−1 molar ellipticity (Θ) at 295 nm. The sample was pre-equilibrated at the desired temperature for 15 min and the scan speed was fixed for adaptive sampling (accuracy of ±0.01) with a response time of 1 s and 1 nm bandwidth. The tertiary structures of In were monitored by using near-UV (250–300 nm; 1.0 cm path length cuvette). Each sample spectrum was obtained by subtracting the appropriate blank medium (without In) from the experimental spectrum and was collected by averaging six spectra.
2.2.5. Dynamic light scattering measurements. The light scattering measurements were performed on a MALVERN Zetasizer Nano instrument (UK). The instrument is equipped with a 4 mW He–Ne laser (633 nm) and fitted with an automatic laser attenuator with a transmission of 100 to 0.0003%. The time averaged intensities were measured at a scattering angle of 90°. An advanced avalanche photodiode, Q.E. > 50% at 633 nm, was used as a detector. The instrument has an in-built automated correlator for the detection of the scattered intensity and the necessary autocorrelation function calculations were performed by the instrument using advanced system utilities and additional analysis algorithms.

3. Results and discussion

3.1. Absorption spectroscopy

The sensitivity of tyrosine (Tyr) to its chemical environment makes this amino acid a highly important spectroscopic probe for In conformations and dynamics. The literature reveals that the dissociation of the Tyr residues occurs much faster than denaturation of the molecule.32 Thus, exploitation of the spectroscopic behavior of Tyr provides an in-depth knowledge of precisely how the conformation of a protein changes with the microenvironment. This provides the motivation for our present work in which the effect of a nearby charge on the absorption bands of the Tyr chromophore is studied. The exact position of the absorption bands, however, depends on the microenvironment of the chromophores, with shifts due to solvation effects. In this context, the absorption spectra of biomolecules have been made the subject of considerable study. UV-Vis spectroscopy in some cases also depends in a significant way on the molecule environment. However, the unfolding of the molecule leads to the exposure of these residues at the protein surface and therefore tyrosyl ionization is detected. Therefore, the UV absorbance changes following tyrosyl ionization can be used to monitor In unfolding. The absorbance measurements, at 278 nm, are sufficient to obtain the degree of Tyr ionization in the In.

A Tyr residue whose aromatic system participates in hydrophobic interactions in the protein and is thus eliminated from contacts with the solvent is referred to as buried. Conversely, the aromatic system of an exposed group participates in van der Waals interactions with solvent molecules. In this context, the benzene ring of Tyr exposed to the solvent determines the position of the absorption band. The In stability was measured using UV absorption at 276 nm.33,34 We observed that In treated with various concentrations of ILs shows distinct changes compared to the native structure. The absorbance spectra of the ILs with the In structure is provided in Fig. 1. For the low concentrations of ILs (0.01–0.04 M), absorbance at 276 nm was observed only for [Bmim][HSO4], [Bmim][Cl] and [Bmim][Br] (Fig. 1c, e and g). While in the rest of the ILs, [Bmim][SCN], [Bmim][CH3COO] and [Bmim][I] does not show any absorption at 276 nm (Fig. 1a, i and k). On the other hand, surprisingly, all ILs except [Bmim][Cl] and [Bmim][Br] did not show any absorption at 276 nm at higher concentrations of ILs (0.5–2.0 M of ILs). From Fig. 1b, d, j and l the absence of absorption spectra in the presence of ILs [Bmim][SCN], [Bmim][HSO4], [Bmim][CH3COO] and [Bmim][I] indicates that the Tyr environment is completely lost, which indicates that the protein is denatured.


image file: c3ra44477e-f1.tif
Fig. 1 UV absorption spectra of In in ILs (a and b) [Bmim][SCN]; (c and d) [Bmim][HSO4]; (e and f) [Bmim][Cl]; (g and h) [Bmim][Br]; (i and j) [Bmim][CH3COO]; and (k and l) [Bmim][I] (black for 0.0 M; red for 0.01 and 0.5 M; green for 0.02 and 1.0 M; blue for 0.03 and 1.5 M and cyan for 0.04 and 2.0 M of ILs).

A large increase in the absorbance intensity of Tyr residue was observed for In in the presence of [Bmim][Cl], [Bmim][Br] and [Bmim][HSO4] ILs at their lower concentrations (Fig. 1). From Fig. 1(c and e), we observed that the absorption bands are more broad in the presence of 0.01 M of [Bmim][HSO4] and [Bmim][Cl] as compared to that of 0.01 M of [Bmim][Br] (Fig. 1g). The changes in the absorption spectra of In in the presence of 0.01 M of [Bmim][HSO4] and [Bmim][Cl] indicate that these ILs have more marked effects on the In structure even at their lower concentrations than the [Bmim][Br]. However, based on the absorption intensities from Fig. 1(c and e), [Bmim][HSO4] seems to be more interacting with the In surface than the [Bmim][Cl] IL.

Similarly, on comparison of Fig. 1f and h, an increase in the absorbance intensity of the Tyr residues was observed more in the presence of [Bmim][Cl] as compared to [Bmim][Br] ILs with their increasing concentrations. Additionally, broadness in the absorbance bands for In in [Bmim][Cl] IL was also observed in the presence of these ILs. An increase in the absorbance spectra indicates modifications in the solvent system, especially around the Tyr chromophore. However, the absorbance bands at 275 nm relatively appeared at the same region in the presence of [Bmim][Cl] and [Bmim][Br] as compared to the native state of In (Fig. 1).

In our earlier reported work on the stability of In in protic ILs (PILs), the zeroth-order spectrum of the In consists of a broad absorbance band with two small shoulders, reflecting the fine structure that is observed only in the case when the Tyr residues are not ionized by solvent molecules.26 Additionally, the Tyr absorption bands were strongly quenched in the presence of PILs, but the shift in the wavelengths was observed to be independent of the IL concentrations.26 We observed a complete loss of absorption bands in the presence of imidazolium-based ILs (with anions such as SCN, CH3COO, I at 0.01–0.04 M; and SCN, HSO4, CH3COO, I at 0.5–2.0 M) that represents the complete loss of Tyr environment which may be due to the direct interaction of ILs with the In. This indicates that the native structure of In is completely denatured in these ILs. With respect to this, [Bmim][Cl] and [Bmim][Br] show some weak ability of denaturing the structure of In as compared to rest of the imidazolium-based ILs. An increase in the Tyr absorption bands with the increased broadening points towards the protonation of the Tyr molecule leading towards the formation of inactive state of the molecule. Since we observed a broad absorbance band with two small shoulders in the presence of 0.01–0.04 M of [Bmim][Br] and [Bmim][Cl], it may be possible that the protonation of the Tyr is weak in the presence of these ILs and it gradually increases with the IL concentration. This supports the fact that upon unfolding the Tyr is exposed to the solvent surface, and therefore tyrosinate formation leads to an increase in the absorbance in the same wavelength range.26

The quenching of the Tyr absorption bands in In in the presence of ILs indicates that biocompatible ILs lead to the more compact structure and therefore the buried Tyr residues are not exposed to the solvent molecules.26 On the other hand, this quenching may occur due to the formation of the dimeric state of the In in the presence of ILs which is more stable than its monomeric form. Additionally, sodium salts of SO4−2, HPO4, and CH3COO2 were observed to denature the In, causing it to precipitate out of the solvent phase (salting out).26 The corresponding UV spectra of In in these ionic salts exhibit very weak absorption bands that directly correspond to the aggregated state of the protein.26 Breydo et al.35 noticed that the absorption maximum of the Tyr residues not only shifts to longer wavelengths following their ionization but also undergoes subsequent changes. The weak denaturating factor of Cl and Br and strong denaturating factor of CH3COO, HSO4, SCN, and I is opposite to the nature of anions ability towards the protein stability as revealed from Hofmeister series. This is contradictory to the fact that sulfate containing ILs are stabilizers for the protein structure.36

3.2. Fluorescence spectroscopy

The fluorescence emission of Tyr is almost insensitive to solvent polarity. At ambient temperature, the Tyr fluorescence of In showed an emission λmax at around 304 nm, with the excitation wavelength at 275 nm.37 This indicates that In in the buffer solution does not contain hydrogen-bonded Tyr residues. In native In, the emission of the Tyr residue is often quenched, which is due to its interaction with the peptide chain in the molecule. Moreover, denaturation or fibrillation of the In frequently results in decreased Tyr emission.38 Moreover, the scan of the In in PILs shows an increase in the Tyr fluorescence intensity at λmax 303 nm, corresponding to In stability.26

The Tyr environment of native In and In in imidazolium-based ILs was analyzed by fluorescence spectroscopy at 304 nm. Fig. 2 shows the emission spectra of In in the native state (pH 7.0), in the absence as well as in the presence of ILs at all concentrations. Moreover, quenching in the fluorescence emission of the Tyr residue in In was observed while moving from 0.01 M–0.04 M of ILs (Fig. 2a, c, e, g, i and k). A close analysis of the fluorescence spectrum of In in Fig. 2 reveals that except [Bmim][Cl] and [Bmim][Br], maximum quenching is observed in the Tyr fluorescence in the presence of SCN, HSO4, CH3COO and I containing ILs. This supports the UV spectra of In in the presence of these ILs which predicted that the Tyr environment is more perturbed in the presence of SCN, HSO4, CH3COO and I than that of the Cl and Br anions of the ILs. Moreover, from Fig. 2(e and g) Cl anion seems to show more strong interactions towards In than that of the Br anion of the IL.


image file: c3ra44477e-f2.tif
Fig. 2 Fluorescence analysis of In in ILs (a and b) [Bmim][SCN]; (c and d) [Bmim][HSO4]; (e and f) [Bmim][Cl]; (g and h) [Bmim][Br]; (i and j) [Bmim][CH3COO]; and (k and l) [Bmim][I] (black for 0.0 M; red for 0.01 and 0.5 M; green for 0.02 and 1.0 M; blue for 0.03 and 1.5 M and cyan for 0.04 and 2.0 M of ILs).

The variance in the fluorescence spectra of the [Bmim][Cl] and [Bmim][Br] IL induced state at each 0.5–2.0 M concentration was observed for In which correlates well with the UV-visible results in Fig. 1. Further, we observed red shifts for In in [Bmim][Cl] florescence with increasing concentrations (0.5–2.0 M) of Cl, whereas the opposite trend is observed for In in the presence of [Bmim][Br] IL (Fig. 2f and h). In contrast to this observation, interestingly, the fluorescence spectrum of native In was observed around ∼304 nm (i.e. close to the native state of the In) in the presence of [Bmim][Br] IL which indicates that [Bmim][Br] IL is much more efficient in stabilizing or at least interacting with the native protein than [Bmim][Cl] at 25 °C. The rest of the ILs behave as denaturants for the In structure, as a consequence in most of the cases we did not observe the fluorescence of the denatured In.

The unfolding of globular proteins has been found to approach closely a two-state folding mechanism, such as that shown in eqn (1).

 
Folded ↔ Unfolded (1)
Experimentally, the fraction of unfolded molecules was measured by the intensity of the absorbance. The fraction unfolded is determined as
 
image file: c3ra44477e-t1.tif(2)
 
image file: c3ra44477e-t2.tif(3)
In the equations, α is the fraction of unfolded molecules, I is the measured intensity at a given temperature, If is the measured intensity of the folded state, and Iu is the intensity of the completely unfolded state. The transition temperature of the protein (Tm) is the temperature at which α = 0.5. The details of obtaining the thermodynamic parameters such as free energy of unfolding (ΔGu), enthalpy change (ΔH), and heat capacity change (ΔCp) through fluorescence thermal analysis are elucidated elsewhere.39 These thermodynamic profiles were obtained from the analysis of Fig. 3 and are collected in Table 1.


image file: c3ra44477e-f3.tif
Fig. 3 Fraction of unfolded In in (a and b) [Bmim][Cl]; (c and d) [Bmim][Br]; ILs at (image file: c3ra44477e-u2.tif) 0.0 M, (image file: c3ra44477e-u3.tif) 0.01 and 0.5 M, (image file: c3ra44477e-u4.tif) 0.02 and 1.0 M, (image file: c3ra44477e-u5.tif) 0.03 and 1.5 M, and (image file: c3ra44477e-u6.tif) 0.04 and 2.0 M of ILs, and (e) [Bmim][SCN]; (f) [Bmim][HSO4]; (g) [Bmim][CH3COO] and (h) [Bmim][I] ILs at (image file: c3ra44477e-u7.tif) 0.0 M, (image file: c3ra44477e-u8.tif) 0.01 M, (image file: c3ra44477e-u9.tif) 0.02 M, (image file: c3ra44477e-u10.tif) 0.03 M, and (image file: c3ra44477e-u11.tif) 0.04 of ILs).
Table 1 Transition temperature (Tm), enthalpy change (ΔH) and heat capacity change (ΔCp) determined by fluorescence spectroscopy and calculated Gibbs free energy changes (ΔGu) in unfolding state at 25 °C for the insulin (In) in various concentrations of ionic liquids (ILs)a
Sample Tm (°C) H) cal mol−1 Gu) cal mol−1 Cp) cal mol−1K−1
a The values for 0.03 and 0.04 M of [Bmim][I] were not obtained due to quenching in the Tyr emission spectrum.
Pure In in buffer 84.2 44[thin space (1/6-em)]971.12 2387.151 1227.204
0.01 M [Bmim][Br] 62.4 46[thin space (1/6-em)]323.27 2632.402 1168.205
0.02 M [Bmim][Br] 60.0 45[thin space (1/6-em)]535.07 2436.146 1231.398
0.03 M [Bmim][Br] 57.6 41[thin space (1/6-em)]362.63 2073.678 1205.183
0.04 M [Bmim][Br] 54.0 44[thin space (1/6-em)]445.53 2000.393 1463.625
0.01 M [Bmim][Cl] 63.3 131[thin space (1/6-em)]069.8 7610.437 3223.483
0.02 M [Bmim][Cl] 58.5 128[thin space (1/6-em)]171.4 6588.165 3629.35
0.03 M [Bmim][Cl] 55.7 129[thin space (1/6-em)]406.1 6139.043 4015.214
0.04 M [Bmim][Cl] 55.4 92[thin space (1/6-em)]783.35 4361.969 2908.598
0.01 M [Bmim][HSO4] 57.7 35[thin space (1/6-em)]457.35 1782.624 1029.808
0.02 M [Bmim][HSO4] 56.7 32[thin space (1/6-em)]541.62 1590.023 976.3909
0.03 M [Bmim][HSO4] 54.5 31[thin space (1/6-em)]741.27 1451.381 1026.776
0.04 M [Bmim][HSO4] 52.2 29[thin space (1/6-em)]726.95 1260.699 1046.553
0.01 M [Bmim][SCN] 58.3 44[thin space (1/6-em)]911.18 2295.865 1279.739
0.02 M [Bmim][SCN] 55.2 44[thin space (1/6-em)]890.75 2097.606 1416.992
0.03 M [Bmim][SCN] 54.8 40[thin space (1/6-em)]226.72 1856.665 1287.586
0.04 M [Bmim][SCN] 38.9 30[thin space (1/6-em)]245.15 678.7378 2127.08
0.01 M [Bmim][CH3COO] 62.3 11[thin space (1/6-em)]7155.8 6641.442 2962.852
0.02 M [Bmim][CH3COO] 61.0 10[thin space (1/6-em)]3831.2 5699.421 2725.882
0.03 M [Bmim][CH3COO] 55.4 63[thin space (1/6-em)]878.18 3003.068 2002.471
0.04 M [Bmim][CH3COO] 50.0 45[thin space (1/6-em)]759.06 1793.791 1758.611
0.01 M [Bmim][I] 38.7 39[thin space (1/6-em)]172.11 2796.002 866.8848
0.02 M [Bmim][I] 35.4 37[thin space (1/6-em)]253.96 3521.397 631.4296
0.03 M [Bmim][I]
0.04 M [Bmim][I]


From Table 1 and Fig. 3, even at low concentrations of ILs (0.01–0.04 M) the thermal stability of In was considerably decreased. In the presence of 0.01 M of ILs the Tm of In decreased from 84.2 °C (for pure In in buffer) to 58.3, 57.7, 63.3, 62.4, 62.3 and 38.7 °C in the presence of [Bmim][SCN], [Bmim][HSO4], [Bmim][Cl], [Bmim][Br], [Bmim][CH3COO] and [Bmim][I] IL, respectively. From the results in Fig. 1 and 2, and comparison with Table 1 and Fig. 4, Cl, Br ILs seem to participate in a dual role on In: (1) they show the stabilizing tendency towards native In at 25 °C; (2) they enhance the denaturation of the In with increasing temperature. Moreover, the Tm values of the In decrease with increasing concentrations of these ILs. Interestingly, from Table 2 we observed that Br shows the least destabilizing property against temperature effects as compared to Cl at 0.01 M of ILs.


image file: c3ra44477e-f4.tif
Fig. 4 The variations in transition temperature (Tm) of In for ILs at 0.01 M concentration of ILs.
Table 2 Lifetime parameters for insulin (In) in ionic liquids (ILs)a
Sample τ1 (s) τ2 (s) χ2
a The magnitude of χ2 denotes the goodness of the fit.b The values for 0.03 and 0.04 M of [Bmim][I] were not obtained due to quenching in the Tyr emission spectrum.
Pure 8.09 × 10⁻¹¹ 1.11 × 10⁻⁹ 0.76
 
[Bmim][Cl]
0.5 M 1.21 × 10⁻¹⁰ 1.18 × 10⁻⁹ 0.87
1.0 M 2.29 × 10⁻¹⁰ 1.27 × 10⁻⁹ 1.49
1.5 M 2.32 × 10⁻¹⁰ 2.53 × 10⁻⁹ 1.98
2.0 M 2.12 × 10⁻¹⁰ 3.53 × 10⁻⁹ 1.8
 
[Bmim][Br]
0.5 M 2.40 × 10⁻¹⁰ 1.08 × 10⁻⁹ 0.95
1.0 M 2.48 × 10⁻¹⁰ 1.14 × 10⁻⁹ 1.02
1.5 M 2.42 × 10⁻¹⁰ 1.18 × 10⁻⁹ 0.96
2.0 M 2.84 × 10⁻¹⁰ 1.23 × 10⁻⁹ 0.98
 
[Bmim][Cl]
0.01 M 4.24 × 10⁻¹⁰ 1.19 × 10⁻⁹ 0.87
0.02 M 4.08 × 10⁻¹⁰ 1.16 × 10⁻⁹ 1.13
0.03 M 5.23 × 10⁻¹⁰ 1.33 × 10⁻⁹ 0.97
0.04 M 5.23 × 10⁻¹⁰ 1.36 × 10⁻⁹ 1.01
 
[Bmim][Br]
0.01 M 2.79 × 10⁻¹⁰ 1.07 × 10⁻⁹ 0.82
0.02 M 2.84 × 10⁻¹⁰ 1.03 × 10⁻⁹ 0.98
0.03 M 2.99 × 10⁻¹⁰ 1.00 × 10⁻⁹ 0.87
0.04 M 3.55 × 10⁻¹⁰ 1.04 × 10⁻⁹ 0.81
 
[Bmim][SCN]
0.01 M 5.03 × 10⁻¹⁰ 1.23 × 10⁻⁹ 0.84
0.02 M 3.57 × 10⁻¹⁰ 1.08 × 10⁻⁹ 1.07
0.03 M 2.96 × 10⁻¹⁰ 1.01 × 10⁻⁹ 1.00
0.04 M 3.10 × 10⁻¹⁰ 1.05 × 10⁻⁹ 1.15
 
[Bmim HSO4]
0.01 M 7.43 × 10⁻¹⁰ 1.80 × 10⁻⁹ 1.03
0.02 M 6.92 × 10⁻¹⁰ 1.84 × 10⁻⁹ 1.29
0.03 M 6.33 × 10⁻¹⁰ 1.91 × 10⁻⁹ 1.45
0.04 M 5.93 × 10⁻¹⁰ 1.98 × 10⁻⁹ 1.59
 
[Bmim][CH3COO]
0.01 M 2.98 × 10⁻¹⁰ 1.15 × 10⁻⁹ 0.90
0.02 M 2.41 × 10⁻¹⁰ 1.07 × 10⁻⁹ 0.85
0.03 M 3.86 × 10⁻¹⁰ 1.19 × 10⁻⁹ 0.88
0.04 M 1.13 × 10⁻¹⁰ 1.01 × 10⁻⁹ 0.99
 
[Bmim][I]b
0.01 M 1.69 × 10⁻¹⁰ 9.25 × 10⁻⁹ 0.96
0.02 M 1.52 × 10⁻¹⁰ 9.84 × 10⁻⁹ 1.02
0.03 M
0.04 M


The temperature vs. fraction unfolded results are presented in Fig. 3 and explain that for higher concentrations of the ILs the thermal stability of the In with respect to the Tm of the native state is much lower. We observed from Table 1 Tm values of 84.4, 63.0, 56.3, 52.1, and 51.4 °C for 0.0, 0.5, 1.0, 1.5 and 2.0 M of [Bmim][Cl] IL, respectively. On the other hand, [Bmim][Br] dramatically follows the same trend and shows that it is a strong destabilizer for the In with respect to increasing temperature (Table 1). Consequently, we observed Tm values of 43.0, 40.0, 40.6, and 40.6 °C for 0.5, 1.0, 1.5 and 2.0 M of [Bmim][Br] IL, respectively. The corresponding Gibbs free energy values (ΔGu) were also calculated and they followed the same trend as shown in Table 1. It emerges from Table 1 that the ΔGu values of In in [Bmim][Cl] and [Bmim][Br] significantly decrease linearly as IL concentration increases. The results indicate that these ILs interacts with the surface of In and destabilize the folded structure of In, and this effect is more pronounced with increasing concentration of ILs and temperature.

3.3. Circular dichroism

In principle, near-UV CD spectra could provide some information about the orientation of aromatic side chains of In in solution. Changes in the near-UV CD region of In were used to gain information about the quaternary and tertiary structure.40 The near-UV CD band in the wavelength arises mainly from interactions between aromatic side chains in the folded conformation, but disulfide bridges also contribute to the magnitude of this band.41 Hence, any events that affect the packing around these local probes will be mirrored in the near-UV spectrum of the In. Accordingly, the In CD spectrum in the 250–350 nm range reflects the environment of the Tyr chromophore with unknown contributions from the disulfide linkages.42 The In in co-solvent free aqueous solution exhibits a pronounced negative near-UV CD band, which is centered at 275 nm.43 Tyr side chains are reported to dominate the CD observed for In at 275 nm.44 The disulfide bridges probably also make some contribution to the In CD at 275 nm, but the exact proportions of tyrosyl and disulfide CD spectra are difficult to determine experimentally.45 However, a weak peak around ∼252 nm is observed that has been attributed to the disulfide bonds in the protein.46,47

Fig. 5 shows that the CD spectrum changes in intensity at ∼253 nm as a function IL concentrations. Additionally, no CD contribution of the disulfide bonds at ∼253 nm was observed in the presence of [Bmim][SCN], [Bmim][HSO4], [Bmim][CH3COO] and [Bmim][I]. This indicates that the disulfide bonds are completely lost in the presence of these ILs even at their lower concentrations. A sharp peak around ∼253 nm in the presence of [Bmim][Br] and a relatively weak band for [Bmim][Cl] indicates that [Bmim][Br] IL does not disturb the disulfide bonds in the In. This indicates a structural rigidity induced around the disulfide bonds by [Bmim][Br] IL. These results reflect that the Cys residues come closer and are thereby less exposed to the solvent system in the presence of Br containing imidazolium-based ILs. This may be an indication of the formation of the dimeric form of In or its higher polymeric structures (i.e. aggregates) in the presence of [Bmim][Br] and to some extent in [Bmim][Cl] ILs. The absence of near-UV CD bands in the ∼253 nm region might be because of the complete breakage of the disulfide bonds due to denaturation followed by direct interaction of ILs with the protein surface. However, evaluating the In denaturation is a very complex phenomenon, since in In it is reported that the disulfide bonds may remain intact even in the presence of high concentrations of denaturants (4 M urea or 1 M GdnHCl), rather, it is the Tyr residue that is mainly affected by the denaturants. Muzaffar48 and Ahmad49 reported that addition of 4 M or 1 M GdnHCl led to loss of the structure around Tyr (276 nm) in In but the disulfide environment was found to be more ordered than the native form in the presence of these denaturing agents.


image file: c3ra44477e-f5.tif
Fig. 5 Circular dichroism analysis of In in ILs (a and b) [Bmim][SCN]; (c and d) [Bmim][HSO4]; (e and f) [Bmim][Cl]; (g and h) [Bmim][Br]; (i and j) [Bmim][CH3COO]; and (k and l) [Bmim][I] (black for 0.0 M; red for 0.01 and 0.5 M; green for 0.02 and 1.0 M; blue for 0.03 and 1.5 M and cyan for 0.04 and 2.0 M of ILs).

On the other hand, fibril formation is a common phenomenon that is accompanied with protein aggregation. However, the In monomer is less stable and readily polymerizes to form insoluble fibrils or amyloid deposits.50 The propensity of In to undergo conformational changes, resulting in successive, linear aggregation and formation of a viscous gel or insoluble precipitates, has been one of the most intriguing and widely studied phenomena in relation to insulin stability. A number of previous studies have investigated the contributions of Tyr residues to the CD spectrum of In.42,51 The tyrosyl CD signal at ∼275 nm is enhanced disproportionally as monomers interact to form dimers and as dimers interact to form hexamers, with greater effect attributed to the first process.42 This enhanced tyrosyl CD can be attributed to new coupling interactions generated in the regions of contact between monomers and between dimers. The tyrosyl CD intensities calculated for monomers, dimers, and hexamers of 2-zinc pig In are compatible with the experimentally observed CD spectra that are enhanced about fourfold in the hexamer compared with the monomer.52 The dimer exhibits a negative band with a minimum located at 273 nm.48 Monomerization in In leads to a shift in the minimum to about 265 nm.24 Moreover, the denaturation of In is always accompanied by consistent decrease in the peak intensity with loss in the tertiary structure.53

In Fig. 5, near-UV CD spectroscopy has been used to predict the association states of In under various structure perturbing conditions. All ILs at each concentration (0.01–2.0 M of ILs) except [Bmim][Cl] and [Bmim][Br] show broadening of the bands in the near UV region ∼273 nm. Additionally, the broadening in the bands is more pronounced in the presence of SCN, HSO4, CH3COO and I anions at all concentrations (Fig. 5). This signifies that the tertiary structure of the In is affected by the structural perturbations caused by these ILs. However, if we consider the cases of [Bmim][Cl] and [Bmim][Br], the magnitude of the negative CD band is enhanced more at each concentration and gradually decreases with increase in the concentration from 0.01–0.04 M of ILs (Fig. 5e and g). At higher concentrations (0.5–2.0 M) of ILs [Bmim][Cl] and [Bmim][Br] the CD bands are relatively constant. The relatively unperturbed large CD signal at ∼273 nm in the presence of [Bmim][Cl] and [Bmim][Br] correlates with the formation of highly organized structures or protein aggregated within the entire concentration range of the ILs. Evidently, from Fig. 5(f and h) the ellipticity values of the protein in the presence of 0.5 M to 2.0 M of [Bmim][Cl] and [Bmim][Br] are much more negative than the other ILs as discussed earlier at lower concentrations. If we compare the results of [Bmim][Br] concentrations on the In structure from Fig. 5(g and h), we could observe that at lower concentrations of the [Bmim][Br] the ellipticity value of the protein remains almost constant with the increase in the concentration of IL. The Tyr CD signals at ∼273 nm indicate that this IL disrupts the In structure the least as compared to the rest of the ILs. Interestingly, Br anion of the IL shows stabilizing properties for In which rules out the Hofmeister prediction of considering it as a denaturant.

Nevertheless, the more negative enhancements of the CD band give a clue as to a closer packing around the aromatic residues in [Bmim][Br] (Fig. 5h). This observation is supported by the high negative ellipticity of the near-UV CD band of In, which is maintained and even increased slightly upon addition of co-solvents.53 This implies a higher degree of compactness of the tertiary fold of the In in the presence of [Bmim][Br] and [Bmim][Cl] ILs as well. Grudzielanek et al.54 predicted that the near-UV CD band arises mainly from the four Tyr residues of In (A14, A19, B16 and B26). Consequently, the observed enhancements of the near-UV CD band can be attributed to an increased dipole coupling between the Tyr residues B16 and B26 that are located at the dimer-forming interface, and implies a closer packing around these residues.55 Such a compaction of the native fold of proteins has been observed for preferentially hydrated protein systems.56 This evidences the outcome that undoubtedly these two ILs can be considered as the stabilizers of the In at 25 °C, however, before coming to any conclusion we stress the need for more work in this field of research.

Additionally, the peptide-hormone derives its stability from the strongly hydrophobic Cys groups. In folds into a stable three-dimensional structure mainly composed of three α-helical segments (A2–A8, A13–A19, and B9–B19) stabilized by its three disulfides. The importance of the three disulfides and the aromatic amino acids (B24, B25, A19) to In function is well established.57,58 Deletion of the disulfide A6–A11 leads to the unfolding of the α-helix in the N terminus of A-chain.57,58 Removal of the disulfide A7–B7 causes more serious unfolding, besides the α-helix in the N terminus of A-chain, a part of the α-helix in the C terminus of A-chain is also unfolded.59 The investigation of the ILs effect on In structure reveals that ILs having Br anions are acting as a stabilizer and do not interact with the disulfide bonds in the In structure. However, a CD-based comparison with the rest of the ILs reveals that CH3COO anion at its lower concentrations (0.01 M) shows some stabilization character to In native form, however is difficult to conclude it as a stabilizer for the In since it fails to protect the native structure at higher concentrations (Fig. 5i and j). Moreover, based on our experimental reports of a comparison between Cl and Br, both are having nearly equivalent stabilization effects on the native In. Thus, the ability of stabilization/destabilization of In structure in ILs follows the order:

image file: c3ra44477e-u1.tif

3.4. Time resolved fluorescence

The intrinsic fluorescence of Tyr has been scarcely used to explore the protein structure mainly because of the low fluorescence quantum yield of Tyr towards changes in the surrounding environment.60 In aqueous solutions, Tyr exhibits multiple exponential decays due to the heterogeneity of the Tyr interactions with nearby amino acids.61 The measured fluorescence anisotropy decay curves are shown in Fig. 6 and fitted parameters and χ2-values of the fits are listed in Table 2. The fluorescence decay curve fits for In in the presence of 0.01–0.04 M of ILs and In in the presence of 0.5–2.0 M of [Bmim][Cl] and [Bmim][Br] ILs are shown in Fig. 6(a–d). The fluorescence decay curves were not observed for the higher concentrations (0.5–2.0 M) of [Bmim][SCN], [Bmim][HSO4], [Bmim][CH3COO] and [Bmim][I]. This occurs only when the protein is completely denatured.
image file: c3ra44477e-f6.tif
Fig. 6 Fluorescence lifetime decays of In in the ILs (a and b) [Bmim][Cl]; (c and d) [Bmim][Br]; ILs at (black) 0.0 M, (red) 0.01 and 0.5 M, (green) 0.02 and 1.0 M, (blue) 0.03 and 1.5 M, and (cyan) 0.04 and 2.0 M of ILs, and (e) [Bmim][SCN]; (f) [Bmim][HSO4]; (g) [Bmim][CH3COO] and (h) [Bmim][I] ILs at (red) 0.01; (green) 0.02; (blue) 0.03; and (cyan) 0.04 of ILs.

Moreover, it has been reported that if the protein monomers associate to a larger aggregate, the rotational correlation time (τ) will become longer and the anisotropy will decay more slowly.62 For In, the case is more complicated where the protein exists in both monomeric and polymeric states. In this context, we obtained a bi-exponential decay for Tyr on the basis of the goodness of fit criteria (χ2 and distribution of residuals). The results of the de-convolution analysis of the experimental data are listed in Table 2. The bi-exponential decay reflects the existence of two population states of the Tyr, with larger decay time of 8.09 × 10⁻¹¹s (τ1) corresponding to the buried Tyr residues in the In, whereas the small decay time of 1.11 × 10⁻⁹ s (τ2) consists of the complexed Tyr, with a strongly quenched decay.

In the presence of [Bmim][Cl] and [Bmim][Br] the longest (τ1) decay time decreases sharply on the Angstrom (Å) scale and the smallest (τ2) decay time shows an increase on the nanosecond scale. Evidently, from Table 2, values of 4.24 × 10⁻¹⁰ s (τ1) and 1.19 × 10⁻⁹ s (τ2) were obtained for In in the presence of 0.01 M of [Bmim][Cl] and values of 2.79 × 10⁻¹⁰ s (τ1) and 1.07 × 10⁻¹⁰ s (τ2) were obtained for In in the presence of 0.01 M of [Bmim][Br]. In the presence of 0.5 M of [Bmim][Br] values of 2.40 × 10⁻¹⁰ s (τ1) and 1.08 × 10⁻⁹ s (τ2) were observed. On the other hand, in the presence of 0.5 M of [Bmim][Cl] values of 1.21 × 10⁻¹⁰ s (τ1) and 1.18 × 10⁻⁹s (τ2) were observed. A similar trend was observed in Tyr decay time with increasing concentrations of [Bmim][Cl] and [Bmim][Br] ILs as seen in Table 2. Additionally, the τ1 and τ2 components of the In in the presence of [Bmim][Br] within the concentration range of 0.01–0.04 M show less changes as compared to the rest of ILs including the Cl IL. The values confirm the fact that the Br containing IL interactions with the Tyr residue is weak as compared the rest of the ILs with various anions. As evident from Table 2 for the rest of the ILs, at lower concentrations the values of τ1 and τ2 significantly decrease with increase in the concentration of the ILs. This decrease in the time components points towards complete denaturation of the In structure and it also reflects the complete separation of the Tyr residues from the chain. This condition only arises when the chains in the In molecules are completely independent of each other and this occurs only when the disulfide bonds with and within the chain segments are completely broken and the individual chains are free in the aqueous solution. The disruption of the disulfide bonds has been experimentally observed in the presence of these ILs through CD measurements and confirms the above results.

The changes in τ1 and τ2 for the Try chromophore in the presence of [Bmim][Cl] and [Bmim][Br] reflect the effect of these ILs on the solvent environment probably leading to dimer formation or more compact structures. Additionally, it might be because of the specific mechanism resulting from Tyr–Tyr interactions at close proximity after dimer or aggregate formation. Moreover, an increase in the Tyr decay time (τ) is associated with the increased size of the biomolecule.63,64 In this context, Amaro et al.63 illustrated that the lifetime increases substantially with an increase in the aggregation state of a protein. This occurs due to ionic and hydrogen bonding interactions which are common phenomena responsible for protein aggregation.

3.5. Dynamic light scattering measurements

In support of the observation of dimer or aggregate formation of In in ILs, we have performed direct measurements, such as dynamic light scattering (DLS) measurements, for the samples. Since 1-alkyl-3-methylimidazolium based ILs undergo self-aggregation at high concentrations,65–67 to avoid this drawback and to gain better insight of the influence of ILs on the aggregation behavior of In, we have taken DLS measurements of In only in the presence of 0.01–0.04 M of ILs and the results are displayed in Fig. 7. Table 3 represents the hydrodynamic radius (Dr) values for the In in the presence of 0.01–0.04 M of ILs. Interestingly, apart from[Bmim][Cl] and [Bmim][Br], for each IL at 0.01 M concentration we observed a sharp decrease in the Dr of In.
image file: c3ra44477e-f7.tif
Fig. 7 The variations in hydrodynamic radius (Dr) of In for ILs at 0.01 M concentration and 20% acetic acid solution.
Table 3 Hydrodynamic radii (Dr) of insulin at various concentrations of ILs
Sample Hydrodynamic radius (Dr) nm
Pure 1847.0
[Bmim][Cl]
0.01 M 1158.0
0.02 M 1384.2
0.03 M 1497.0
0.04 M 1413.0
 
[Bmim][Br]
0.01 M 1064.0
0.02 M 1029.0
0.03 M 1207.0
0.04 M 1425.0
 
[Bmim][SCN]
0.01 M 940.7
0.02 M 227.6
0.03 M 114.8
0.04 M 93.13
 
[Bmim][HSO4]
0.01 M 161.2
0.02 M 179.8
0.03 M 220.2
0.04 M 233.9
 
[Bmim][CH3COO]
0.01 M 840.2
0.02 M 691.0
0.03 M 531.3
0.04 M 583.7
 
[Bmim][I]
0.01 M 232.0
0.02 M 110.2
0.03 M 104.9
0.04 M 103.8


Evidently, from Fig. 7, a decrease in the value of Dr from 1847.0 nm for pure In to 940.7, 161.2, 1158.0, 1064.0, 840.2 and 232.8 nm occurred for In in the presence of 0.01 M of [Bmim][SCN], [Bmim][HSO4], [Bmim][Cl], [Bmim][Br], [Bmim][CH3COO] and [Bmim][I] ILs, respectively. Additionally, the results in the presence of 0.01 M of [Bmim][Cl] and [Bmim][Br] indicate dimer formation at lower concentrations of ILs since we observed Dr values that are twice that of the Dr of 641.2 nm for the monomeric form observed for In in the presence of 20% acetic acid solution, which is displayed in Fig. 7 for comparison.26 Later, larger aggregates of In were detected with increase in the concentration of [Bmim][Cl] and [Bmim][Br] from 0.01–0.02 M of ILs. The Dr values for the rest of the samples are provided in Table 3.

Interestingly, the Dr values of the In in the presence of SCN, HSO4, CH3COO and I ILs were observed to be very low as compared to the Dr values of the monomeric form of the In. However, from Table 3, we observed that Dr values of In were comparable only at 0.01 M for the SCN and CH3COO ILs, which decreases with the increase in the concentration of the ILs. The decrease in the Dr values of the In in the presence of SCN, HSO4, CH3COO and I anions points towards the formation of small segments in the IL solution. From the CD results in Fig. 5, we could correlate the Dr values of In in SCN, HSO4, CH3COO and I ILs. Since the disulfide bridges between the protein chains in the In were observed to be absent in the presence of SCN, HSO4, CH3COO and I ILs, we could assume that the individual chain has been broken down to smaller segments and obviously we obtain lower values of Dr of In in these ILs.

The mechanism for the stability of protein in IL media is really surprising. The basic statement for the stability of the proteins in ILs is based on their solubility, polarity and viscosity effects. In this context, surface charge on proteins is also responsible for preferential exclusion or direct binding mechanism of ions of ILs.68 With the addition of ILs, interactions between side chains and solvent become more favorable to the protein residues. This leads to the exposure of the hydrophobic core and subsequent arrangement of the protein into a variety of different conformational states. As a result, the fluorescence intensity of the chromophore in a protein rapidly decreases with increasing concentration of ILs, and this decrease is more pronounced in the presence of imidazolium-based ILs.69,70 The possibility that the presence of Cl and Br in the solvent may mask the net charge on the In, allowing the protein to form a fibril-competent structure. Therefore, it becomes favorable for In to associate via extensive hydrogen bonding networks of the peptide backbone, making the protein more susceptible to fibril formation.

Our experimental results on stability of In in [Bmim][Cl] and [Bmim][Br] rule out the prediction that these two ILs are denaturants or destabilizers for the protein structure. We observed large increments in the tertiary structure of In in the presence of [Bmim][Cl] and [Bmim][Br] and this was witnessed through the near-UV CD spectra of In. In support, Bose et al.70 explored that in the presence of imidazolium-based ILs significant quenching in emission spectra is a common feature. But, based on the experimental evidence, they concluded that quenching is not necessarily associated with the denaturation of the protein. In this context, they observed significant catalytic activity of cellulose even after 1 h in the presence of alkyl-methylimidazolium chloride IL.70 Moreover, metalloproteins such as cytochrome c (cyt c) are observed to be stable in polar ILs. In 25 vol% 1-butyl-3-methylimidazolium chloride at pH 7.4, the higher order structures of cyt c were largely retained.71 Tamura et al.72 observed that the protein lost its activity at 50 °C in the buffer solution. However, redox activities of approximately 90% and 75% were observed to be maintained after 3 h of heating at 120 and 140 °C, respectively. Comparing these data, it should be mentioned here that the maintaining of the functional capacities of proteins in Cl containing imidazolium-based ILs is remarkable70,71 and supports our findings. On the other hand, cyt c was denatured by ethyl methylimidazolium ethyl sulfate [Emim][EtSO4].72 All of the above studies conclude that the stability/instability of the proteins depends upon the selectivity between ILs and proteins.

Moreover, the interaction of the Hofmeister series with the protein surface is a complex result of the ability of the ions to disrupt hydrogen bonding, non-polar interactions, and electrostatic effect that contribute to protein stability. The interaction and behavior of the anions of ILs depend upon the solvent environment of the parent solution and the type of co-solute present in it. However, ILs differs in the length of the alkyl group attached to the imidazolium cation, thus presumably differing in their hydrophobicity and ability to interact with the biomolecule. Thus, the position in the series can change depending on the extent to which each category of interactions stabilizes/destabilizes a particular protein. Our recent data24,73 and present study explicitly elucidate that an inverse Hofmeister series is typically observed on protein stability. Therefore, from a biophysical fundamental point of view, anions do not necessarily stabilize/destabilize the biomolecule in exactly the same order as they are placed in the Hofmeister series.

Our experimental results have identified that the imidazolium-based ILs directly participate in inducing the unfolding transition state of In. Significantly, imidazolium family ILs fail to follows the Hofmeister series and it is not suitable for explaining the protein behavior of hydrophilic ILs. It remains possible, given the vast array of imidazolium ILs, that an excellent combination of ions in ILs can provide better In stability for use in biocatalytic processes and continued research is required for the scientific community.

4. Conclusion

In conclusion, we reported the stability/destability of In in 1-butyl-imidazolium-based ILs with variations in the anions. Our results concluded that [Bmim][Cl] and [Bmim][Br] stabilize the structure of In to some extent. Further, the rest of the imidazolium ILs with SCN, HSO4, CH3COO, and I anions completely denatured the In. Our results distinctly demonstrate that anion variations have significantly influenced the biomolecule stability efficiency. Anions of ILs produce different effects on the structure and stability of biomolecules by controlling their flexibility.

Acknowledgements

We gratefully acknowledge the Council of Scientific Industrial Research (CSIR), New Delhi, India for providing SRF (Senior Research Fellowship) to A. K. The author is highly thankful to Dr Anita Kamra Verma, Department of Zoology, Kirorimal College, University of Delhi, Delhi, India, for providing dynamic light scattering facilities.

References

  1. K. A. Dill, S. B. Ozkan, M. S. Shell and T. R. Weikl, Annu. Rev. Biophys., 2008, 37, 289–316 CrossRef CAS PubMed.
  2. A. Kumar and P. Venkatesu, Chem. Rev., 2012, 112, 4283–4307 CrossRef CAS PubMed.
  3. R. Jaenicke, Eur. J. Biochem., 1991, 202, 715–728 CrossRef CAS.
  4. J. D. Harper and P. T. Lansbury, Annu. Rev. Biochem., 1997, 66, 385–407 CrossRef CAS PubMed.
  5. J. McLaurin, D. S. Yang, C. M. Yipand and P. E. Fraser, J. Struct. Biol., 2000, 130, 259–270 CrossRef CAS PubMed.
  6. M. Sunde and C. C. F. Blake, Q. Rev. Biophys., 1998, 31, 1–39 CrossRef CAS.
  7. J. Brange and L. Langkjoer, Pharmacol. Biotechnol., 1993, 5, 315–350 CAS.
  8. Q. X. Hua, S. N. Gozani, R. E. Chance, J. A. Hoffmann, B. H. Frank and M. A. Weiss, Nat. Struct. Biol., 1995, 2, 129–138 CrossRef CAS PubMed.
  9. S. G. Chang, K. Choi, S. Jang and H. Shin, Mol. Cells, 2003, 16, 323–330 CAS.
  10. G. Dodson and D. Steiner, Curr. Opin. Struct. Biol., 1998, 8, 189–194 CrossRef CAS.
  11. A. Loksztejn and W. Dzwolak, J. Mol. Biol., 2010, 395, 643–655 CrossRef CAS PubMed.
  12. L. Nielsen, S. Frokjaer, J. F. Carpenter and J. Brange, J. Pharm. Sci., 2001, 90, 29–37 CrossRef CAS.
  13. W. Dzwolak, A. Loksztejn and V. Smirnovas, Biochemistry, 2006, 45, 8143–8151 CrossRef CAS PubMed.
  14. J. L. Jimenez, E. J. Nettleton, M. Bouchard, C. V. Robinson and C. M. Dobson, Proc. Natl. Acad. Sci. U. S. A., 2002, 99, 9196–9201 CrossRef CAS PubMed.
  15. M. Bouchard, J. Zurdo, E. J. Nettleton, C. M. Dobson and C. V. Robinson, Protein Sci., 2000, 9, 1960–1967 CrossRef CAS PubMed.
  16. P. M. Jehle, C. Micheller, D. R. Jehle, D. Breiting and B. O. Boehm, Lancet, 1999, 354, 1604–1607 CrossRef CAS.
  17. P. Attri and P. Venkatesu, Process Biochem., 2013, 48, 462–470 CrossRef CAS PubMed.
  18. P. Attri and P. Venkatesu, Int. J. Biol. Macromol., 2012, 51, 119–128 CrossRef CAS PubMed.
  19. P. Attri, P. Venkatesu and A. Kumar, Phys. Chem. Chem. Phys., 2011, 13, 2788–2796 RSC.
  20. P. Attri, P. Venkatesu, A. Kumar and N. Byrne, Phys. Chem. Chem. Phys., 2011, 13, 17023–17026 RSC.
  21. P. Attri, P. Venkatesu and A. Kumar, Org. Biomol. Chem., 2012, 10, 7475–7478 CAS.
  22. T. Vasantha, P. Attri, P. Venkatesu and R. S. Rama devi, J. Chem. Thermodyn., 2012, 45, 122–136 CrossRef CAS PubMed.
  23. P. Attri and P. Venkatesu, Phys. Chem. Chem. Phys., 2011, 13, 6566–6675 RSC.
  24. T. Vasantha, P. Attri, P. Venkatesu and R. S. Rama Devi, J. Phys. Chem. B, 2012, 116, 11968–11978 CrossRef CAS PubMed.
  25. T. Vasantha, A. Kumar, P. Attri, P. Venkatesu and R. S. Rama Devi, Fluid Phase Equilib., 2012, 335, 39–45 CrossRef CAS PubMed.
  26. A. Kumar and P. Venkatesu, RSC Adv., 2013, 3, 362–367 RSC.
  27. R. D. Roger and K. R. Seddon, Science, 2003, 302, 792–793 CrossRef PubMed.
  28. A. Kumar, P. M. Reddy and P. Venkatesu, RSC Adv., 2012, 2, 6939–6947 RSC.
  29. C. Lange, G. Patil and R. Rudolph, Protein Sci., 2005, 14, 2693–2701 CrossRef CAS PubMed.
  30. D. Constatinescu, C. Herrmann and H. Weingartner, Phys. Chem. Chem. Phys., 2010, 12, 1756–1763 RSC.
  31. P. L. Nostro and B. W. Ninham, Chem. Rev., 2012, 112, 2286–2322 CrossRef PubMed.
  32. L. P. Breydo, A. A. Shevchenko and O. A. Kost, Russ. Chem. Bull., 1997, 46, 1339–1343 CrossRef CAS.
  33. L. Zhang, H. Jiang, W. Zhu, L. Wu, L. Song, Q. Wu and Y. Ren, Int. J. Mol. Sci., 2008, 9, 2376–2387 CrossRef CAS PubMed.
  34. E. P. Melo, M. R. Aires-Barros, S. M. B. Costa and J. M. S. Cabral, J. Biochem. Biophys. Methods, 1997, 34, 45–59 CrossRef CAS.
  35. L. P. Breydo, A. A. Shevchenko and O. A. Kost, Russ. Chem. Bull., 1997, 46, 1339–1343 CrossRef CAS.
  36. F. J. Deive, A. Rodriguez, A. B. Pererio, J. M. M. Araujo, M. A. Longo, M. A. Z. Coelho, J. N. Canongia Lopes, J. M. S. S. Esperanca, L. P. N. Rebelo and J. M. Marrucho, Green Chem., 2011, 13, 390–396 RSC.
  37. R. F. Chen, Anal. Lett., 1967, 1, 35–42 CrossRef CAS.
  38. I. B. Bekard and D. E. Dunstan, Biophys. J., 2009, 97, 2521–2531 CrossRef CAS PubMed.
  39. C. N. Pace, B. A. Shirley and J. A. Thomson, Measuring the conformational stability of a protein, in Protein Structure and Function: A Practical Approach, ed. T. E. Creighton, IRL Press, Oxford, 1989, pp. 311–330 Search PubMed.
  40. V. N. Uversky, L. N. Garriques, I. S. Millett, S. Frokjaer, J. Brange, S. Doniach and A. L. Fink, J. Pharm. Sci., 2003, 92, 847–858 CrossRef CAS PubMed.
  41. S. M. Kelly and N. C. Price, Curr. Protein Pept. Sci., 2000, 1, 349–384 CrossRef CAS.
  42. E. H. Strickland and D. Mercola, Biochemistry, 1976, 15, 3875–3884 CrossRef CAS.
  43. S. Grudzielanek, R. Jansen and R. Winter, J. Mol. Biol., 2005, 351, 879–894 CrossRef CAS PubMed.
  44. M. J. Ettinger and S. N. Timasheff, Biochemistry, 1971, 10, 824 CrossRef CAS.
  45. S. Wood, T. Blundell, A. Wollmer, N. Lazarus and R. Neville, Eur. J. Biochem., 1975, 55, 531–542 CrossRef CAS.
  46. E. H. Strickland, CRC Crit. Rev. Biochem., 1974, 2, 113–175 CrossRef CAS.
  47. S. Beychok, Proc. Natl. Acad. Sci. U. S. A., 1965, 53, 999–1006 CrossRef CAS.
  48. M. Muzaffar and A. Ahmad, PLoS One, 2011, 6, e27906 CAS.
  49. A. Ahmad, I. S. Millett, S. Doniach, V. N. Uversky and A. L. Fink, J. Biol. Chem., 2004, 279, 14999–15013 CrossRef CAS PubMed.
  50. F. Chiti and C. M. Dobson, Annu. Rev. Biochem., 2006, 75, 333–366 CrossRef CAS PubMed.
  51. A. Wollmer, J. Fleischhauer, W. Strassburger and H. Thiele, Biophys. J., 1977, 20, 233–243 CrossRef CAS.
  52. V. N. Uversky, L. N. Garriques, I. S. Millett, S. Frokjaer, J. Brange, S. Doniach and A. L. Fink, J. Pharm. Sci., 2003, 92, 847–858 CrossRef CAS PubMed.
  53. N. C. Kaarsholm, K. Norris, R. J. Jargensen, J. Mikkelsen, S. Ludvigsen, O. H. Olsen, A. R. Sarensen and S. Havelund, Biochemistry, 1993, 32, 10773–10778 CrossRef CAS.
  54. S. Grudzielanek, R. Jansen and R. Winter, J. Mol. Biol., 2005, 351, 879–894 CrossRef CAS PubMed.
  55. J. Goldman and F. H. Carpenter, Biochemistry, 1974, 13, 4566–4574 CrossRef CAS.
  56. P. Saisanker, A. Olienikova, H. Weingartner, R. Ravindra and R. Winter, Phys. Chem. Chem. Phys., 2004, 6, 1899–1905 RSC.
  57. M. A. Weiss, Q. X. Hua, W. Jia, Y. C. Chu, R. Y. Wang and P. G. Katsoyannis, Biochemistry, 2000, 39, 15429–15440 CrossRef CAS PubMed.
  58. Q. X. Hua, L. Narhi, W. Jia, T. Arakawa, R. Rosenfeld, N. Hawkins, J. A. Miller and M. A. Weiss, J. Mol. Biol., 1996, 259, 297–313 CrossRef CAS PubMed.
  59. Q. X. Hua, S. H. Nakagawa, W. Jia, S. Q. Hu, Y. C. Chu, P. G. Katsoyannis and M. A. Weiss, Biochemistry, 2001, 40, 12299–12311 CrossRef CAS PubMed.
  60. M. Noronha, J. C. Lima, P. Lamosa, H. Santos, C. Maycock, R. Ventura and A. L. Macüanita, J. Phys. Chem. A, 2004, 108, 2155–2166 CrossRef CAS.
  61. W. R. Laws, J. B. A. Ross, H. R. Wyssbrod, J. M. Beechem, L. Brand and J. C. Sutherland, Biochemistry, 1986, 25, 599–607 CrossRef CAS.
  62. O. J. Rolinski, M. Amaro and D. J. S. Birch, Biosens. Bioelectron., 2010, 25, 2249–2252 CrossRef CAS PubMed.
  63. M. Amaro, D. J. S. Birch and O. J. Rolinski, Phys. Chem. Chem. Phys., 2011, 13, 6434–6441 RSC.
  64. G. S. Harms, S. W. Pauls, J. F. Hedstrom and C. K. Johnson, J. Fluoresc., 1997, 7, 273–281 CrossRef CAS.
  65. F. C. Marincola, C. Piras, O. Russina, L. Gontrani, G. Saba and A. Lai, ChemPhysChem, 2012, 13, 1339–1346 CrossRef CAS PubMed.
  66. M. Guangxiu and Z. Anfeng, Iran. J. Chem. Chem. Eng., 2013, 32, 77–82 Search PubMed.
  67. N. M. Vaghela, V. Sastry and V. K. Aswal, Colloid Polym. Sci., 2010, 289, 309–322 Search PubMed.
  68. E. M. Nordwald and J. L. Kaar, J. Phys. Chem. B, 2013, 117, 8977–8986 CrossRef CAS PubMed.
  69. R. Huang, S. Zhang, L. Pan, J. Liu, F. Liu and H. Liu, Spectrochim. Acta, Part A, 2013, 104, 377–382 CrossRef CAS PubMed.
  70. S. Bose, D. W. Armstrong and J. W. Petrich, J. Phys. Chem. B, 2010, 114, 8221–8227 CrossRef CAS PubMed.
  71. G. A. Baker and W. T. Heller, Chem. Eng. J., 2009, 147, 6–12 CrossRef CAS PubMed.
  72. K. Tamura, N. Nakamura and H. Ohno, Biotechnol. Bioeng., 2012, 109, 729–735 CrossRef CAS PubMed.
  73. T. Vasantha, A. Kumar, P. Attri, P. Venkatesu and R. S. Rama Devi, Protein Pept. Lett., 2013 DOI:10.2174/09298665113209990071.

This journal is © The Royal Society of Chemistry 2014
Click here to see how this site uses Cookies. View our privacy policy here.