A natural template approach to mesoporous carbon spheres for use as green chromatographic stationary phases†
Andrew S.
Marriott
ab,
Ed
Bergström
b,
Andrew J.
Hunt
a,
Jane
Thomas-Oates
b and
James H.
Clark
*a
aGreen Chemistry Centre of Excellence, Department of Chemistry, University of York, Heslington, York YO10 5DD, UK. E-mail: james.clark@york.ac.uk
bCentre of Excellence in Mass Spectrometry, Department of Chemistry, University of York, Heslington, York YO10 5DD, UK
First published on 5th November 2013
Abstract
This study reports the development of calcium alginate-based highly mesoporous carbon spheres (AMCS). These materials exhibit significant potential in chromatographic applications and demonstrated similar efficiency to commercially available porous graphitic carbon (PGC) and are superior to Starbon® materials in separation of polar carbohydrate analytes. The AMCS exhibit a narrow particle size distribution, are highly spherical and exhibit extensive mesoporous networks (up to ca. 90% mesoporosity). It is shown how calcium content can significantly influence the textural properties of the resulting AMCS materials. The AMCS production process requires no additional templating agents and temperatures of only 800 °C. In contrast, PGC are manufactured through an energy-intensive manufacture process, which requires a hard-templated mesoporous carbon intermediate to be pyrolysed to over 2000 °C under argon. Thus AMCS demonstrate promise as a green alternative to PGC in chromatographic applications.
1. Introduction
Ordered mesoporous carbons (OMCs) are used industrially for a wide range of applications, from heterogeneous catalysis and energy storage to waste stream adsorption or separations media.1 There are a number of synthesis routes to OMCs that can be split into two types of technique, “hard”-templating or nanocasting (using pre-synthesised solid organic or inorganic templates) and “soft”-templating (generated through organic molecule self-assembly).One of the first examples of hard-templating was the development of glassy porous carbon by Knox and coworkers in the 1980s,2 and its evolution to porous graphitic carbon (PGC), commercialized as “Hypercarb™” by the end of the decade, from which research in the area of templated mesoporous carbon synthesis has since grown.3 This includes the development of materials using the silica templates MCM (a hexagonally structured cylindrical mesoporous silica developed by the Mobil Corporation) and SBA (a hexagonally structured mesoporous molecular sieve developed at the University of California, Santa Barbara, USA).4 The use of silica gel beads by Knox to accurately control the mesoporosity (ca. 14 nm) and particle size (ca. 5 μm) led to the development of PGC as a liquid chromatography (LC) stationary phase. There has been significant interest over the past decades in this application owing to its unique mechanism of separation of polar compounds under mass spectrometry-compatible reversed-phase conditions, as well as its robustness and capacity to function over the entire pH range.2,3 Although there are obvious advantages to this material, the energy intensive production of these materials, requiring pyrolysis above 2000 °C to minimise microporosity (which could lead to irreversible binding within the high energy small pore dimensions) is inaccessible using conventional laboratory ovens.5
An alternative approach proposed by White et al., uses alginic acid-derived mesoporous carbon, termed Starbon® as an LC stationary phase.6 Alginic acid is an algal polysaccharide composed of homo-and hetero-polymeric blocks of two hexuronic monomers: β-D-mannuronic acid (M) and α-L-guluronic acid (G) (Fig. 1). White reported that chromatography using a column packed with this material resembled that of a commercial Hypercarb™ PGC column.6 The surface chemistry of Starbon® can be altered, depending on pyrolysis temperature which allows tuning of these materials to meet specific chromatographic demands. The material which gave the chromatography comparable with that from a commercial PGC column had been pyrolysed to only 1000 °C, representing a significant reduction in energy consumption when compared with PGC. The production of Starbon® depends on a natural template process based on the formation of a porous hydrogel network when alginic acid is mixed with water heated to 90 °C. The advantage to this is that the pore network is hierarchical, composed of a macroporous/mesoporous outer domain, giving way to a mesoporous inner domain. This type of pore network can enhance mass transfer efficiency, and so is advantageous for fast and well-resolved separations.6
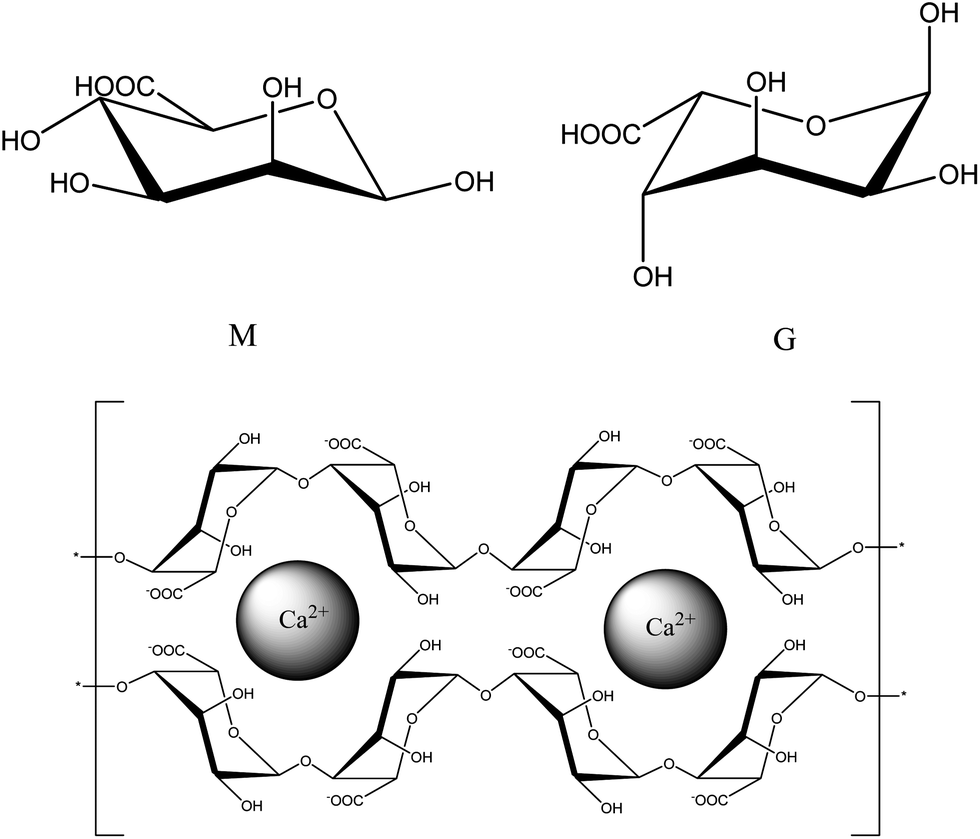 | ||
| Fig. 1 Structure of β-D-mannuronic acid (M) (TOP LEFT), structure of α-L-guluronic acid (G) (TOP RIGHT). Representation of “egg-box” model binding of α-L-guluronic acid blocks to calcium ions in alginic acid (BOTTOM). | ||
However, a disadvantage to natural templating is that the overall particle size and morphology cannot be easily controlled; these materials tend to exhibit a broad particle size range, from fines (<1 μm) to particles over 100 μm, and show a wide variation in particle shape, from spherical to rod shaped. The shape and size spread reduces column packing efficiencies which in turn affects column flow characteristics and leads to peak broadening during chromatography, which ultimately reduces peak resolution. Therefore, a strategy which both retains the pore networks generated by natural templating and allows for better morphology and size control is required.
In this study, we report a proof-of-concept development of a method for producing mesoporous carbon spheres using a natural template process, which draws inspiration from the food industry as well as drug delivery vehicles by utilizing the droplet formation of calcium alginate beads.7,8 Calcium alginate gains structural rigidity chiefly through the interaction between the divalent calcium cation and regions of poly-G blocks in an arrangement described by the “egg-box” model (Fig. 1).9 Therefore, an investigation into the effect of calcium content on the structural properties of the alginate beads was required. The production of calcium alginate beads is known,10 however to the best of our knowledge this is the first report of these beads being pyrolysed and the effects of calcium content on the final pyrolysed material studied. The developed method delivers consistent particle morphology and size reproducibility whilst retaining the high mesoporosity and low pyrolysis temperatures of Starbon® . The effect of calcium content on porosity is discussed and the application of these materials as an LC stationary phase is described.
2. Results and discussion
2.1. Formation of alginic acid-derived mesoporous carbon spheres
Alginic acid-derived mesoporous carbon spheres (AMCS) were formed by spraying a solution of sodium alginate into a calcium chloride solution to create calcium alginate hydrogel spheres. The subsequent washings, solvent exchange and scCO2 drying generated a porous calcium alginate aerogel. Pyrolysis under a nitrogen atmosphere to 800 °C at a rate of 1 K min−1 yielded AMCS. Scanning electron microscopy (SEM) of these AMCS materials were compared to Starbon® pyrolysed to 800 °C (Fig. 2). | ||
| Fig. 2 SEM images of alginic acid-derived mesoporous carbon (Starbon® ) (A) ×250 and (B) ×6000 magnification and AMCS (C) ×250 and (D) ×5000 magnification. Both samples were pyrolysed to 800 °C. | ||
The Starbon® images (Figure 2A and B) show the highly varied particle morphology of the material and agglomeration of particles is visible. In contrast, the AMCS images (Figure 2C and D) show spherical/teardrop particles with negligible agglomeration. At medium magnification, both Starbon® and AMCS show an expanded open pore structure. Particle size distribution and circularity (a measure of the “roundness” of a particle on a scale of 0 to 1, with 1 defined as a perfect sphere) data were collected for the AMCS and Starbon® samples, as well as a commercial PGC sample (Hypersil PGC, 5 μm particle size, Hypersil, Runcorn, UK) (Table 1). The data indicates that both Starbon® and AMCS have distinctly larger mean particle diameters than the commercial PGC material; however AMCS show a smaller and narrower distribution of particle sizes than the Starbon® material, which is consistent with the observations of SEM analysis. AMCS demonstrated more consistently spherical particles (based on a higher circularity value and narrower standard deviation) compared to that of the commercial PGC. Although no SEM images were taken of the commercial Hypersil PGC material, what is known about the synthesis of these materials and the Particle Insight analysis suggests that this material is similar in nature to that reported by Knox and co-workers for porous graphitic carbon.2
2.2. Investigation of calcium removal on material structural properties
Calcium ions trapped within regions of poly-G blocks in an arrangement described by the “egg-box” model gives rise to the structural stability of calcium alginate.9 The effect of calcium content on the structural properties of the materials was investigated by washing the spheres, before solvent exchange, with hydrochloric acid (HCl) at 0.1 M and 0.5 M, with the intention of removing some of the calcium. The AMCS were washed up to three times with either the 0.1 M HCl or 0.5 M HCl acid solution and the resulting material investigated at the aerogel precursor stage as well as after pyrolysis.Fourier-transform infrared (FT-IR) spectroscopy of the unwashed precursor shows that it is indistinguishable from a commercial calcium alginate standard (see electronic supplementary information Fig. S2†). FT-IR spectra of the samples during progressive washings with 0.1 M HCl are shown in Fig. 3. Reduced intensity of the bands at 1595 cm−1 (assigned to the carboxylate anion (COO−) asymmetric stretch vibration11) and 1418 cm−1 (assigned to a combination of the C–OH deformation vibration and carboxylate symmetric stretch vibration) coupled with an increase in the intensity of the band at 1733 cm−1 (assigned as a protonated carboxylic acid vibration) indicates the progressive removal of calcium as the number of acid washes increases. These transitions appear to correlate with those reported by Huang et al. albeit for the acid-washing of sodium alginate.12 The FT-IR spectra of the samples washed with 0.5 M HCl were identical to the spectrum of the 0.1 M HCl sample washed three times.
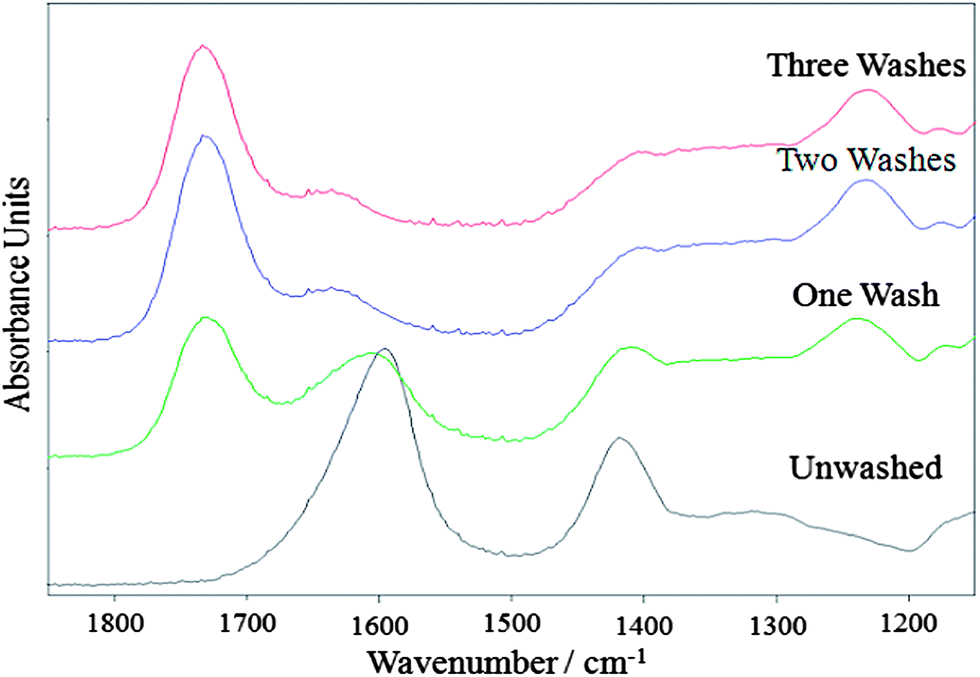 | ||
| Fig. 3 FT-IR spectra of calcium alginate aerogel precursor after incremental washings with 0.1 M HCl. Spectra have been offset on the absorbance axis, to allow comparison. | ||
N2 adsorption porosimetry was used to assess the effect of calcium removal on the pore network of the aerogel precursor (Table 2). All samples present highly mesoporous networks (average pore diameters within the 2–50 nm mesopore range, as defined by IUPAC13) with deep open access demonstrated by large pore volumes between 2.80 and 4.10 cm3 g−1, equivalent to ≥ 95% of the total pore volume.
| Samplea | Concentration of HCl/M | No. of washes | SBETb/m2 g−1 | V meso c/cm3 g−1 | PDd/nm | Meso/Macroe/% |
|---|---|---|---|---|---|---|
| a x − y: x = concentration of HCl, y = no. of washes. b BET surface area. c BJH nitrogen desorption data. d BJH average desorption pore diameter. e 100 – ((volume desorbed/total volume adsorbed) × 100). | ||||||
| Aerogel precursor | Unwashed | 404 | 4.01 | 35.60 | 96 | |
| 0.1 | 1 | 343 | 2.93 | 34.91 | 95 | |
| 0.1 | 2 | 311 | 3.74 | 32.13 | 96 | |
| 0.1 | 3 | 295 | 2.83 | 27.41 | 96 | |
| 0.5 | 1 | 311 | 3.24 | 34.87 | 96 | |
| 0.5 | 2 | 289 | 2.91 | 31.68 | 96 | |
| 0.5 | 3 | 295 | 3.33 | 30.33 | 96 | |
| Carbonised Material (AMCS) | Unwashed | 561 | 1.20 | 12.49 | 81 | |
| 0.1 | 1 | 515 | 2.23 | 19.80 | 90 | |
| 0.1 | 2 | 498 | 0.71 | 15.94 | 74 | |
| 0.1 | 3 | 481 | 0.36 | 15.22 | 59 | |
| 0.5 | 1 | 431 | 0.97 | 16.84 | 81 | |
| 0.5 | 2 | 475 | 0.40 | 13.52 | 61 | |
| 0.5 | 3 | 415 | 0.02 | 4.52 | 7 | |
The effect of calcium content is marked with regards to average pore diameter and to a lesser extent surface area, both showing a downward trend as the number of washes increases for both concentrations of HCl. It is proposed that the observed trends are due to the increased disorder of the poly-G regions within the gel as a result of calcium removal, which compromises the structural integrity of the resultant gel.
It is unclear why the unwashed material does not show even higher pore volume and diameter, but it can be speculated that the high concentration of calcium (that imparts rigidity to the poly-G regions of the precursor material) causes a reduction in the ability of the spheres to expand and contract during pyrolysis, which lead to a weaker overall structure. Of interest is the 0.5 M three times washed sample, which showed an almost complete breakdown of mesoporous structure and therefore highlights that there is a minimum calcium content required in the alginate polymer in order to generate material rigidity.
The knowledge of calcium content effect on the pore structure of these materials, coupled with the observed changes in surface chemistry during pyrolysis enhances the tuning capabilities of AMCS extending the application potential of these materials beyond chromatographic stationary phases.6
2.3. Application of AMCS as a chromatography stationary phase
| Carbohydrate standard | Observed Molecular Species/m/z | AMCS tR/min | Starbon®tR/min | Commercial PGC tR/min |
|---|---|---|---|---|
| Glucose | 225 [M + HCOO]− | 4.9 | 2.6 | 3.9 |
| Mannitol | 227 [M + HCOO]− | 5.1 | 2.7 | 3.5 |
| Sucrose | 387 [M + HCOO]− | 8.4 | 8.6 | 8.6 |
| Maltitol | 389 [M + HCOO]− | 8.2 | 8.5 | 8.5 |
| Raffinose | 549 [M + HCOO]− | 8.8 | 8.6 | 9.2 |
| Stachyose | 711 [M + HCOO]− | 8.8 | 8.6 | 9.1 |
| Verbascose | 873 [M + HCOO]− | 8.9 | 8.7 | 9.2 |
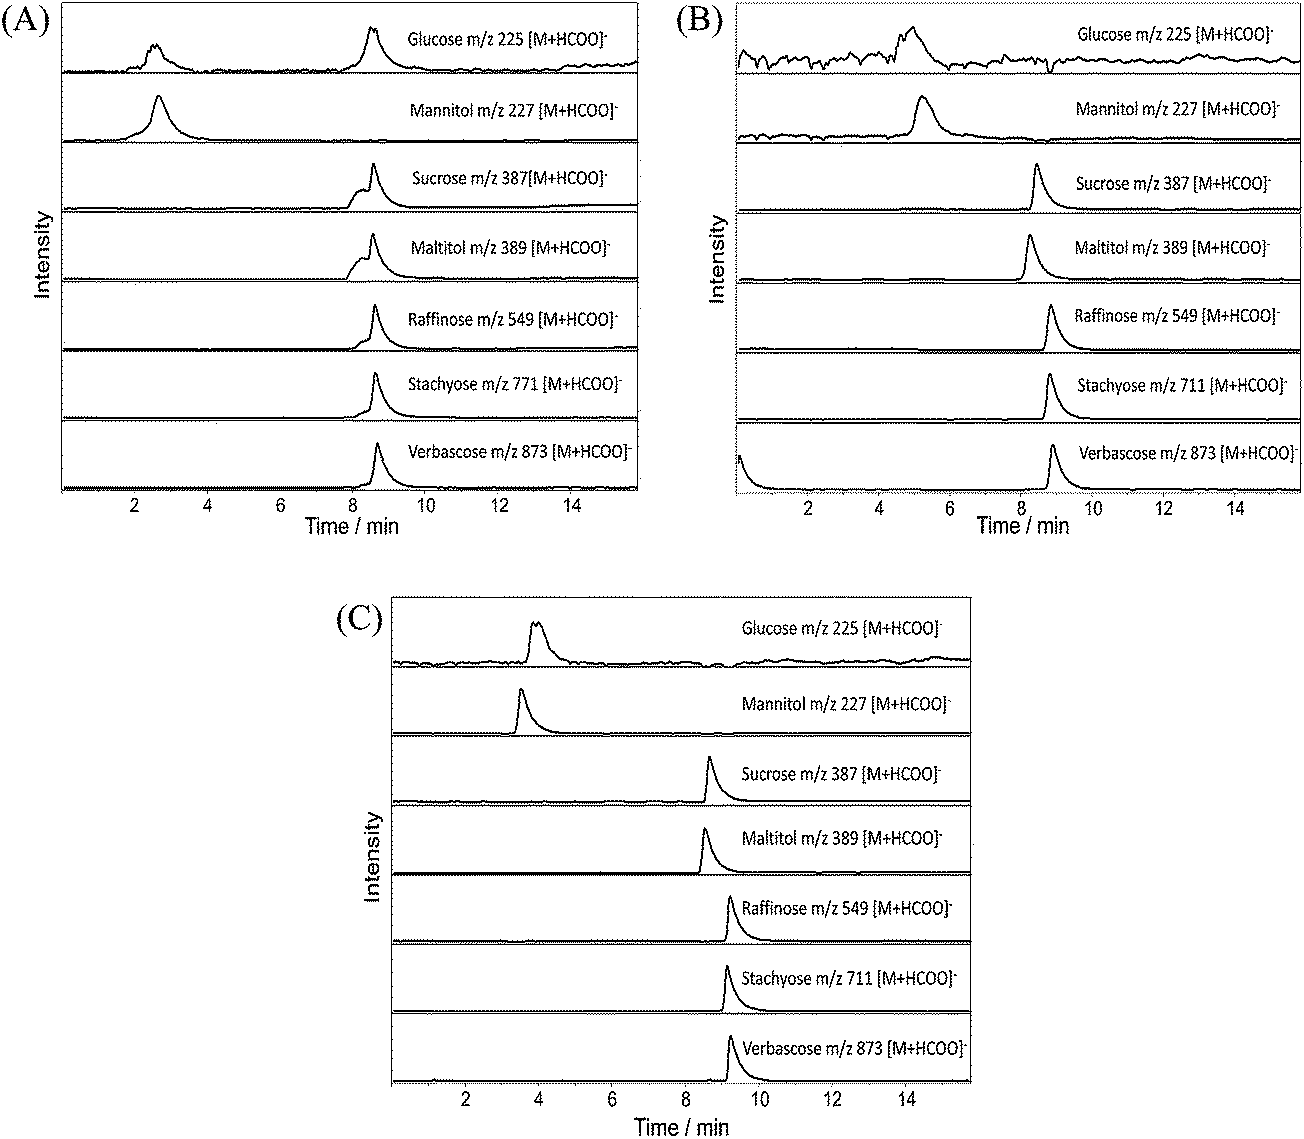 | ||
| Fig. 4 Extracted ion chromatograms of 50 μg mL−1 standard solution of a mixture of glucose, mannitol, sucrose, maltitol, raffinose, stachyose and verbascose obtained on the (A) Starbon® -LC-MS, (B) AMCS-LC-MS and (C) PGC-LC-MS system. | ||
The seven analytes elute in a similar order from the three systems, with maltitol eluting marginally earlier than sucrose and raffinose, stachyose and verbascose co-eluting. The spread of retention times for these five analytes is narrower for the Starbon® -LC-MS system (0.2 min) than for the other two systems (0.7 min), which could indicate limited resolving power for the Starbon® -LC-MS system. The largest variation in retention times over the three systems are seen for glucose and mannitol, with the AMCS-LC-MS system (4.9 min and 5.1 min respectively) retaining these analytes longer than the PGC-LC-MS (3.9 min and 3.5 min) and Starbon® -LC-MS (2.6 min and 2.7 min) systems. A combination of stationary phase packing efficiency of the Starbon® material and the presence of highly adsorbent micropores in the AMCS material may explain this variation.
A second m/z 225 peak is observed in the Starbon® -LC-MS chromatogram, at the retention time of the several oligosaccharide peaks (ca. 8.6 min). This second m/z 225 peak is likely to be a formylated Y1 fragment ion (which has the same m/z value as a Glc formylated molecule), arising as a result of in-source fragmentation of the larger oligosaccharide species. This observation was reproducible over several injections of the standard mixture, and is not an unusual observation;14 the additional peak is not observed if pure Glc is injected and only appears in the presence of the larger species (data not shown). The column experiments were not performed back-to-back. As such, conditional changes which may have arisen between each experiment could account for the absence of the second m/z 225 peak in either the AMCS-LC-MS and PGC-LC-MS systems. Although longer retention times for glucose and mannitol were observed for the AMCS-LC-MS system than the PGC-LC-MS system, shorter times were recorded for the remaining analytes. These observations are likely a result of higher adsorption energy micropores retaining the smaller analytes for longer, whilst the shorter retention times likely reflect the reduced packing density of particles in the AMCS column in comparison to the PGC column.
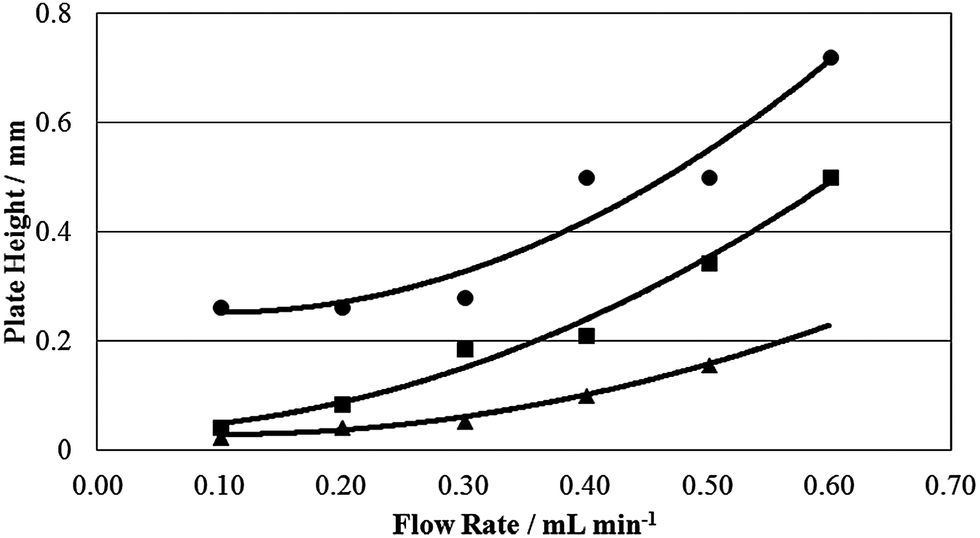 | ||
| Fig. 5 Van Deemter curves for a 50 μg mL−1 sucrose standard solution eluting at various flow rates from the AMCS-LC-MS (■), Starbon® -LC-MS (●) and PGC-LC-MS (▲) systems. | ||
The curve for the Starbon® -LC-MS system starts at a much larger plate height value than the other two systems, which implies that eddy diffusion contributes more to peak broadening in the Starbon® -LC-MS than in the AMCS-LC-MS and PGC-LC-MS systems. This may be as a result of the wide particle size distribution and poor particle shape limiting the ability to efficiently pack this material into a column. This fits well with the poor peak shape and resolution observed in the chromatography. At low flows, the AMCS-LC-MS system has a plate height value which closely resembles that of the PGC-LC-MS system indicating that the packing efficiency is much better with this material. The slight difference is probably a result of the larger particle sizes in the AMCS-LC-MS system, which will leave larger interstitial gaps between stationary phase particles.
In terms of the steepness in the curvature of the lines, the AMCS-LC-MS system resembles that of the Starbon® -LC-MS system and contrasts with the flatter trend for the PGC-LC-MS system. This indicates that the PGC-LC-MS system is affected by the mass transfer effect to a much lesser extent than the other two systems, which could be due to the templated mesopore structure of commercial PGC which means the analyte/stationary phase interaction will be consistent throughout the material. In contrast, the AMCS and Starbon® materials are predominantly mesoporous with some microporosity. It may be that interaction with the more strongly adsorbing micropores could lead to peak broadening at higher flow rates. In addition, the larger average particle diameters of the AMCS and Starbon® materials in comparison to PGC mean that pathlengths through the particles are longer, which lengthens the time it takes to establish an equilibrium between the analyte and the mobile phase into which the analyte would be transferred. The AMCS materials demonstrate significant promise as green replacements to PGC in chromatographic applications; however, further work is required to reduce particle sizes and thus enable these materials to realise their full potential.
3. Experimental
Preparation of porous Ca alginate spheres
Sodium alginate (Sigma-Aldrich) was mixed in deionised water (1 g: 50 mL sodium alginate: water ratio) to a viscous solution. The solution was passed through an electrospray ionization emitter source (from a Bruker HCT mass spectrometer) with no spray voltage applied at 1 mL min−1 using a constametric 3200 solvent delivery system (LDC Analytical). The solution was nebulized using 9 psi air, sprayed into a constantly-stirred solution of 0.24 M calcium chloride and cured in solution for 24 h to prepare hydrogel spheres of calcium alginate. The hydrogel spheres were transferred into deionised water and washed. At this stage the spheres were acid-washed using hydrochloric acid (0.1 M or 0.5 M), 0, 1, 2 or 3 times, to investigate their effect in reducing the calcium content of the material. The removal of water was performed by solvent exchange with ethanol, a lower surface tension solvent, using a method reported previously.16 The excess solvent of the resulting alcogel was removed by Buchner filtration before the material was dried using scCO2. The drying was performed using a Thar SFE-500 supercritical extractor heated to 40 °C at a pressure of 120 Bar for 4 h under dynamic flow conditions (40 g min−1 CO2). The extractor was depressurized slowly over 12 h.Preparation of carbonaceous porous calcium alginate spheres
Material was prepared by heating under a N2 atmosphere (N2 flow: 150 mL min−1) in a ceramic furnace which contained a quartz round bottomed flask. All samples were pyrolysed to 800 °C at a rate of 1 °C min−1 followed by a hold of 20 min.Preparation of alginic acid-derived mesoporous carbon
Alginic acid from brown algae (Sigma Aldrich) was mixed in deionised water (1 g: 20 mL alginic acid:water ratio). The mixture was stirred for two hours at 90 °C. The resultant sol gel was then cooled for a minimum of 24 h at 5 °C. Solvent exchange, scCO2 drying and pyrolysis were carried out as above.N2 sorption analysis
Porosimetry analysis was performed using a Micromeritics TriStar instrument. Samples were degassed at room pressure, at either 110 °C for 8 h for non-pyrolysed materials or 160 °C for 6 h for pyrolysed materials prior to analysis.X-ray fluorescence (XRF) spectrometry
XRF spectrometry was performed using a Rigaku NEX-CG XRF spectrometer fitted with a 50 W X-ray tube with Pd anode. Samples were filled into 32 mm sample cups to a depth of 10 mm. Data were analysed (i.e. elemental quantification and peak fitting routines) using RPF-SQX software.Scanning electron microscopy
Images were obtained from a JEOL 6490LV SEM system. Samples were sputter-coated with gold/palladium before analysis.Fourier-transform infrared (FT-IR) spectroscopy
Spectra were recorded using a Bruker Vertex 70 FT-IR spectrometer fitted with an attenuated total reflectance (ATR) golden gate attachment with diamond top plate analysis window. Resolution was 4 cm−1 and 64 scans were averaged to obtain the spectra in the 4000–600 cm−1 range. Spectra were recorded using a blank analysis window as a reference.Liquid chromatography-mass spectrometry conditions
The analytical grade water and solvents used for chromatography were purchased from Fisher (Fisher Scientific, Loughborough, UK). The carbohydrate standards glucose, mannitol, maltitol, raffinose, stachyose and verbascose were purchased from Sigma Aldrich (Poole, UK); sucrose was purchased from BDH (Poole, UK). Standard stock solutions were prepared in water at a concentration of 1.0 mg mL−1 and stored at −20 °C prior to use. The 50 μg mL−1 standard mixture solution and sucrose standard solution were prepared for analysis by dilution of the standards in HPLC grade water. LC-MS analyses were performed on a Dionex U3000 HPLC system coupled to a Bruker HCT-QIT-MS with an ESI interface. Analytes were detected in the negative ion mode using the following MS parameters: Capillary voltage, 3000 V; nebulizer gas, 20 psi; drying gas, 8.0 L min−1 and drying gas temperature, 350 °C. Mass spectra were acquired over the scan range m/z 50–2000. The binary mobile phase system consisted of (A) water modified with 0.1% (v/v) formic acid and (B) acetonitrile modified with 0.1% (v/v) formic acid. The gradient elution profile, modified from Antonio et al., was as follows: t = 0–5 min 1–4% B, t = 5–7 min 4–25% B, held at 25% B for 3 min, t = 10–12 min 25–50% B, held at 50% B for 4 min, t = 16–18 min 50–1% B, maintained for 10 min.17 Flow rate was 600 μL min−1. For the van Deemter curve data, isocratic elution at 10% B for 20 min was used at flow rates of 100, 200, 300, 400, 500 and 600 μL min−1.4. Conclusion
In summary, the work presented here utilizes an inexpensive, readily available biomass-derived feedstock (sodium alginate), natural solvents (water, ethanol and supercritical CO2 (scCO2)) and nebulising spray technology to prepare a highly spherical mesoporous polysaccharide precursor. Pyrolysis of the precursor, under an inert atmosphere, at significantly lower temperatures to PGC, yields novel porous carbonaceous spheres via a “natural” templating process, made possible by the structural properties of the alginate precursor. By controlling the calcium content of the precursor a new method to tune material structure has been described which extends the remit of possible applications for this type of carbon. Further work to understand the chemical microstructure of Starbon® and AMCS materials, including the type of calcium species present, their distribution, and their effect on the surface chemistry of these materials is currently in progress.The application of this material to chromatography and comparison of its performance with that of a commercial PGC column and an alginic acid-derived Starbon® column has been demonstrated with the separation of a standard carbohydrate mixture. The performance of the porous carbon spheres was found to more closely resemble that of commercial PGC than of alginic acid-derived Starbon® and they represent a promising step forward in the development of a more environmentally friendly biomass-derived carbon stationary phase.
Acknowledgements
A. S. Marriott would like to thank the BBSRC for DTA doctorate funding. Ms. M. Stark (Technology Facility, Department of Biology, the University of York, UK) is gratefully acknowledged for her contribution and support with regards to the electron microscopy. Mr C. Pilkington (Micromeritics Ltd, UK) is thanked for performing particle size and shape measurements. Ken Butchart (Fortis Technologies, UK) is also thanked for his time and efforts in packing the experimental materials into chromatography columns.References
- C. Liang, Z. Li and S. Dai, Angew Chem., Int. Ed., 2008, 47, 3696 CrossRef CAS PubMed.
- J. H. Knox, K. K. Unger and H. Mueller, J. Liq. Chromatogr., 1983, 6, 1 Search PubMed; J. H. Knox, B. Kaur and G. R. Millward, J. Chromatogr., 1986, 352, 3 CrossRef CAS.
- C. West, C. Elfakir and M. Lafosse, J. Chromatogr., A, 2010, 1217, 3201 CrossRef CAS PubMed; P. Ross and R. E. Majors, LC·GC Eur., 2000, 13, 310 Search PubMed.
- R. Ryoo, S. H. Joo and S. Jun, J. Phys. Chem. B, 1999, 103, 7743 CrossRef CAS; S. Jun, S. J. Joo, R. Ryoo, M. Kruk, M. Jaroniec, Z. Liu, T. Ohsuna and O. Terasaki, J. Am. Chem. Soc., 2000, 122, 10712 CrossRef.
- S. Lowell and J. E. Shields, in Powder Surface Area and Porosity, ed. B. Scarlett, Chapman and Hall, New York, USA, 2nd edn, 1984, ch. 12, pp. 128–131 Search PubMed.
- R. J. White, C. Antonio, V. L. Budarin, E. Bergström, J. Thomas-Oates and J. H. Clark, Adv. Funct. Mater., 2010, 20, 1834 CrossRef CAS.
- K. I. Draget, O. Smidsrød and G. Skjåk-Bræk, in Polysaccharides and Polyamides in the Food Industry: Properties, Production, and Patents, ed. A. Steinbüchel and S. K. Ree, Wiley-VCH, Weinheim, Germany, 2005, ch. 1, pp. 22–23 Search PubMed.
- H. H. Tønnesen and J. Karlsen, Drug Dev. Ind. Pharm., 2002, 28, 621 CrossRef CAS PubMed; E. Bulut and O. Sanli, Asian J. Chem., 2013, 25, 3993 CrossRef.
- G. T. Grant, E. R. Morris, D. A. Rees, P. J. C. Smith and D. Thom, FEBS Lett., 1973, 32, 195 CrossRef CAS.
- F. Quignard, R. Valentin and F. Di Renzo, New J. Chem., 2008, 32, 1300 RSC.
- E. Gómez-Ordóñez and P. Rupérez, Food Hydrocolloids, 2011, 25, 1514 CrossRef PubMed.
- R. Y. M. Huang, R. Pal and G. Y. Moon, J. Membr. Sci., 1999, 160, 101 CrossRef CAS.
- IUPAC Manual of Symbols and Terminology, Appendix 2, Pt. 1, Colloid and Surface Chemistry. Pure Appl. Chem., 1972, 31, 578.
- C. Antonio, T. Larson, A. Gilday, I. Graham, E. Bergström and J. Thomas-Oates, Rapid Commun. Mass Spectrom., 2008, 22, 1399 CrossRef CAS PubMed.
- J. J. Van Deemter, F. J. Zuiderweg and A. Klinkenberg, Chem. Eng. Sci., 1956, 5, 271 CrossRef CAS.
- M. Robitzer, L. David, C. Rochas, F. Di. Renzo and F. Quignard, Langmuir, 2008, 24, 12547 CrossRef CAS PubMed.
- C. Antonio, C. Pinheiro, M. M. Chaves, C. P. Ricardo, M. F. Ortuño and J. Thomas-Oates, J. Chromatogr., A, 2008, 1187, 111 CrossRef CAS PubMed.
Footnote |
| † Electronic supplementary information (ESI) available: Percentage calcium contents of AMCSs determined by XRF analysis, FT-IR comparison between a commercial calcium alginate standard and calcium alginate aerogel precursor. See DOI: 10.1039/c3ra44428g |
| This journal is © The Royal Society of Chemistry 2014 |