 Open Access Article
 This Open Access Article is licensed under a
 Creative Commons Attribution 3.0 Unported Licence
Molecularly imprinted polymer–Ag2S nanoparticle composites for sensing volatile organics
Ghulam
Mustafa
and
Peter A.
Lieberzeit
*
University of Vienna, Department of Analytical Chemistry, Waehringer Strasse 38, A-1090 Vienna, Austria. E-mail: peter.lieberzeit@univie.ac.at; Fax: +43 142779523; Tel: +43 1427752341
First published on 20th February 2014
Abstract
Polyurethane-based molecularly imprinted polymers (MIP) and Ag2S nanoparticles (NP) form a nanocomposite that is suitable for detecting vapours of aliphatic alcohols with quartz crystal microbalance (QCM) sensors. The resulting sensor responses are almost three times higher than the average response of its two constituents: the composite leads to a normalized response of −70 Hz towards 400 ppm 1-butanol vapour in air, which is two times more than for a pure NP layer of the same thickness and four times higher than the response of the MIP. Furthermore, the MIP leads to structural selectivity that strongly prefers 1-butanol over 2-butanol due to the branched structure of the latter. Selectivity reaches a factor of almost five.
Introduction
It is well-known that the properties of nanomaterials substantially differ from those of the respective bulk matrix. This is caused by their high surface-to-volume ratio, strong adsorption efficiency and high surface reactivity.1–3 Among other application areas for nanoparticles, chemical sensors using them as recognition layers are currently attracting substantial scientific interest.4–7 The high specific surface of those sensing materials leads to substantially increased active interfaces as compared to “classical” thin films and hence increased sensitivity.8–11 Both sensitivity and selectivity can be tuned by exploiting affinity interactions between sensor layer and analyte, based e.g. on hydrophilic or hydrophobic properties.12 The idea can be extended to other types of non-covalent interaction, which ultimately leads to biomimetic receptors.13–22 A different approach aims at combining the properties of two or more materials, resulting e.g. in inorganic–organic composite microspheres.23,24 Recently substantial efforts have been made to integrate inorganic nanoparticles into polymer matrices to generate inorganic–organic composites.25 Numerous methods including physical vapor deposition, chemical vapor deposition, wet-chemical processes etc. are suitable for fabricating such composite materials in order to achieve improved structural and chemical properties.26–28 In going from microscale to nanoscale, several papers have explored composites of nanoparticles and/or carbon nanotubes and polymers.29–31 Very recently, Xu et al. published a paper on core–shell nanoparticles with a shell consisting of molecularly imprinted polymers for catalytic purposes.32 Another approach e.g. aims at detecting cytochrome c by introducing CdTe quantum dots as fluorescence probes into a MIP33 hence integrating recognition layer and transducer. A somewhat similar approach mixes gold nanoparticles coated with electropolymerized chitosan and graphene, respectively, to electrochemically detect erythromycin.34 In both cases the nanoparticles blended into the matrix hence can be regarded as an indicator helping to detect changes in the matrix during recognition. In contrast to this we aim at blending metal sulfide nanoparticles (in this case Ag2S) with molecularly imprinted polymers (MIP) as shown in Fig. 1 to assess whether the composite “just” leads to combined recognition properties or whether the whole material can be regarded more than the sum of its parts when applying it as a sensitive material to detect vapours of aliphatic alcohols. | ||
| Fig. 1 Schematic diagram of nanocomposite generation. | ||
Results and discussion
Previous work on gas sensing with MoS2 nanoparticles35 showed that controlling the exact stoichiometry of an affinity material is imperative for achieving optimal sensor responses. Therefore Fig. 2(A) shows a typical powder XRD pattern of as-synthesized Ag2S nanoparticles where (a) denotes the sample peaks; (b) is the reference from database, (c) is the difference between sample and reference peaks and (d) shows the corresponding Bragg-positions. The strong overlap between the database spectrum and the actually measured XRD pattern clearly shows that indeed Ag2S has been synthesized. Furthermore, no diffraction peaks unrelated to Ag2S can be seen thus confirming that synthesis resulted in the pure compound. Such nanoparticles show very appreciable affinity interactions towards alcohols as can be seen in Fig. 2(B). Obviously, the sensing channel of a 10 MHz quartz crystal microbalance (QCM) coated with Ag2S leads to substantially higher frequency shifts, than the respective uncoated reference channel when exposed to dry air containing 400 ppm 1-butanol vapour. | ||
| Fig. 2 XRD powder diffraction pattern of Ag2S nanoparticles where (a) is the sample peaks; (b) is the reference from database, (c) is the difference between sample and reference peaks and (d) shows the Bragg-positions. | ||
Coating experiments revealed that the silver sulfide nanoparticles can be readily blended with oligomeric MIP precursors. The composite hardens without problems leading to thin films after spin coating. Fig. 3 summarizes the surface morphologies of such composites as obtained by AFM: Fig. 3(A) shows a MIP thin film without silver sulfide nanoparticles, whereas Fig. 3(B) depicts the composite consisting of same amounts of polymer and nanoparticles, respectively. One can clearly see nanoparticles embedded in the thinner parts of the MIP. So both straightforward synthesis and these AFM images both underpin the feasibility of the synthetic approach and strongly indicate that indeed a composite has been achieved.
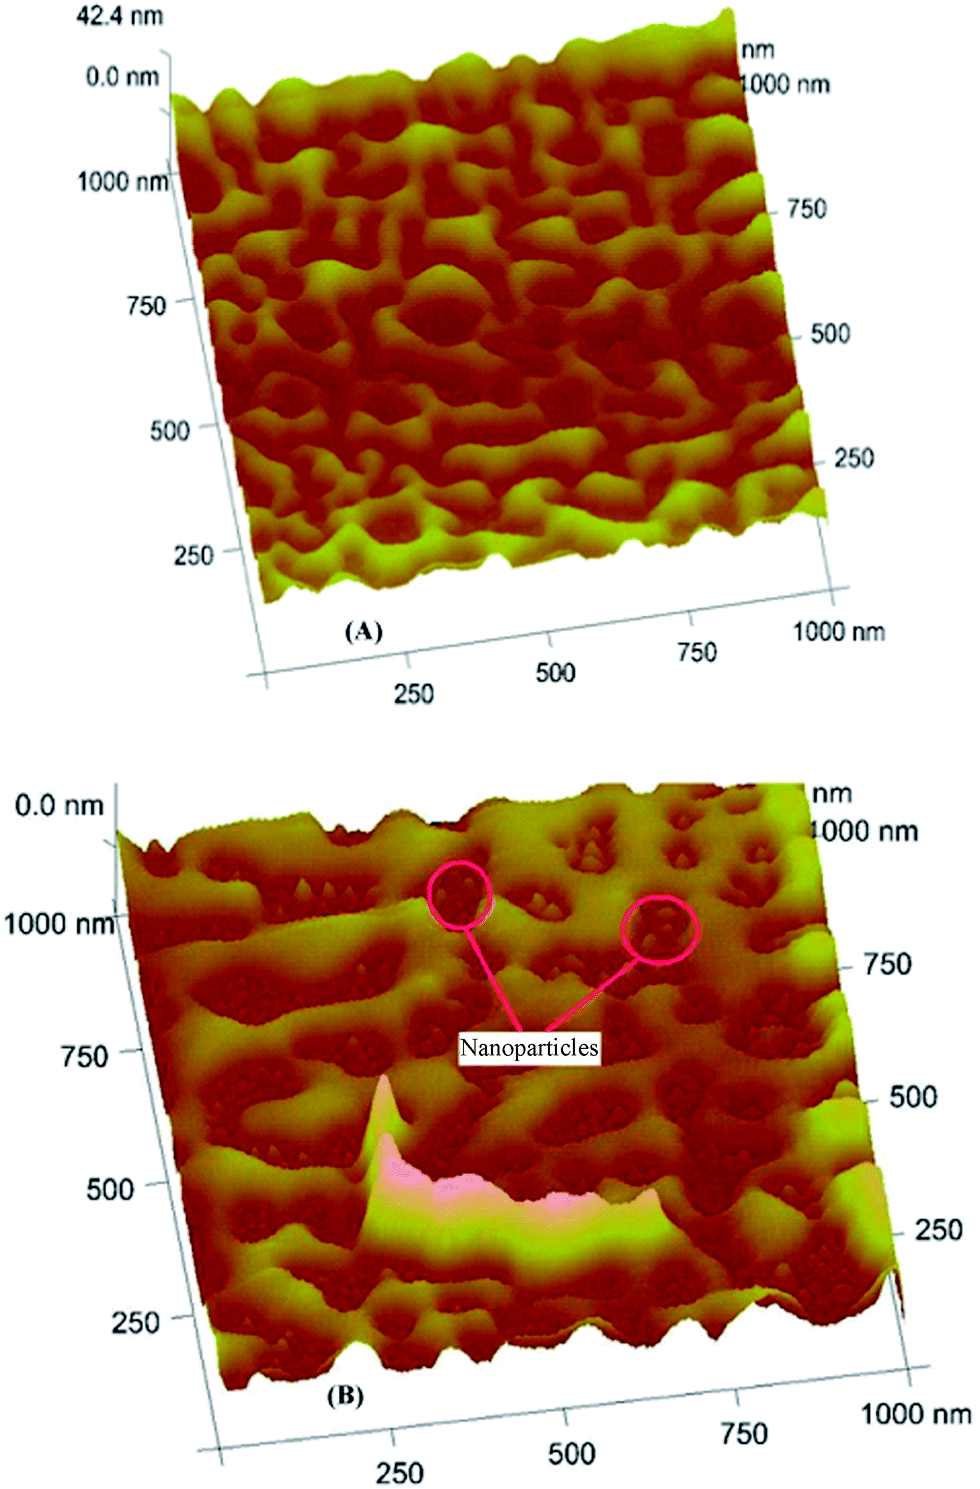 | ||
| Fig. 3 (a) AFM image of MIP without particles (b) AFM image of composite material containing Ag2S. | ||
Sensor characteristics
Fig. 4 shows the sensor responses of nanocomposite and MIP, respectively, towards different vapour concentrations of 1-butanol vapour between 100 ppm and 400 ppm. The nanocomposite clearly gives rise to five times higher frequency responses, than the corresponding MIP: at 400 ppm of 1-butanol, the MIP sensor response is −17 Hz at a noise level of 0.14 Hz leading to a limit of detection of 10 ppm. In contrast to this the nanocomposite yields a response of 70 Hz at 0.11 Hz noise level for the same vapour concentration. This leads to a limit of detection of 2 ppm. Furthermore, all sensor responses are fully reversible. This increase of nanocomposite sensor signals can best be explained by the accumulative properties of the Ag2S nanoparticles and the MIP matrix. However, the exact nature of this increase of course needs further elucidation by comparing more than just these two matrices (see Fig. 5 and the discussions related to the data shown there). Nonetheless, it is evident that there is a substantial difference between the sensor responses of MIP and nanocomposite. Hence, blending molecularly imprinted polymers and affinity materials can inherently be utilized to improve sensitivity of a sensor. | ||
| Fig. 4 Sensor signals of MIP and nanocomposite towards different concentrations of 1-butanol. | ||
 | ||
| Fig. 5 Comparison of sensor responses of different recognition materials towards 1-butanol. | ||
Finally, regression analysis of the mass-sensitive sensor characteristic yields a linear calibration function with a slope of 0.64 and a correlation coefficient (R2) of 0.999. Reproducibility measurements revealed deviations of around three percent for consecutive exposure to the same analyte concentration.
The added value of the composite can be assessed by taking into consideration the sensor responses of different possible layers. For that purpose, Fig. 5 summarizes the frequency shifts obtained from MIP, NIP (non-imprinted polymer), NPs, NIP + NPs (non-imprinted composite) and MIP + NPs (imprinted composite) towards 400 ppm of 1-butanol each. To ensure comparability, all sensor responses have been normalized to the same layer height. The latter parameter is accessible by determining the resonance frequency of a QCM before and after coating and using this frequency change for normalizing the sensor responses. This approach makes sure that sensor layers of the same mass are compared and the different densities of NP and MIP do not have to be taken into account. Evidently the NIP gives rise to the lowest effects, thus indicating comparably low nonspecific affinity between the polymer and the alcohol. Sensor responses of the NIP/NP composite are higher by a factor of three. The reason for this is that obviously some of the particles are exposed on the polymer surface and undergo affinity interactions with 1-butanol. Sensors that are coated with MIP give rise to four times higher sensor responses, than the corresponding NIP. Imprinting has thus obviously generated interaction sites for 1-butanol in the MIP. The magnitude of the response indicates that binding sites are present within the entire volume of the thin film and not only on its outer surface, which is in line with many previous QCM MIP sensors. The MIP also yield higher sensor responses than the NIP/NP composite material. Furthermore, the sensor response of pure NP is higher by the factor of 8 than that of NIP indicating that the affinity of Ag2S towards alcohols is substantially higher than that of the polymers. Of course, this effect can be attributed to a combination of their higher surface area and different affinities.
Combining the Ag2S NPs and MIP finally leads to an improvement factor of 16 over NIP, which is even two times larger than the response of the pure nanoparticles. Given the fact that all layers are normalized to the same film mass, this means at least three times higher increase of sensitivity by the combination: the MIP yielded ∼20 Hz, the NP layer ∼35 Hz response. Taking the mass ratio between the two materials in the composite (2.25![[thin space (1/6-em)]](https://www.rsc.org/images/entities/char_2009.gif) :1 polymer–Ag2S), one would expect a response of roughly 25 Hz if the effects of the two constituents of the composite simply added up. However, we measured almost three times higher signals. This indicates that the MIP functions as a “pre-concentrator” for alcohol around the Ag2S nanoparticles. So the sensing capability of the silver sulfide–polyurethane composite material is determined by a combination of NP and MIP recognition. This phenomenon can be explained by the affinity between the alcohol and the nanoparticles, which is evident from the sensor responses shown in Fig. 2(B) and 5, respectively: obviously, butanol molecules pre-organize around the nanoparticles during polymerization. This leads to a very high amount of binding sites in the polymer matrix in the immediate vicinity of the nanoparticles. Therefore the density of binding sites is comparably high in those areas of the polymer. In addition, their affinity towards butanol is further enhanced by the presence of the nanoparticle surface.
:1 polymer–Ag2S), one would expect a response of roughly 25 Hz if the effects of the two constituents of the composite simply added up. However, we measured almost three times higher signals. This indicates that the MIP functions as a “pre-concentrator” for alcohol around the Ag2S nanoparticles. So the sensing capability of the silver sulfide–polyurethane composite material is determined by a combination of NP and MIP recognition. This phenomenon can be explained by the affinity between the alcohol and the nanoparticles, which is evident from the sensor responses shown in Fig. 2(B) and 5, respectively: obviously, butanol molecules pre-organize around the nanoparticles during polymerization. This leads to a very high amount of binding sites in the polymer matrix in the immediate vicinity of the nanoparticles. Therefore the density of binding sites is comparably high in those areas of the polymer. In addition, their affinity towards butanol is further enhanced by the presence of the nanoparticle surface.
The second main advantage of combining MIP and nanoparticles is that it also clearly introduces steric selectivity into the nanocomposite, which is of course not possible for the pure NPs. The sensor responses of pure silver sulphide nanoparticles as well as two nanocomposites based on MIP for 1-BuOH and 2-BuOH, respectively, towards 400 ppm of both alcohols each are summarized in Table 1. Ag2S NPs yield −37 Hz sensor signals towards 1-BuOH and −30 Hz toward 2-BuOH indicating only minor selectivity in this case. The affinity between NP and the alcohols obviously hardly depends on steric properties and might result from slightly different acid–base behaviour of secondary alcohols. On the other hand, the sensor response of 1-BuOH MIP nanocomposite is −70 Hz towards 400 ppm of 1-butanol, but only −10 Hz response towards the same concentration of 2-BuOH. Such a high selectivity factor is of course the consequence of steric discrimination by the MIP.
| Materials | Δf (1-BuOH) | Δf (2-BuOH) | Δf (1-BuOH)/Δf (2-BuOH) |
|---|---|---|---|
| NPs | −37 | −30 | 1.2 |
| Composite (1-BuOH) | −70 | −15 | 4.7 |
| Composite (2-BuOH) | −25 | −50 | 0.5 |
In the same way the composite based on the 2-BuOH–MIP yields a sensor signal of −50 Hz towards its template, but only −25 Hz towards the linear 1-BuOH clearly indicating similar – but somewhat lower – steric selectivity introduced by the MIP. Hence it is obvious from Table 1 that pure Ag2S nanoparticles cannot distinguish between 1-butanol and 2-butanol, whereas in the case of the MIP this is achieved beyond any doubt. In addition to their increased combined sensitivity, the nanocomposites therefore also profit from the selectivity introduced by the polymer.
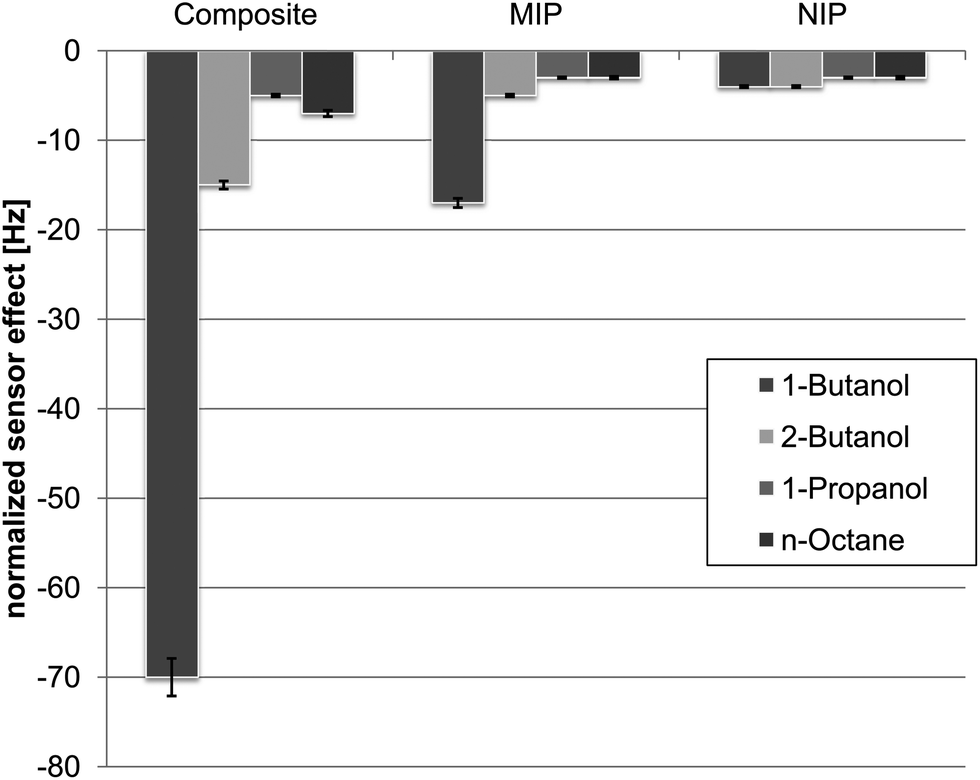
For finally characterizing selectivity, Fig. 6 summarizes the sensor responses of 1-BuOH–MIP nanocomposite towards the two butanols, propanol and n-octane. Again, the sensor responses of the two butanol isomers differ from each other by the factor of about five despite having the same molar mass and functionality and differing only their steric properties.
 | ||
| Fig. 6 Selectivity pattern of nanocomposite material. | ||
Furthermore, the sensor was subjected to a compound having different molar mass but same functionality, namely 1-propanol: the sensor yields a response of only 5 Hz against 400 ppm, which corroborates selectivity of the MIP. Here, the principal affinity of the nanoparticles towards the alcohol functionality (that can be seen from the sensor responses of the pure NP) is even counteracted by the MIP-part of the composite. Consequently, a compound that is too large for the cavities in the MIP and does not interact with the NP leads to minimal frequency effects. When regarding the sensor responses of the pure MIP, one can clearly see that nanocomposite selectivity is indeed mainly governed by the polymer in this case.
Experimental
Chemicals
Diisocyanato-diphenylmethane (DPDI), bisphenol A (BPA), phloroglucinol, tetrahydrofuran (THF), H2S gas, AgNO3, ethanol were purchased from Merck and Fluka with highest purity available and used as received.Synthesis of Ag2S nanoparticles
Silver sulfide powder particles were produced via precipitation method following an already published procedure.36 These particles were washed with anhydrous ethanol and retrieved by centrifugation. Nanoparticles with different sizes were separated from each other by resuspending them followed by centrifugation at 4000 rpm for different amounts of time, i.e. particles with larger size sedimented more rapidly, than lighter ones. The nanoparticles were dried at 800 °C for 24 hours. This approach results in particle diameters of roughly 50 nm.Synthesis of Ag2S–polyurethane nanocomposite material
Polyurethane was prepared according to an already published procedure.37 We used diisocyanato-diphenylmethane (DPDI) containing about 30% of triisocyanates for this synthesis. 1.0 g of DPDI, 1.97 g of bisphenol A (BPA), 0.22 g of phloroglucinol and 2 ml of tetrahydrofuran (THF). After obtaining a homogeneous mixture of these compounds, we diluted 30 μl of it with 970 μl of 1-butanol. Then we added 10 mg of Ag2S nanoparticles to 500 μl of this oligomer solution and thus obtained a suspension of Ag2S–MIP polyurethane composite material which results in a mass ration of 2.25:1 (w/w) between polymer and NP. This was further diluted 30 times with the respective template solvent. The respective NIP/NP composites were synthesized with THF as a solvent in all synthesis steps.
Quartz crystal microbalance (QCM) design and preparation
All sensor measurements shown in this paper are based on 10 MHz quartz crystal microbalances with screen-printed dual channel structures. After electrode deposition, the QCM sheets were immersed overnight in 5–10% solution of 1-butanethiol in n-heptane to generate a monolayer of alkanethiolate on the gold surface. This prevents baseline drift/irreversible sensor responses caused by the thiol background in air. On the respective working electrode, a layer of 2–3 kHz was generated by spin coating 5 μl of composite material onto both faces of the quartz at a speed of 2000 rpm. QCM were dried overnight at 80 °C.Atomic force microscopy (AFM)
AFM measurements took place on a Veeco NanoScope IVa in contact mode at 1 Hz scan rate. 5 μl of nanocomposite in THF (tetrahydrofuran) was deposited on glass substrate and analyzed with contact mode scanning.X-ray powder diffractometry
Diffraction (XRD) data of Ag2S was obtained from a Guinier-Huber image plate employing monochromatic Cu Kα1-radiation (1.54056 Å). The sample measurements were carried out at a voltage of 40 kV and a current of 30 mA. The diffraction pattern was recorded from 8° to 100° in 2θ geometry on an image plate. Particles were deposited on a polymeric sample holder by paraffinic adhesive material not interfering with the measurement.Conclusions
Blending MIP with inorganic nanoparticles results in a nanocomposite material with novel collective properties: the sensitivity obtained on QCM is roughly tripled compared to the pure materials. By utilizing both the affinity resulting from the NP and the selectivity of the MIP, one can thus make use of the best of both worlds on the way to high-performance gas sensors. Taking into consideration the different densities of the polymer and the NP, this may finally result in thinner sensor layers.Notes and references
- W. Lian, S. Liu, J. Yu, X. Xing, J. Li, M. Cui and J. Huang, Biosens. Bioelectron., 2012, 38, 163 CrossRef CAS PubMed.
- R. Singh, R. Verma, A. Kaushik, G. Sumana, S. Sood, R. K. Gupta and B. D. Malhotra, Biosens. Bioelectron., 2011, 26, 2967 CrossRef CAS PubMed.
- G. Mustafa, M. Hussain, N. Iqbal, F. L. Dickert and P. A. Lieberzeit, Sens. Actuators, B, 2012, 162, 63 CrossRef CAS PubMed.
- C. Hagleitner, A. Hierlemann, D. Lange, A. Kummer, N. Kerness, O. Brand and H. Baltes, Nature, 2001, 414, 293 CrossRef CAS PubMed.
- E. Hedborg, F. Winquist, I. Lundström, L. I. Andersson and K. Mosbach, Sens. Actuators, A, 1993, 37–38, 796 CrossRef CAS.
- R. Schirhagl, P. A. Lieberzeit and F. L. Dickert, Adv. Mater., 2010, 22, 2078 CrossRef CAS PubMed.
- D. Kriz, O. Ramstrom, A. Svensson and K. Mosbach, Anal. Chem., 1995, 67, 2142 CrossRef CAS.
- L. Han, A. Andrady, K. Guzan and D. Ensor, Mater. Res. Soc. Symp. Proc., 2010, 1240, 61 Search PubMed.
- L. Han, D. R. Daniel, M. M. Maye and C. J. Zhong, Anal. Chem., 2001, 73, 4441 CrossRef CAS.
- H. Lei and W. G. Pitt, Sens. Actuators, B, 2004, 101, 122 CrossRef CAS PubMed.
- F. Wang, H. W. Gu and T. M. Swager, J. Am. Chem. Soc., 2008, 130, 5392 CrossRef CAS PubMed.
- P. A. Lieberzeit, A. Rehman, S. Yaqub and F. L. Dickert, NANO, 2008, 3, 205 CrossRef CAS.
- M. Hussain, J. Wackerlig and P. A. Lieberzeit, Biosensors, 2013, 3, 89 CrossRef PubMed.
- P. K. Ivanova-Mitseva, A. Guerreiro, E. V. Piletska, M. J. Whitcombe, Z. Zhou, P. A. Mitsev, F. Davis and S. A. Piletsky, Angew. Chem., Int. Ed., 2012, 51, 5196 CrossRef CAS PubMed.
- D. Croux, T. Vangerven, J. Broeders, J. Boutsen, M. Peeters, S. Duchateau, T. Cleij, W. Deferme, P. Wagner, R. Thoelen and W. De Ceuninck, Phys. Status Solidi A, 2013, 210, 938 CrossRef CAS.
- A. Poma, A. Guerreiro, M. J. Whitcombe, E. V. Piletska, A. P. F. Turner and S. A. Piletsky, Adv. Funct. Mater., 2013, 23, 2821 CrossRef CAS.
- F. Horemans, J. Alenus, E. Bongaers, A. Weustenraed, R. Thoelen, J. Duchateau, L. Lutsen, D. Vanderzande, P. Wagner and T. J. Cleij, Sens. Actuators, B, 2010, 148, 392 CrossRef CAS PubMed.
- E. Bongaers, J. Alenus, F. Horemans, A. Weustenraed, L. Lutsen, D. Vanderzande, T. J. Cleij, F. J. Troost, R.-J. Brummer and P. Wagner, Phys. Status Solidi A, 2010, 207, 837 CrossRef CAS.
- L. Ye and K. Mosbach, Chem. Mater., 2008, 20, 859 CrossRef CAS.
- S. Balamurugan and D. A. Spivak, J. Mol. Recognit., 2011, 24, 915 CrossRef CAS PubMed.
- Z. Xu, H. Gao, L. Zhang, X. Chen and X. Qiao, J. Food Sci., 2011, 76, R69 CrossRef CAS PubMed.
- S. Z. Bajwa, G. Mustafa, R. Samardzic, T. Wangchareansak and P. A. Lieberzeit, Nanoscale Res. Lett., 2012, 7, 328 CrossRef PubMed.
- Y. Fang, C. Bai and Y. Zhang, Chem. Commun., 2001, 804 Search PubMed.
- T. E. Twardowski, Introduction to Nanocomposite Materials: Properties, Processing, Characterization, DEStech Publications, Inc., Lancaster, PA, 2007 Search PubMed.
- Y. N. Chan, G. S. W. Craig, R. R. Schrock and R. E. Cohen, Chem. Mater., 1992, 4, 885 CrossRef CAS.
- M. Gajc, H. B. Surma, A. Klos, K. Sadecka, K. Orlinski, A. E. Nikolaenko, K. Zdunek and D. A. Pawlak, Adv. Funct. Mater., 2013, 23, 3443 CrossRef CAS.
- G. A. Sotiriou, C. O. Blattmann and S. E. Pratsinis, Adv. Funct. Mater., 2013, 23, 34 CrossRef CAS.
- S. A. McDonald, G. Konstantatos, S. G. Zhang, P. W. Cyr, E. J. D. Klem, L. Levina and E. H. Sargent, Nat. Mater., 2005, 4, 138 CrossRef CAS PubMed.
- L. Chen, G. Chen and L. Lu, Adv. Funct. Mater., 2007, 17, 898 CrossRef CAS.
- S. Pandey, G. K. Goswami and K. K. Nanda, Sci. Rep., 2013, 3, 2082 Search PubMed.
- H. A. K. Toprakci, S. K. Kalanadhabhatla, R. J. Spontak and T. K. Ghosh, Adv. Funct. Mater., 2013, 23, 5536 CrossRef CAS.
- L. Xu, J. Pan, Q. Xia, F. Shi, J. Dai, X. Wei and Y. Yan, J. Phys. Chem. C, 2012, 116, 25309 CAS.
- W. Zhang, X. W. He, Y. Chen, W.-Y. Li and Y.-K. Zhang, Biosens. Bioelectron., 2011, 26, 2553 CrossRef CAS PubMed.
- W. Lian, S. Liu, J. Yu, X. Xing, J. Li, M. Cui and J. Huang, Biosens. Bioelectron., 2012, 38, 163 CrossRef CAS PubMed.
- P. A. Lieberzeit, A. Afzal, A. Rehman and F. L. Dickert, Sens. Actuators, B, 2007, 127, 132 CrossRef CAS PubMed.
- S. Shukla and S. Seal, J. Sol-Gel Sci. Technol., 2002, 23, 151 CrossRef CAS.
- F. L. Dickert, P. A. Lieberzeit, P. Achatz, C. Palfinger, M. Fassnauer, E. Schmid, W. Werther and G. Horner, Analyst, 2004, 129, 432 RSC.
| This journal is © The Royal Society of Chemistry 2014 |