DOI:
10.1039/C3RA44186E
(Paper)
RSC Adv., 2014,
4, 6397-6406
Heterosturcture NiO/Ce1−xNixO2: synthesis and synergistic effect of simultaneous surface modification and internal doping for superior catalytic performance†
Received
6th August 2013
, Accepted 20th December 2013
First published on 20th December 2013
Abstract
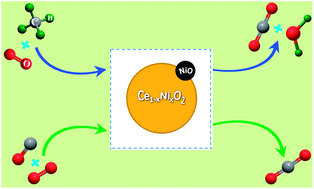
In this work, a two-step method that involves a hydrothermal reaction and a subsequent calcination was initiated to prepare a novel heterostructure (1 − x)CeO2·xNiO. All samples were systematically characterized by X-ray diffraction, Raman spectra, Transmission electron microscopy, In situ DRIFT spectra, Brunauer–Emmett–Teller technique, H2-temperature-programmed-reduction, and O2-temperature-programmed-desorption. Distinct from the conventional sol–gel or co-precipitation methods, the present methodology allows Ni2+ to be simultaneously doped in the CeO2 lattice and dispersed onto the surfaces of CeO2 nanoparticles by simply varying the calcination temperature from 400 to 700 °C. When calcined at an optimized temperature of 500 °C, the heterostructure at x = 0.1 showed a mean grain size of 18 nm, specific surface area of 69.3 m2 g−1, the smallest lattice parameter, and the largest amount of surface adsorbed and desorped oxygen species, which has led to an excellent catalytic performance towards CO and CH4 oxidation. Such a superior performance benefits from the unique synergistic effects of the finely dispersed NiO and Ni–O–Ce solid solution species detected in the heterostructure.
1. Introduction
Catalytic oxidation reactions have drawn great attention in recent decades due to the energy utilization and environmental requirements.1–3 Many types of catalysts such as pure oxides,4 mixed oxides,5 and supported systerms6 have been studied for catalytic oxidations. CeO2 has a relatively high thermal stability and redox behavior, and therefore is widely used as an important support in CO oxidation reactions.7 It is well established that noble metals supported on CeO2 usually exhibit excellent catalytic performance, while these supported noble metals are expensive. It is hence necessary to develop cheap substitution catalysts for catalytic oxidation reactions. Transition metal oxides are promising alternatives because of the low price. Recent reports have shown that MOX (M = transition metal ions, like Co3+/Co2+, Cu2+, Ni2+)8–10 supported on CeO2 exhibits excellent activity of catalytic oxidation since addition of transition oxide enables the promotion of oxygen storage capacity and redox properties of CeO2. As a consequence, there is a strong demand for development of composite CeO2–MOX catalysts with low cost and relatively high activity.
Catalytic performance enhancement of CeO2–MOX catalysts is not only due to the interactions between MOX and CeO2 that can further modulate the intrinsic surface properties of supported phases, but also due to the internal doping of transition metal species for creating more defects (oxygen vacancies).11–16 Besides these, CeO2 shows the merits in preventing the sintering of transition metal ions, as indicated for transition-metal oxide supported systems (e.g., CeO2–Fe2O3, CeO2–NiO, CeO2–CuO)17–19 when applying in catalytic oxidation reactions. Among all transition metal oxide supported systems, CeO2–NiO materials could be a highly promising catalyst for various reactions. Many methodologies have been reported in literature to prepare CeO2–NiO mixed oxide catalysts with different Ni contents, which include co-precipitation,20 citrate acid method,21 or impregnation method.22,23 However, there still exists certain controversies in these studies. For instance, it is reported that Ni species are doped in CeO2 lattice, which favors to form oxygen vacancies and improves reducibility of CeO2.24,25 While, others thought that NiO particles are highly dispersed on CeO2 surfaces, providing strong metal-support interactions between NiO particles and CeO2.26,27 One may wonder if it is possible to achieve heterostructure (1 − x)CeO2·xNiO that simultaneously involves the doped Ni species and surface modification of NiO nanocrystals, since such heterostructure expects to show the synergistic effects in producing excellent catalytic performance essential for applications.
In this work, we adopted a two-step method that involves a hydrothermal reaction and a subsequent calcination to prepare a novel heterostructure (1 − x)CeO2·xNiO. The sample synthesis is based on the following considerations: (i) hydrothermal method is effective to synthesize the precusors of CeO2 and beta-Ni(OH)2,28 and (ii) both NiO and CeO2 have the similar cubic structures, while Ni2+ is far smaller than Ce4+. When calcined at high temperatures, part of Ni ions could be doped in CeO2 lattice, while part of Ni species would be highly dispersed onto CeO2 grains to form heterostructure (1 − x)CeO2·xNiO. With the successful sample synthesis, the catalytic oxidation behaviors of the heterostructure were investigated, which have shown an excellent activity towards oxidation of CO and CH4. Further, the impacts of calcination temperature on surface structure, internal defect structure, and furthermore the catalytic activities were discussed.
2. Experimental section
2.1. Sample syntheses
(1 − x)CeO2·xNiO (x = 0.1). All samples were prepared by a hydrothermal method followed with calcination treatment. The synthetic procedure can be briefly described as follows. A mixed solution that contains 0.225 M Ce(NO3)3·6H2O and Ni(NO3)2·6H2O at a molar ratio of Ce
:
Ni = 9
:
1 was sufficiently stirred, into which 5 M NaOH solution was added till pH = 13. The mixed solution was then transferred to 100 mL Teflon-lined stainless steel autoclave, which was allowed to react at 220 °C for 24 h. After naturally cooling down to room temperature, the precipitates were filtered, washed with distilled water till pH = 7, and dried at 80 °C in air. Eventually, the dried precipitates were calcined at 400, 500, 600, and 700 °C, respectively, in air for 4 h.
(1 − x)CeO2·xNiO (0.05≤x ≤ 0.7). Using the procedures for x = 0.1, the samples (1 − x)CeO2·xNiO with different nickel contents were prepared, when the calcination temperature was fixed at 600 °C.Pure-phases of the end compounds (1 − x)CeO2·xNiO (x = 0 and 1) were also prepared for comparison.
x = 0. The synthetic procedure for CeO2 was similar to that for x = 0.1, while no Ni(NO3)2·6H2O was involved during hydrothermal reactions. The precipitates by hydrothermal method were also calcined at 400, 500, 600, and 700 °C in air for 4 h, respectively.
x = 1. The synthetic procedure for NiO was similar to that for x = 0.1, while no Ce(NO3)3·6H2O was involved during the hydrothermal reactions. The precipitate thus obtained was calcined at 500 and 600 °C in air for 4 h.
2.2. Sample characterization
All samples were characterized by X-ray diffraction (XRD) using a Rigaku Miniflex apparatus equipped with Cu Kα radiation (λ = 0.15418 nm). The scanning rate was set at 0.3° min−1, and the step size was 0.02°. Aluminum powders were added into the samples (amounting 10–15 wt%) to serve as an internal standard for peak positions calibration. Raman spectra of the samples were obtained on a Renishaw, UV-vis raman system 1000 with an excitation line of 785 nm. Morphologies of the samples were observed by scanning electron microscopy (Phenom G2), and transmission electron microscopy (TEM) (JEM-2010). Sample was dispersed in anhydrous ethanol and then treated under ultrasound for 30 minutes to get a well-dispersed solution before TEM measurements. The molar ratios of Ce to Ni and weight proportions for the samples were measured by Inductively Coupled Plasma OES spectroscopy (Ultima2).
Specific surface areas were determined from nitrogen adsorption data measured at liquid nitrogen temperature using Brunauer–Emmett–Teller (BET) technique on a Micromeritics ASAP 2000 Surface Area and Porosity Analyzer. The samples were pre-treated in N2 at 120 °C before N2 absorption analysis. In situ diffuse reflectance infrared Fourier transform spectroscopy (DRIFTS) was performed on a Nicolet 6700 apparatus equipped with diffuse reflectance accessory (Harrick CHC-CHA-3). All sample powders were pre-treated in situ at 400 °C in pure He (99.99%) with a flow rate of 60 mL min−1 to eliminate water traces. Then, all powders were cooled to 160 °C in flowing He. Subsequently, 1% CO and 99% He at a total flow rate of 40 mL min−1 were introduced into the in situ chamber, and the spectra were recorded in 10 min.
H2 temperature-programmed-reduction (TPR) for all samples were measured. Prior to H2-TPR experiments, 50 mg samples were treated at 200 °C for 2 h in Ar. After cooling down to 30 °C, samples were heated to 900 °C at a rate of 5° min−1 in 10 vol%H2 in Ar at a flow rate of 30 mL min−1. H2 consumption of the samples was calculated by comparing to CuO reference.
To examine the mobility of lattice oxygen, O2 temperature-programmed-desorption (TPD) for all samples were measured using a conventional chemisorption analyzer (Finesorb 3010C). The measurements were performed under a flow of pure He (30 ml min−1) over 100 mg catalyst at a heating rate of 10 °C min−1 from room temperature to 900 °C. All samples were pre-treated in He at 120 °C for 40 min, and then in pure O2 at 120 °C for 60 min before TPD test.
2.3. Catalytic activity test
CO catalytic oxidation. The catalytic test was carried out on a fixed-bed quartz microreactor equipped with an online gas chromatograph (Shimadzu GC-2014) and a quadrupole mass spectrometer (Pfeiffer Prisma Plus QMG 220 M2). All measurements were done at atmospheric pressure with 50 mg catalyst (50–70 mesh) without any pre-treatment. The reagent gas consisted of 1.0% CO, 20% O2, and 79% Ar with a flow rate of 20 mL min−1. The specific velocity was set at 24
000 mL g−1 h−1. The conversion of CO was calculated from the difference in CO concentration between the inlet and outlet gases.
CH4 catalytic oxidation. CH4 oxidation test was performed on the same reactor for CO catalytic oxidation, but with a catalytst mass of 100 mg. 1% CH4 and 4% O2 balanced with Ar at a flow rate of 50 mL min−1 were set as the reagent gas, and the specific velocity was set at 30
000 mL g−1 h−1.
3. Results and discussion
3.1. CO catalytic oxidation activity of the samples
All samples (1 − x)CeO2·xNiO (0.05 ≤ x ≤ 0.7) calcined at 600 °C showed a pronounced catalytic performance towards CO oxidation. As indicated in ESI (Fig. S1†), NiO content showed a significant influence on the catalytic performance. The catalyst (1 − x)CeO2·xNiO at x = 0.05 has a relatively poor activity and the complete temperature of CO conversion (T100%) was 200 °C. As NiO content increased to x = 0.1, CO conversion rate increased obviously, showing a decrease in T100% to 180 °C. However, the activity of catalysts were not remarkably improved when varying the NiO content in the range of 0.1 ≤ x ≤ 0.5. Further increasing NiO content results in a decrease in catalytic activity. Especially for x = 0.6 and 0.7, T100% started to increase to 190 and 200 °C. In the following, we will address the sample at x = 0.1 due to its greatly improved oxidation activity.
Fig. 1 compares the CO catalytic oxidation activity of the sample (1 − x)CeO2·xNiO at x = 0.1 with those for the end compositions (x = 0, 1). All these samples were prepared after calcination at 600 °C. It is seen that the sample at x = 0.1 performs more excellent catalytic performance when comparing to the end compounds at x = 0 and 1. For the latter cases, the sample at x = 0 was least active, almost showing no conversion at temperatures <200 °C. Meanwhile, the sample at x = 1 gave an intermediate catalytic activity with 100% conversion around 210 °C.
 |
| Fig. 1 CO oxidation activities of the samples (1 − x)CeO2·xNiO at (a) x = 0.1, (b) x = 1, and (c) x = 0 prepared after calcination at 600 °C. | |
In order to further improve the catalyst properties, calcination temperature for x = 0.1 was optimized. As shown in Fig. 2, when the calcination temperature was set at 400 °C, the sample at x = 0.1 showed a complete CO conversion around 190 °C. Increasing calcination temperature to 500 °C led to an optimum catalytic performance by reducing the complete conversion temperature to 160 °C. Further increasing calcination temperature beyond 500 °C, catalytic activity decreased readily. For instance, after calcination at 700 °C, the complete conversion needed a higher temperature of 210 °C. Therefore, the optimized calcination temperature for x = 0.1 that shows the excellent catalytic activity was determined to be 500 °C.
 |
| Fig. 2 CO oxidation activities of the samples (1 − x)CeO2·xNiO at x = 0.1 prepared after calcination at (a) 500, (b) 600, (c) 400, and (d) 700 °C. | |
Reproducibility of the sample at x = 0.1 calcined at 500 °C were investigated. As shown in Fig. 3, the catalytic performance for x = 0.1 after calcination at 500 °C was reproducible for four runs, no matter what the run sequence was. In addition, the stability of the catalytic performance was further examined at a conversion rate of 93–94% for x = 0.1 and x = 1. As indicated in inset of Fig. 3, for x = 0.1, CO conversion showed no sign of deactivation at 155 °C, even when the catalytic reaction periods were prolonged beyond 100 h. CO conversion for x = 1 slightly fluctuate from 25 h to 40 h. Therefore, synergistic effect of NiO and CeO2 could improve the stability of the catalyst compared with pure oxide.
 |
| Fig. 3 CO oxidation reproducibility of the samples (1 − x)CeO2 ·xNiO at x = 0.1 prepared after calcination at 500 °C. All catalytic tests were run for four times. Inset shows the long-term catalytic durability at a 93–94% conversion for a long period of 100 h for the samples at x = 0.1 (black dot) and 1 (red dot) after calcinations at 500 °C. | |
To get insights into the optimum catalytic activity for x = 0.1, we systematically characterized our samples by XRD, Raman spectra, TEM, BET, H2-TPR, and O2-TPD as below. All relevant results were compared with those reported in literature for similar systems.
3.2. XRD
Fig. 4 shows XRD patterns of the samples (1 − x)CeO2·xNiO (x = 0.1) prepared after calcinations at different temperatures. To assign the peaks correctly, Al powder (space group Fm
m, JCPDS, no. 04-0787) was used as an internal standard. For comparison, XRD data for the end compounds (x = 0, 1) were also given. From Fig. 4, it is seen that both the end compounds showed the diffractions that can be well fitted in a cubic fluorite phase of CeO2 (space group Fm
m, JCPDS, no. 65-5923) at x = 0 and NiO (space group Fm
m, JCPDS, no. 47-1049) at x = 1. Comparatively, for x = 0.1, majority of the intensive diffraction peaks can be assigned to CeO2, while several weak diffraction peaks for NiO were also observed, as indicated by the enlarged diffraction patterns in ESI (Fig. S2†). One may thus conclude that traces of NiO co-existed with the dominant phase CeO2. This observation is completely different from a previous report by Wrobel et al.,29 who concluded that Ni tends to dope in CeO2 lattice to form a solid solution at Ni/Ce < 0.5. For both component phases in x = 0.1, the crystalline degrees were strongly influenced by calcination. As indicated in Fig. 4, with increasing the calcination temperature, diffraction intensities for components CeO2 and NiO gradually increased, while the relevant diffraction width became narrowed, which suggests an increased crystalline degree of the component phases.
 |
| Fig. 4 XRD patterns of the samples (1 − x)CeO2·xNiO at x = 0 after calcination at 600 °C (a), x = 0.1 after calcinations at (b) 400, (c) 500, (d) 600, (e) 700 °C, and (f) x = 1 after calcination at 600 °C. Al was used as an internal standard for peak positions determination. | |
Table 1 shows the mean crystallite size, lattice constant, and lattice strain for samples (x = 0, 0.1) prepared after calcinations at different temperatures. It is well documented that either particle size reduction or lattice strain effect could contribute to the peak broadening of XRD patterns. To figure out what is the main reason for diffraction broadening, we employed Williams30 and Scherrer relation31,32 and calculated the mean crystallite size and lattice strain for the dominant cubic fluorite phases of x = 0 and 0.1 prepared after calcinations at different temperatures using the following equation,33
where
β is the full width at half maximum (FWHM),
θ is the diffraction angle,
λ is the X-ray wavelength,
D is the mean particle size, and
η is the lattice strain. Four dominant diffraction peaks (111), (200), (220), and (311) of CeO
2 fluorite structures were used for all calculations. Since crystallite sizes and dopants can have great impacts on lattice dimension of fluorite structures, the lattice parameters for
x = 0 and 0.1 were calculated using a profile fitting by a least-squares method employing the computer program GSAS implemented with EXPGUI.
34
Table 1 Mean particle size (D), lattice parameter (nm), and lattice strain (η) of (1 − x) CeO2·xNiO at x = 0 and 0.1 after calcinations at different temperatures, and molar ratios of Ce to Ni for x = 0.1 after calcinations at different temperatures
Calcination temperature (° C) |
Samples (1 − x)CeO2·xNiO |
Mean particle size (nm) |
Lattice parameters (nm) |
Lattice strain (η) |
Molar ratios of Ce to Ni |
x = 0 |
x = 0.1 |
x = 0 |
x = 0.1 |
x = 0 |
x = 0.1 |
x = 0.1 |
400 |
17.6 |
17.1 |
0.5414 |
0.5410 |
0.18% |
0.68% |
0.92 : 0.11 |
500 |
18.5 |
17.7 |
0.5414 |
0.5405 |
0.26% |
0.56% |
0.91 : 0.11 |
600 |
18.5 |
17.9 |
0.5413 |
0.5412 |
0.32% |
0.51% |
0.91 : 0.11 |
700 |
26.3 |
25.8 |
0.5414 |
0.5413 |
0.25% |
0.34% |
0.92 : 0.12 |
From Table 1, it is seen that the crystallite sizes for a doping of 10% Ni2+ strongly depend on calcination temperatures. When calcination temperature was lower than 700 °C, mean crystallite size for x = 0 and 0.1 were roughly the same, around 18 nm. However, increasing the calcination temperature to 700 °C, there occurred an obvious growth of the crystallite size. For example, the crystallite size for x = 0 grew up to approximately 26 nm. Similar growth of crystallite size was observed for x = 0.1. Such observations could be attributed to the kinetics factors of the nanosized CeO2. It is well established that crystallite growth of CeO2 is very slow when calcination temperature is lower than 600 °C. Above this temperature, there appears an exponential increase in crystallite size.35,36 As indicated in Table 1, the molar ratios of Ce to Ni for x = 0.1 measured using ICP were closer to the initial ones, the stoichiometric atomic concentration was retained when varying calcination temperature.
The lattice parameters for x = 0 and 0.1 were comparatively studied to comprehend the doping behavior of Ni2+ in fluorite CeO2 lattice. As indicated in Table 1, with increasing calcination temperature, the lattice parameters for x = 0 did not show apparent changes, but retaining around 0.5414 nm, consistent with the bulk nature for big crystallite size. Alternatively, for x = 0.1, the lattice parameters slightly decreased from 0.5410 to 0.5405 nm, as the calcination temperature increased from 400 to 500 °C. Further increasing calcination temperature led to an increase in lattice parameter. It means that the sample at x = 0.1 calcined at 500 °C might have more Ni ions doped in CeO2 lattice. This is because Ni2+ with an ionic radius of 0.072 nm is smaller than that of 0.101 nm for Ce4+. When Ni2+ ions are incorporated in ceria lattice to form a solid solution Ce1−xNixO2, one may expect a decrease in lattice parameter, as reported elsewhere.37
To further confirm the incorporation of part Ni2+ in CeO2 to form solid solutions after calcinations, we compared the diffraction peak (111) for fluorite structure of all samples (Fig. S3†). When fixing the intensive diffraction line of internal standard (Al) at two theta of 38.47° for the standard diffraction data for Al, one can clearly see that the (111) diffraction peak for x = 0.1 shifted towards higher diffraction angles, relative to x = 0. This observation is similar to those previously reported.25,38 For x = 0.1, the calcination at 500 °C had led to a largest shifts towards higher diffraction angles, which confirms that more Ni species were incorporated in fluorite lattice and formed a solid solution.
The lattice strains for all samples were also highly dependent on the calcination temperatures. As indicated in Table 1, the lattice strain for x = 0 was all much smaller, being distributed around η = 0.2–0.3% when varying the calcination temperature from 400 to 700 °C. However, the lattice strain for x = 0.1 after calcination at 400 °C was 0.7%, at least double that for x = 0, which is a good proof of the dislocation in CeO2 structure as a result of nickel ion incorporation.33,39 As calcination temperature increased, lattice strain for x = 0.1 decreased continuously. Further increasing the calcination temperature up to 700 °C, the lattice strain for x = 0.1 droped down to 0.3%, which is probably due to the significantly increased crystallite size.
It appears that doping part of low-valence Ni2+ in CeO2 after calcination at temperatures <600 °C has produced a smaller lattice parameter (Table 1). In the following, Raman spectra were used to study the impacts of calcination temperature on the lattice strain and oxygen vacancies.
3.3. Raman spectra
Fig. 5 shows Raman spectra of the samples (1−x)CeO2·xNiO (x = 0.1) prepared after calcination at given temperatures. For comparison, the Raman data for x = 0 were also given. For x = 0.1 prepared after calcination at 400 °C, a most intensive signal at 461 cm−1 and four weak signals at 225, 260, 530, and 630 cm−1 were observed. The most intensive Raman signal at 461 cm−1 is characteristic of the intrinsic vibration mode F2g of ceria,40 while the weaker one at 260 cm−1 is associated with the second-order transverse acoustic mode of ceria.41 This set of Raman bands is different from a previous report.42,43 For the latter cases, no Raman signal at 260 cm−1 is observed, but only one band at 225 cm−1 for CeO2–NiO systems. It is noted that the most intensive Raman signals for x = 0.1 after calcination at 400 and 500 °C are much broadened when comparing to that after calcination at 700 °C. Such a Raman signal broadening could be explained by the inhomogeneous strain effects (Table 1) associated with dispersion in particle size and Ni2+ incorporation.
 |
| Fig. 5 Raman spectra of the samples (1 − x) CeO2·xNiO at x = 0.1 after calcination at (a) 400, (b) 500, (c) 700 °C, and (d) x = 0 after calcinations at 600 °C. | |
Doping of smaller ions (like Ni2+ in CeO2) can give a lattice constriction and therefore a decrease in lattice spacing and bond length, leading to a red shift in Raman mode. To examine the impacts of the calcination on the doping behavior, the most intensive Raman signal at 461 cm−1 was carefully studied, as indicated in ESI (Fig. S4†). It is seen that when calcined at lower temperatures of 400 and 500 °C, the Raman signal at 461 cm−1 for x = 0.1 shifted towards lower frequencies, comparing to that for x = 0. This phenomenon could be attributed to the formation of Ce1−xNixO2 solid solution with Ni2+ ions replacing for Ce4+ ions in CeO2 lattice. This assumption is further confirmed by the appearance of well-defined weak Raman signals at 225 and 550 cm−1, since these weak signals are closely linked to the lattice defects originated from the oxygen vacancies as reported elesewhere.43 Therefore, the solid solutions Ce1–xNixO2 were formed when calcination temperature was lower than 600 °C. Another important feature for Ni2+ doping is the modification of oxygen sublattice,42 which is demonstrated by the weak Raman signal observed at 630 cm−1 in Fig. 5(a) and (b). When the calcination temperature was further increased to 700 °C, the intensities of Raman signals at 225, 550, and 630 cm−1 decreased, while that of the most intensive one at 461 cm−1 increased, which indicates a sharply decrease in the concentration of lattice defects when calcined at 700 °C. One may thus imagine that dopant Ni2+ and the relevant defects might be expelled from the bulk lattice to the surface after high-temperature calcination.
3.4. TEM
As stated above, syntheses of the samples (1 − x)CeO2·xNiO involved two key processes: The first step is hydrothermal reactions between Ce(NO3)3·6H2O and Ni(NO3)2·6H2O aqueous solution at 220 °C, and the second one is the calcination at different temperatures. As indicated in Fig. 6a, morphologies for x = 0.1 before calcination were primarily nanocuboids and nanorods. Fig. 6b shows the inter-planar spacings of nanorods, which were about 0.31 nm, in good agreement with that for (111) facet of CeO2. Besides, the samples obtained before calcination contained a small amount of β-Ni(OH)2 (shown in Fig. S5†). It is difficult to detect β-Ni(OH)2 nanoparticles in HRTEM, since its low concentration and poor crystalline degree. To certicificate the uniformity of Ni element in the sample, EDX mapping was also taken in Fig. 6c, which revealed that Ni element is uniformly distributed in the sample before calcination.
 |
| Fig. 6 (a) TEM, (b) HRTEM, and (c) TEM-EDX mapping for x = 0.1 before calcinations, (d) TEM and (e) HRTEM images of x = 0.1 after calcination at 500 °C. Insert shows the SAED pattern of NiO nanoparticle. | |
After high-temperature calcinations, the phase compositions and the relevant morphologies were changed, as indicated by SEM images of the sample (1 − x)CeO2·xNiO at x = 0.1 after calcination at different temperatures in ESI (Fig. S6†). Fig. 6(c and d) show the HRTEM images of the sample (1 − x)CeO2·xNiO at x = 0.1 after calcination at 500 °C. It is seen that most of the particles exhibited a subspheroidal morphology, which is completely different from the shape of nanoclusters when NiO/CeO2 catalyst was prepared by solution combustion synthesis using citric acid as the oxidant.6 Despite of very low concentration of Ni2+, the sample after calcination was still observed to be composed of two types of particles: roundish CeO2 particles with surfaces attached by small NiO particles. CeO2 particles is proved by calculation of the lattice spacing of 0.27 nm for facet of CeO2 (200). As shown in Fig. 6(e), the CeO2 nanoparticle was estimated to about 13 nm. NiO particles (6 nm) attached on CeO2 surface is evidenced by TEM and SAED results (insert of Fig. 6e). According to the fast Fourier transform (FFT) analysis of the lattice fringes, SAED pattern can be indexed to be the [1
1] zone axis of cubic phase NiO, and these pattern spots are consistent with XRD results. The angles between the facets of (111) and (10
), (210) were about 90.32° and 139.59°, respectively, in good agreement with the theoretical values of 90.82° and 140.80°.
3.5. BET
We compared the CO conversion at a reaction temperature of 150 °C and BET surface area for x = 0.1 and 0 as a function of calcination temperature. CO oxidation curve of (1 − x)CeO2·xNiO catalysts at x = 0 calcined at different temperatures was shown in Fig. S8.† As indicated in Fig. 7 and S8,† for pure CeO2 (x = 0) calcined at different temperatures, there was no activity when reaction temperature was increased to 150 °C, while the sample calcined at 600 °C showed the best activity among the samples for x = 0. However, for x = 0.1, the maximum activity is obtained after calcination at 500 °C. This indicates that addition of Ni has a great effect on CeO2 activity and structure, and that the catalytic activity miximun for x = 0.1 calcined at 500 °C is not simply caused by the state of CeO2 but probably the distribution of Ni species. Furthermore, when calcined at temperature <600 °C, the BET surface area for x = 0.1 was larger than that for x = 0, though the mean particle size for both samples did not show apparent changes. One may deduce that the increased BET surface area may be related to the change of catalyst structure. At lower calcination temperature, part of Ni ions were doped in CeO2 lattice, while other parts of Ni ions were highly dispersed as segregation at surfaces for (1 − x)CeO2·xNiO at x = 0.1. Alternatively, higher calcination temperatures >700 °C may distruct the structure of solid solution and cause sintering and growth of the particles, resulting in the gradual loss of surface area.
 |
| Fig. 7 Relationships among CO conversion at 150 °C, specific surface area, and calciniation temperature for samples (1 − x)CeO2·xNiO at x = 0.1 and 0 after calcination at different temperatures from 400 to 700 °C. | |
As indicated in Table 1, when calcined at 500 °C, the lattice parameters for the dominant fluorite phase were smallest. It means that more Ni2+ ions could be doped in CeO2 lattice, which expects to give more oxygen vacancies essential for high activity. In the following, H2-TPR spectra were used to study the reduction behaviour of catalyst surface introduced by Ni species doped into CeO2 lattice and surface NiO species for the samples at x = 0.1 calcined at different temperature.
3.6. H2-TPR
Generally, large surface area enables more surface active centers exposed to the reactants, and therefore is helpful to enhance the catalytic activity. The BET surface area for x = 0.1 after calcination at 500 °C is not the largest, which however gave a relatively high catalytic activity among the samples at x = 0.1. To uncover the structural nature behind the abnormal catalytic performance, H2-TPR datas of the samples (1 − x)CeO2·xNiO at x = 0, 0.1, and 1 were comparatively studied. For x = 0 (Fig. 8f), there appeared two reduction peaks. Both peaks centered at 400 °C and 750 °C were assigned to the reduction of surface and bulk oxygen species of CeO2, respectively.44 For x = 1, there were two reduction peaks at 368 and 480 °C, which correspond to the stepwise reduction of NiO, respectively, as represented by the symbols “β” and “γ”20 (Fig. 8e).
 |
| Fig. 8 H2-TPR data of the samples (1 − x)CeO2·xNiO at x = 0.1 after calcinations at (a) 400, (b) 500, (c) 600, (d) 700 °C, and those at (e) x = 1 and (f) x = 0 after calcinations at 600 °C. | |
As shown in Fig. 8a–d, the samples at x = 0.1 calcined at different temperature showed four hydrogen consumption peaks, α1, α2, β, and δ. The first two peaks could be ascribed to the reduction of adsorbed oxygen species, which is easily accessible by H2 at low temperatures.45 When Ni2+ was incorporated in CeO2 lattice to form solid solution, oxygen vacancies were formed which favor to surface oxygen adsorption. The β and δ peaks are ascribed to NiO reduction and bulk oxygen reduction of crystalline CeO2, respectively. The lower reduction temperature of β peaks for x = 0.1 when compared to that of x = 1 indicates that NiO nanoparticles have a high dispersion degree on surfaces of catalysts and simultaneously proved the interactions existing between NiO and support CeO2.
As indicated in Table 2, the calculated H2 consumption ratios of the β peak to α2 peak associated with Ni species distributed just followed such a sequence: sample at x = 0.1 after calcinations at 500 °C < 600 °C < 400 °C < 700 °C. For x = 0.1 calcined at 500 °C, H2 consumption for peak α2 was highest, and that for β peak was the lowest among the samples for x = 0.1. This phenomenon further certifies that more Ni2+ ions were doped in CeO2 lattice to form solid solution after 500 °C calcination, which led to a drop in β peak intensity caused by the reduction of dispersed NiO species. When calcination temperature was higher than 500 °C, the intensities for peaks α1 and α2 became weak, while that for β peak became strong, which implies that high temperature calcinations above 500 °C led to the destruction of solid solution structure and the increase of NiO amount distributed onto CeO2 surface.
Table 2 Reduction peak positions, H2 consumption, desorption peak positions, and desorption areas for x = 0.1 after calcinations at different temperatures from 400 to 700 °C
Calcination temperature(°C) |
(1 − x)CeO2·xNiO (x = 0.1) |
Peak position (°C) |
H2 consumption(mmolg−1) |
Desorptionpeak position (°C) |
Desorption area |
T1 (α1) |
T2 (α2) |
T3 (β) |
T4 (γ) |
n2 (α2) |
n3 (β) |
n4 (γ) |
n3/n2 β/α2 |
T1 |
T2 |
T3 |
n1 |
n2 |
n3 |
n1 + n2 + n3 |
400 |
157 |
222 |
293 |
733 |
0.089 |
0.477 |
0.357 |
5.4 |
120 |
271 |
591 |
535 |
104 |
295 |
934 |
500 |
156 |
212 |
298 |
740 |
0.104 |
0.135 |
0.337 |
1.3 |
147 (α peak) |
3034 |
3034 |
600 |
156 |
206 |
297 |
746 |
0.048 |
0.157 |
0.288 |
3.3 |
112 (α peak) |
2285 |
2285 |
700 |
166 |
|
251 |
715 |
0.027 |
0.317 |
0.320 |
11.7 |
101 |
337 |
|
212 |
186 |
|
398 |
3.7. O2-TPD
O2-TPD was used to examine the mobility of the lattice oxygen. Fig. 9 shows the O2-TPD of (1 − x)CeO2·xNiO samples at x = 0, x = 0.1 and x = 1. It is seen that calcination of x = 0 at 600 °C (Fig. 9e) gave three obvious oxygen desorption signals at 112 °C, 250 °C and 500 °C, which are related to the weakly adsorbed molecular oxygen, the chemically adsorbed oxygen on surface, and the chemically adsorbed oxygen adjacent to the oxygen vacancies.46 The sample at x = 1 gave two weak desorptions at about 180 and 400 °C and one strong signal at 800 °C. (Fig. 9f), which are attributed to the desorption of non-stoichiometric oxygen (O2 and O−) and lattice oxygen (O2−) of NiO, respectively.47
 |
| Fig. 9 O2-TPD of the samples (1 − x)CeO2·xNiO at x = 0.1 after calcination at (a) 400, (b) 500, (c) 600, (d) 700 °C, and those at (e) x = 0 and (f) x = 1 after calcinations at 600 °C. | |
For all samples at x = 0.1, the desorption peaks were related to surface oxygen species desorption, since bulk oxygen is difficult to be desorbed. The sample at x = 0.1 calcined at 400 °C showed three obvious desorption signals at 120°, 271°, and 591 °C, the shape of which is quite similar to that of pure CeO2. It is thus indicated that incorporation of Ni ions in CeO2 has little effect on the desorption of surface oxygen species after calcination at 400 °C. With increasing the calcination temperature to 500 °C, O2-TPD profile for x = 0.1 (Fig. 9b) showed a strong and broad α peak in a wider temperature range (80–430 °C), which is attributed to the desorption of nonstoichiometric oxygen species (O2−), indicating an enhanced surface oxygen mobility. As the calcination temperature increases to 600 and 700 °C, α peak became slightly smaller and divided in two signals at 101 and 337 °C.
Desorption area of each peak was also calculated and integrated (shown in Table 2). It is observed that area summation of desorption peaks for different samples follows such a sequence: the sample (1 − x)CeO2·xNiO catalysts at x = 0.1 calcined at 500 °C > 600 °C > 400 °C > 700 °C. Sample calcined at 500 °C has a larger surface oxygen desorption amount, which would give rise to a better activity. When calcination temperature increases, the desorption ability for surface oxygen species drops, which accounts for the decrease in CO oxidation activity.
3.8. CH4 oxidation
The above experiments have demonstrated that the sample at x = 0.1 after calcination at 500 °C showed the best catalytic activity towards CO oxidation. In the following, this sample was further tested for oxidation of CH4. For comparison, pure CeO2 (x = 0) calcined at 500 °C was also tested under the similar conditions. As monitored by mass spectra, CO2 and H2O were the only detectable products during complete CH4 oxidation. As shown in Fig. 10, for x = 0.1 after calcination at 500 °C, there occurred a CH4 conversion of 50% at 478 °C, which appears to be superior to that of 12% for x = 0 at the same temperature. Samples at x = 0.1 calcined at different temperatures were tested for CH4 oxidation and the results are shown in ESI (Fig. S9†). It is seen that the samples calcined at 400 and 500 °C showed a respectively high CH4 oxidation activity, among which there were no obviously difference in CH4 oxidation activity. However, after higher temperature calcinations at 600 and 700 °C, the activity was dramatically suppressed, with a complete CH4 conversion of 50% at 570 and 750 °C, respectively. The activity variation order for CO and CH4 oxidation are different as calcination temperature increases from 400 to 700 °C, which are caused by the dinstinct active species in CO and CH4 oxidation reactions. In a word, sample at x = 0.1 after calcination at 500 °C can act as an excellent catalyst for CO oxidation, but also for CH4 catalytic oxidation.
 |
| Fig. 10 CH4 oxidation activities of the samples (1 − x)CeO2·xNiO at (a) x = 0.1 and (b) x = 0 prepared after calcinations at 500 °C. | |
Conclusions
A series of samples (1 − x)CeO2·xNiO were prepared by a hydrothermal method combined with a subsequent high-temperature calcination. Calcination of the sample at x = 0.1 in a temperature range from 400 to 700 °C is applied to tune the distribution of Ni2+ ions in internal lattice and surface segregation. Depending on the distributions of Ni2+, the calcined samples showed the different catalytic activities towards CO oxidation. The sample after calcination of x = 0.1 at 500 °C yielded the optimum catalytic activities towards CO oxidation and CH4 oxidation, which is the consequence of the incorporation of more Ni2+ in CeO2 lattice, high concentration of oxygen vacancies, and the associated adsorption/desorption abilities of surface oxygen species. High temperature calcination may damage the solid solution structure, by showing aggregation of surface NiO nanoparticles and the decreased adsorption/desorption abilities of surface oxygen species. The findings reported in this work are fundamentally important, which may help to find more advanced catalytic materials for technological applications.
Acknowledgements
This work was financially supported by NSFC (21025104 and 21271171), and NBRP of China (no. 2011CBA00501 and 2013CB632405).
Notes and references
- J.-H. Park, J. H. Cho, K. H. Cho, T. W. Lee, H. S. Han and C.-H. Shin, Korean J. Chem. Eng., 2012, 29, 1151–1157 CrossRef CAS PubMed.
- S. Pongstabodee, S. Monyanon and A. Luengnaruemitchai, Int. J. Hydrogen Energy, 2012, 37, 4749–4761 CrossRef CAS PubMed.
- V. M. Shinde and G. Madras, Appl. Catal., B, 2013, 138–139, 51–61 CrossRef CAS PubMed.
- H. Noei, L. Jin, H. Qiu, M. Xu, Y. Gao, J. Zhao, M. Kauer, C. Wöll, M. Muhler and Y. Wang, Phys. Status Solidi B, 2013, 250, 1204–1221 CrossRef CAS.
- G. Jiaxiu, S. Zhonghua, W. Dongdong, Y. Huaqiang, G. Maochu and C. Yaoqiang, Appl. Surf. Sci., 2013, 273, 527–535 CrossRef PubMed.
- S. Mahammadunnisa, P. Manoj Kumar Reddy, N. Lingaiah and C. Subrahmanyam, Catal. Sci. Technol., 2013, 3, 730 CAS.
- L.-J. Chen, Y. Tang, L. Cui, C. Ouyang and S. Shi, J. Power Sources, 2013, 234, 69–81 CrossRef CAS PubMed.
- J.-Y. Luo, M. Meng, J.-S. Yao, X.-G. Li, Y.-Q. Zha, X. Wang and T.-Y. Zhang, Appl. Catal., B, 2009, 87, 92–103 CrossRef CAS PubMed.
- T. Tabakova, L. Ilieva, I. Ivanov, R. Zanella, J. W. Sobczak, W. Lisowski, Z. Kaszkur and D. Andreeva, Appl. Catal., B, 2013, 136–137, 70–80 CrossRef CAS PubMed.
- Z. Zhao, X. Lin, R. Jin, G. Wang and T. Muhammad, Appl. Catal., B, 2012, 115–116, 53–62 CrossRef CAS PubMed.
- S. Vivekanandhan, M. Venkateswarlu, D. Carnahan, M. Misra, A. K. Mohanty and N. Satyanarayana, Ceram. Int., 2013, 39, 4105–4111 CrossRef CAS PubMed.
- Z. Zhao, X. Lin, Y. Zeng, T. Bao, R. Jin and T. Muhammad, Int. J. Hydrogen Energy, 2013, 38, 1873–1882 CrossRef CAS PubMed.
- M. Zhang, D. Jiang and H. Jiang, Mater. Res. Bull., 2012, 47, 4006–4012 CrossRef CAS PubMed.
- W. Yu, J. Zhu, L. Qi, C. Sun, F. Gao, L. Dong and Y. Chen, J. Colloid Interface Sci., 2011, 364, 435–442 CrossRef CAS PubMed.
- B. Solsona, P. Concepción, S. Hernández, B. Demicol and J. M. L. Nieto, Catal. Today, 2012, 180, 51–58 CrossRef CAS PubMed.
- D. Li, S. Sakai, Y. Nakagawa and K. Tomishige, Phys. Chem. Chem. Phys., 2012, 14, 9204–9213 RSC.
- Z. Gu, K. Li, H. Wang, Y. Wei, D. Yan and T. Qiao, Kinet. Catal., 2013, 54, 326–333 CrossRef CAS.
- G. Zhou, H. Lan, X. Yang, Q. Du, H. Xie and M. Fu, Ceram. Int., 2013, 39, 3677–3683 CrossRef CAS PubMed.
- A. Kitla, O. V. Safonova and K. Fottinger, Catal. Lett., 2013, 143, 517–530 CrossRef CAS PubMed.
- W. Shan, M. Luo and C. Li, Appl. Catal., A, 2003, 246, 1–9 CrossRef CAS.
- H. Zhou, P. Hu, Z. Huang, F. Qin, W. Shen and H. Xu, Ind. Eng. Chem. Res., 2013, 52, 4504–4509 CrossRef CAS.
- W. Fang, C. Pirez, M. Capron, S. Paul, T. Raja, P. L. Dhepe, F. Dumeignil and L. Jalowiecki-Duhamel, RSC Adv., 2012, 2, 9626 RSC.
- N. M. Deraz, J. Anal. Appl. Pyrolysis, 2012, 95, 56–60 CrossRef CAS PubMed.
- C. Xian, S. Wang, C. Sun, H. Li, S. Chan and L. Chen, Chin. J. Catal., 2013, 34, 305–312 CrossRef CAS.
- J. Xu, B. Xue, Y.-M. Liu, Y.-X. Li, Y. Cao and K. N. Fan, Appl. Catal., A, 2011, 405, 142–148 CrossRef CAS PubMed.
- V. Gonzalezdelacruz, J. Holgado, R. Pereniguez and A. Caballero, J. Catal., 2008, 257, 307–314 CrossRef CAS PubMed.
- S.-C. Baek, J.-W. Bae, J. Y. Cheon, K.-W. Jun and K.-Y. Lee, Catal. Lett., 2010, 141, 224–234 CrossRef PubMed.
- X. Zhang, A. Gu, G. Wang, B. Fang, Q. Yan, J. Zhu, T. Sun, J. Ma and H. H. Hng, Cryst. Eng., 2011, 13, 188 CAS.
- G. Wrobel, M. P. Sohier, A. Dhuysser, J. P. Bonnelle and J. P. Marcq, Appl. Catal., A, 1993, 101, 73–93 CrossRef CAS.
- M. Zhao, G. Li, J. Zheng, L. Li, H. Wang and L. Yang, Cryst. Eng., 2011, 13, 6251 CAS.
- J.-G. Li, T. Ikegami, Y. Wang and T. Mori, J. Solid State Chem., 2002, 168, 52–59 CrossRef CAS.
- X. D. Zhou and W. Huebner, Appl. Phys. Lett., 2001, 79, 3512 CrossRef CAS PubMed.
- A. Thurber, K. Reddy, V. Shutthanandan, M. Engelhard, C. Wang, J. Hays and A. Punnoose, Phys. Rev. B: Condens. Matter Mater. Phys., 2007, 76, 165206 CrossRef.
- M. Zhao, G. Li, L. Li, L. Yang and J. Zheng, Cryst. Growth Des., 2012, 12, 3983–3991 CAS.
- J.-G Li, T. Ikegami and J.-H. Lee, Acta Mater., 2001, 49, 419–426 CrossRef CAS.
- G. Yang, H.-H. Ko, Y.-W. Hsu, K.-H. Yang, M.-C. Wang, J. Han and X. J. Zhao, Ceram. Int., 2013, 39, 6805–6811 CrossRef CAS PubMed.
- D. Qiao, G. Lu, D. Mao, Y. Guo and Y. Guo, J. Mater. Sci., 2010, 46, 641–647 CrossRef.
- N. M. Deraz and A. Al-Arifi, Polyhedron, 2010, 29, 3277–3282 CrossRef CAS PubMed.
- S. Sun, X. Zhao, H. Lu, Z. Zhang, J. Wei and Y. Yang, Cryst. Eng., 2013, 15, 1370 CAS.
- W. Weber, K. Hass and J. McBride, Phys. Rev. B: Condens. Matter, 1993, 48, 178–185 CrossRef CAS.
- Z. Wu, M. Li, J. Howe, H. M. Meyer 3rd and S. H. Overbury, Langmuir, 2010, 26, 16595–16606 CrossRef CAS PubMed.
- Y.-M. Liu, L.-C. Wang, M. Chen, J. Xu, Y. Cao, H.-Y. He and K.-N. Fan, Catal. Lett., 2009, 130, 350–354 CrossRef CAS.
- N. Yisup, Y. Cao, W.-L. Feng, W.-L. Dai and K.-N. Fan, Catal. Lett., 2005, 99, 207–213 CrossRef CAS PubMed.
- E. Rocchini, A. Trovarelli, J. Llorca, G. W. Graham, W. H. Weber, M. Maciejewski and A. Baiker, J. Catal., 2000, 194, 461–478 CrossRef CAS.
- B. Choudhury and A. Choudhury, Mater. Chem. Phys., 2012, 131, 666–671 CrossRef CAS PubMed.
- Y. Zuo, X. Huang, L. Li and G. Li, J. Mater. Chem. A, 2013, 1, 374 CAS.
- H.-S. Roh, K.-W. Jun and S.-E. Park, Catal. Lett., 2001, 74, 1–2 CrossRef.
Footnote |
† Electronic supplementary information (ESI) available: Experimental details, XRD, SEM, Raman, CO oxidation activity and pseudocapacitance performance. See DOI: 10.1039/c3ra44186e |
|
This journal is © The Royal Society of Chemistry 2014 |
Click here to see how this site uses Cookies. View our privacy policy here.