Md. Nasir Uddin
a,
W. M. A. Wan Daud
*a and
Hazzim F. Abbas
b
aDepartment of Chemical Engineering, Faculty of Engineering, University of Malaya, 50603 Kuala Lumpur, Malaysia. E-mail: ashri@um.edu.my; nasir_cep01@hotmail.com; Fax: +60 379675319; Tel: +60 1111200713
bDepartment of Chemical Engineering, University of Nizwa, Al Dakulaya, Oman
First published on 18th December 2013
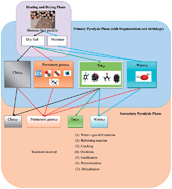
This study investigates the effects of different parameters such as biomass composition, moisture content, particle size, heating rate, temperature, inert gas, reactor system, and catalyst on the production of hydrogen gas (HG) and other gases (OGs) such as CO2, CO, CH4, C2H6, and so on. The reformation of OGs into H2 via the shift reaction significantly increases the total HG formation during biomass pyrolysis. Biomass raw material is capable of producing different proportions of HG at different temperatures because the raw material structure varies from one material to another. It is very puzzling that the formation of HG and total gas (TG) could either increase or decrease with moisture and this result varied between researchers. Smaller particles are more suitable than larger ones in terms of HG and TG formation. Additionally, longer residence times and higher temperatures favor good HG yield while the heating rate is a function of heat flux and particle size of biomass fuel is supposed to increase the pyrolytic gases and properties. Moreover, the heating rate would play a smaller role on the process when the system is introduced with inert gas and if the purpose is to maximize the production of TGs, secondary reactions such as thermal cracking, re-polymerization, and re-condensation should be maximized because the inert gas removes the volatiles from the pyrolysis environment. Therefore, the ultimate product of biomass conversion is dependent on the reactor design and type of feedstock in the presence of appropriate catalysts.
No. | Reaction | Equation | ΔH°298 K [KJ mol−1] |
---|---|---|---|
a The lumped reaction schemes of cellulose, hemicelluloses and lignin.5b Active cellulose is a molten-phase intermediate cellulose that is produced at the initial state, as suggested by Ranzi et al.5c The decomposition of hemicellulose firstly degrades in two intermediate species, namely hemicellulose one (HCE1) and hemicellulose two (HCE2), and xylose monomer, obtained via HCE1 only, is here considered as a relevant component of the tar fraction.5d Lignins are complex racemic polymers mainly derived from hydroxycinnamyl alcohol monomers with different degrees of methoxylation. The complex chemical structure of lignins requires the adoption of different reference components: this means that the lignins are approximated, case to case, by a mixture of reference components. They are identified by lignin-C, lignin-O, and lignin-H, which recall their characteristics of being richer in carbon, oxygen, and hydrogen, respectively.5 The reference components decompose, release gases, and form intermediate components that are involved in substitutive additions and cross-linking reactions with a progressive charification of the solid residue. Here, we used only lignin-C to describe the significance of lignin degradation for the sake of simplicity. | |||
(1) | Pyrolysis | Biomass ↔ H2 + CO + CO2 + CH4 + H2O + Tar + Char | >0 |
(2) | Water–gas shift (secondary reaction) | CO + H2O ↔ H2 + CO2 | −41.2 |
(3) | Steam reforming: CH4 | CH4 + H2O ↔ 3H2 + CO | 206.2 |
(4) | Steam reforming: tar | CnHmOp + (2n − p)H2O ↔ nCO2 + (1/2m + 2n − p) H2 | >0 |
(5) | Thermal cracking | CnHm ↔ Cn−x Hm−y + H2 + CH4 + C | >0 |
Cn−x Hm−y is one of many compounds and lighter than CnHm | |||
(6) | Carbon–oxygen | C + 1/2O2 ↔ CO | −110.5 |
(7) | Water gas (primary reaction) | C + H2O ↔ CO + H2 | 131.3 |
(8) | C + 2H2O ↔ CO2 + 2H2 | 90.1 | |
(9) | Boudouard | C + CO2 ↔ 2CO | 172.5 |
(10) | Hydrogenation | C + 2H2 ↔ CH4 | −74.9 |
(11) | Cellulose degradationa | Cellulose → Active Celluloseb → C2H4O2 + C2H2O2 + CH3CHO + C3H6O + CO2 + CO + CH4 + H2O + 5-hydroxymethyl-furfural + Char | >0 |
Active cellulose → Levoglucosan | |||
Cellulose → Char + H2O | |||
(12) | Hemicellulose degradationa | Hemicellulose → Intermediate hemicellulosec → H2 + H2O + CO + CO2 + CH2O + CH3OH + C2H5OH + Char | >0 |
Intermediate hemicellulose → Xylose | |||
(13) | Lignin degradationa | Lignind → Para-Coumaryl + Phenol + H2 + H2O + C3H4O2 + CO + CH4 + C2H4 + Char | <0 |
Lignin → C11H12O4 |
To form the gas, secondary reactions might occur in the vapor phase or between the vapor and solid phases. The H2 yield is the desired product of the pyrolysis process and is favored by these secondary pyrolysis reactions of volatile species.5 Therefore, the secondary gas-phase reactions play a key role in product formation during the pyrolysis process.6 In Table 1, eqn (2) and eqn (3) are known as gas-phase reactions that come from the reaction of volatiles released from pyrolysis at high temperatures and determine the final gas composition and properties. CH4 and other organic pyrolysis products can undergo steam reforming (eqn 3 and 4) to produce carbon oxides and H2; these reactions are all endothermic. Also endothermic is the thermal cracking of tar to produce secondary, lighter tar products (eqn (5)).
Eqn (2) is known to have a profound effect in enhancing the H2 content of syngas whereas the CH4 content of syngas is affected by eqn (3). CO and H2 are produced according to the reaction pathways shown by eqn (3). Consequently CO reacts with H2O to yield H2 and CO2, as shown by eqn (2). A low temperature is thermodynamically supposed to be favorable as these reactions are exothermic in nature. However, at low temperature, the rates of the reactions expected to be reduced.7,8 Thus, the potential yield of hydrogen is positively correlated with the high steam to carbon ratio9 along with the assistance of appropriate catalysts; for example, ceria–zirconia supported Rh or Pt catalysts and co-precipitated Ni–Al catalysts in the systems.10,11
The conversion of solid carbon into gaseous products is followed by four gas–solid reactions of pyrolysis, namely the carbon–oxygen reaction (eqn 6), carbon–water reaction (eqn 7–8), Boudouard reaction (eqn 9), and carbon hydrogenation (eqn 10). The importance of eqn (6) is not limited only for supplying adequate energy in the case of pyrolysis followed by some subsequent steps of heating and drying processes, but also it drives eqn (9) and eqn (7–8) by means of providing the thermal energy, and thus, the formation of CO and H2 can occur from char gasification. Eqn (10) also gives little energy for the endothermic reactions and contributes to total gas (TG) formation. In comparison to eqn (6), the contribution of eqn (10) seems to have a negligible impact due to the concentration of H2 being relatively very low in the gasification environment (i.e., atmospheric pressure and/or high temperatures).
Biomass contains cellulose, hemicelluloses, lignin and a small fraction of extractives in its structure. However, the proportion of these biopolymers varies from one biomass species to another.13,14 Biomass pyrolysis products are a complex combination of the products from the individual pyrolysis of cellulose, hemicellulose, and extractives, each of which has its own kinetic characteristics.13,15 The decomposition of cellulose and hemicelluloses in biomass forms anhydro-sugars and other highly oxygenated compounds and the depolymerization of lignin in biomass forms oligomers and phenolic monomers. The typical reaction schemes of cellulose (eqn 11), hemi-cellulose (eqn 12), and lignin (eqn 13) showed significant yields of H2 and OGs during biomass pyrolysis. The pyrolysis of these compounds generates tarry vapors. Smaller compounds or larger compounds involving polyaromatic hydrocarbons (PAHs) can be formed from the cracking of these compounds or condensation of these formed compounds at high temperatures, respectively. PAHs have a significant role to build up the tar structure. The inorganic compounds (ash) and porous carbonaceous solid (char) can also be formed from pyrolysis at gasification temperatures; which do not volatilize at the end of the reaction.
An extensive study has been attempted to report the pyrolytic products (TGs, total liquid and char) and also the individual products from biomass that depend to a large extent on the composition of the raw material employed, the moisture contents, the particle size, and the way of operation, primarily temperature and heating rate.16–18 The yields and the rate of the process vary widely with operating conditions and between one fuel and another. The reason is that, besides the nature of the parent fuel, the peak temperature and the heating rate at which the fuel material is thermally decomposed influence the yield of the species and the rate.19,20
Kalinci et al.21 showed that the gas composition and the energy contents of the fuels are highly dependent on the feedstock composition. It is also found that woody biomass appears to have a higher potential for HG production compared to agricultural residues.22 A pyrolysis process with smaller particles generates more HG, as shown by Yin et al.23 The generation of H2, CO, CH4, and C2H4 increased significantly with process temperature.24 It is noteworthy that if the pyrolysis temperature is high, TG products are generated at a higher rate while liquid formation decreases due to the degradation of heavier molecules.25 Moreover, higher residence times of volatiles and higher temperatures can increase the pyrolytic carbon formation as a result of the extension of secondary reactions.26 Higher heating rates favor a quick release of volatiles, modifying the solid residue structure with an increased yield of the liquid and gaseous fractions.27 Catalytic pyrolysis has been reported to be a productive means of increasing gas yield by decreasing the amount of liquid as well as positively affecting the quality of the organic composition of the oils, providing in situ-upgrading.28
It is known from the above discussions and reactions that the maximization of H2 may be a challenge during the biomass pyrolysis process. The reaction variables play a significant role in the task that is related to the kinetics of the process employing H2 with those producing and seizing the OGs such as CH4, C2H4, C2H6 CO, CO2, H2O, and other constituents. Moreover, the lower hydrogen content in biomass (approximately 6% versus 25% for methane) and lower energy content due to the high oxygen content (about 40 wt% of biomass) are another challenge for obtaining the maximum hydrogen yield from biomass.29
However, this review will focus on the lightest pyrolytic products such as H2, CH4, C2H6, C2H4, H2O, CO, and CO2, which are altered by reactions (2)–(10), in order to consider how the HG yield can be maximized from the biomass pyrolysis process. To fulfil this aim, the effects of reaction parameters such as biomass composition,30,31 particle size,32 heating rate,33,34 temperature,35 inert gas,36 reactor configurations,37 catalyst38 on the HG yield and the properties of the products will be investigated.
Secondary pyrolysis is relevant for extra-particle pyrolysis whereas intra-particle pyrolysis stands for primary pyrolysis and the difference between them is not well established due to the fact that volatiles that are subjected to secondary reactions can take place either in the particle pore side and/or in the bulk gas phase side. Therefore, a general conclusion from the aforementioned mechanisms is that a simultaneous reaction of primary and secondary may happen in isolated sections of a raw material. Moreover, the secondary reactions can be motivated by the catalytic behavior of produced char from the primary pyrolysis step and yields light hydrocarbon gases as well as secondary char that comes from cracking and polymerization reactions, respectively. Furthermore, the produced char can itself be transformed into gas species followed by gasification reactions along with H2O and CO2. Nevertheless, there is a difference in reaction rate between charring and primary pyrolysis reactions as the transformation of produced char is controlled at the time of volatiles liberation within the fuel particle. Comparatively, secondary reactions of primary volatiles are a rapid pathway. The yield of ultimate volatiles and composition from secondary reactions of the primary volatiles is significantly dependent on the operating conditions of the process (refer to Section 3). The effect of primary shrinkage and fragmentation of the raw materials on the ultimate product species are also determined by the physico-chemical pathways as shown in Fig. 1.
Based on primary pyrolysis as well as secondary conversions, the composition of pyrolytic volatiles in this paper is organized accordingly: H2, CO, CO2, H2O, LAHCs such as CH4, C2H4, C2H6, etc., and condensable products at surrounding conditions. A small number of chemical species of different molecular weights as well as different boiling points are responsible to build up a complex mixture that is referred to as condensable organics. The collective name of these condensable organics can be designated as “tar” for the cause of simplicity in the present study.
Raw material | Cellulose (wt%) | Hemicellulose (wt%) | Lignin (wt%) | MC (wt%) | Ash (wt%) | HHV (MJ kg−1) | Reaction temperature (°C) | HG yield (vol %) | Ref. |
---|---|---|---|---|---|---|---|---|---|
a Note: moisture content and ash ((a% basis), (bdry and ash free basis), (cdry basis) and (dmoisture free); unless others units are stated); HG yield ((ewt%), (f%), (gNm3 kg−1 biomass), and (hg/gsample); unless others units are stated). “nd” represents that values are not found in original work. | |||||||||
Walnut shell | 25.5 | 22.2 | 52.3 | nd | nd | nd | 750 | 19.0e | 42 |
Olive husk | 40.8 | 38.5 | 20.6 | nd | nd | nd | 750 | 24.5e | 42 |
Wheat Straw | 29.8 | 34.6 | 17.1 | nd | nd | nd | 750 | 22.5e | 42 |
Olive husk | 22.5 | 21.1 | 44.9 | nd | 3.6 | 19 | 750 | 70.3 | 43 |
Cotton cocoon shell | 32.6 | 10.2 | 48.7 | nd | 5.8 | 18.3 | 750 | 59.9 | 43 |
Tea factory waste | 28.8 | 18.9 | 37.8 | nd | 3.4 | 17.1 | 750 | 60.3 | 43 |
Palm shell | 20.8 | 22.7 | 50.7 | 5.73 | 2.21 | nd | 900 | 33.49 | 44 |
Almond shells | 29 | 28 | 35 | 7.90 | 1.16 | nd | 770 | 55.5 | 45 |
Olive waste | nd | nd | nd | 7.1 | 4.7 | 20.25 | 800 | 15.8 | 46 |
Straw pellet | nd | nd | nd | 7.1 | 3.2 | 18.51 | 800 | 24.2 | 46 |
Bagasse | nd | nd | 24 | 5.1 | 1.2 | nd | 850 | 15.7 | 47 |
Corn cob | 34.3 | 40.53 | 18.8 | 7.5 | 8.06 | nd | 500 | 4.20 | 48 |
Corn stalk | 32.4 | 40.8 | 2.5 | 6.44 | 2.3 | nd | 500 | 1.56 | 48 |
Hazelnut shell | 24.7 | 27.5 | 43.10 | 10.40a | 1.30a | 17.36 | 500 | 11.8f | 49 |
Hazelnut shell | 26.9 | 28.7 | 44.4 | 8b | 1.3b | nd | 750 | 60.2 | 50 |
White quebracho | nd | nd | 35 | 5 | 0.3c | nd | 800 | 16.2 | 47 |
Wood birch | 42.6 | 31.8 | 21 | 5 | 0.3d | 17.07 | 800 | 17.3 | 46 |
Dalbergia sissoo | 36.75 | 11.30 | 43.65 | nd | 3.90c | 18.06 | 750 | 0.31g | 51 |
Beech wood | 43.3 | 32.4 | 21.6 | nd | 0.6c | 19.9 | 750 | 48.3 | 52 |
Spruch wood | 43.8 | 25.9 | 28.5 | nd | 0.5c | 20.3 | 750 | 49.6 | 52 |
Sewage sludge | nd | nd | nd | 1.74 | 33.91 | 16.34 | 1000 | 0.076h | 53 |
It can be clearly seen from Table 2 that the pyrolytic properties of biomass are controlled by the chemical composition of its major components, namely cellulose, hemi-cellulose, and lignin, and that HG formation from biomass depends on the type of feed, only under the same thermal conditions, however, at different thermal conditions/reactor type, especially vapor residence time gives different compositions of HG. Therefore, it is noteworthy that HG rather depends on the thermal severity and in a much lower extent to biomass feedstock.54 Thermal decomposition of these components generates different kinds of volatiles such as CO, CO2, H2O, and H2, and LAHCs, namely CH4, C2H6, C2H4, and C3H8. It is predicted that more than 200 intermediate products are formed at the time of biomass pyrolysis.13
It is visualized from Table 2 that the production of HG from wheat straw pyrolysis is lower (22.5 wt%) than that from olive husk (24.5 wt%).42 At a temperature of 750 °C, olive husk, cotton shell, and tea waste give different percentages of HG while olive waste, straw pellet, wood birch, and white quebracho give different proportions of HG. At this temperature, olive husk gives the highest HG compared to the other raw materials considered, because the higher heating value (HHV) of olive husk increases with its lignin content and thus H2 increases.55 In addition, lignin contents generated more HG than cellulose or hemi-cellulose by decomposition. Different types of ligno-cellulosic fuels have different types of lignins and extractives in their structures. However, Nipattummakul et al.53 pointed out that sewage sludge generated more HG than other feedstocks. For example, 0.047, 0.045, and 0.022 H2 gas per gsample are produced from paper, food waste, and sewage sludge, respectively, at optimized conditions. A possible explanation could be that the steam to solid fuel ratio decreased with temperature and increased the HG production as well as the total energy.56
From Table 2 it can be seen that straw pyrolysis led to the formation of a larger amount of HG than olive waste and wood. This is because straw has a lower density than wood and olive waste; thus its falling velocity is lower in the reactor and cracking of hydrocarbon increases as a result.46 On the other hand, Ioannidou et al.48 pointed out that corn cobs pyrolysis would generate more HG due to the high lignin content while corn stalks would generate less HG. Nevertheless, in the presence of a catalyst at 500 °C this situation is altered, so that corn stalks yield more HG than corn cobs due to the high cellulose content and thus H2 production increases.57 It is predicted that hazelnut shells decompose thermally between 300 and 600 °C and hence the gas mixture increases rapidly.49 In this temperature range, thermal conversion of hazelnut shells could be reached in 73% and the TGs mixture was quickly enhanced.
Moreover, at a temperature of 600 °C, the gas mixture did not increase directly but char conversion into gas increased the TG mixture and HG increased linearly.49 However, HG production from hazelnut shells was lower and the energy content was also lower due to the 42.6% oxygen content of the sample, but the yield increased if the temperature increased.50 Cellulose decomposition and HG formation increased proportionally with temperature.58 Hemi-cellulose decomposed at 350 °C while cellulose decomposed between 250 and 500 °C. Lignin pyrolyzed more slowly compared to the other materials between 150 and 900 °C because it has a higher thermal stability.57
However, the pyrolytic chemistry of ligno-cellulosic biomass is very complicated and proceeds through consecutive and parallel reaction mechanisms. The details of the mechanism are out of this paper scope. From aforementioned discussions, it can easily be observed that the formation of HG and OGs from biomass pyrolysis shows multiphase complexities, which can be attributed to multi-scale structure and the anisotropic properties (density, thermal conductivity, composition etc.) of biomass feedstocks as well as temperature and type of reactors.54 During the conversion biomass process, these properties are expected to be varied and hence, difficulties in predicting the properties and product distribution from biomass may also be remarkably high. In general, it is obvious from Table 2 that woody biomass (wood birch, beech wood, spruce wood, etc.) seems to have a greater potential for HG production than agricultural residues (wheat straw, olive waste, olive husk, bagasse, etc.).22
![]() | ||
Fig. 2 Relationship between LHV of pyrolytic gases and temperature. Adapted from Neves et al.64 |
The major drawback of using biomass as a fuel is the high MC. The endothermic nature of water evaporation may be observed, even though the reaction of combustion is considered to be exothermic. It is noteworthy that the MC of biomass fuels is expected to be no more than 65% (wet basis) to precede the combustion process as an independent process.60 Additionally, it is noticed that the correlation between the heating value of biomass fuel and the relative amount of water is estimated to be negative although the maximum acceptable limit of MC shows that the range of MC is suitable for the process.61,65
In Fig. 3, the relationship between the heating value of biomass fuels and MCs is represented and plotted data shows that both of the HHV and LHV of biomass fuels is expected to decrease due to the MC increase. The terms, for example HHV and LHV, are used here to explain the heat formation of a unit quantity of fuel during its complete combustion. Liquid and vapor phases of water are used as a reference, respectively to determine the HHV and LHV values of biomass fuel. In combustion, the heat of condensation of water vapor usually expresses HHV values of biomass fuels, but it might not be surprising to see that the trend of LHV is always below that of the HHV.65,66 The oxygen content of biomass is supposed to be an important feature of biomass fuel. 35 wt% of MC is typically observed in biomass fuels, which is ten times higher than that of a high-rank coal (4 wt%).65
![]() | ||
Fig. 3 Correlation between heating value and moisture content of biomass fuel. Adapted from Quaak et al.65 |
Lede et al.67 demonstrated that ligno-cellulosic materials contain less than 50% lignin and moisture; agricultural products contain less than 20% lignin and moisture, and aquatic biomass is characterized by a very high MC. Additionally, Bridgwater68 showed that the water content of the feed during pyrolysis is typically 12 wt% of dry feed. Moreover, about 10% moisture was generally required for a fast pyrolysis process while slow pyrolysis could be slightly more moderate for MC as highlighted by Bridgewater.37 However, in the case of wood pyrolysis, the moisture range is typically about 15–20%.69
A very wide range of differences because of the MC effect was highlighted by Furness et al.70 They generalized that excess water or higher MC affects the process efficiency and gas compositions, and that higher water content in the feedstock causes an increase in the production of hydrogen and methane. The influence of MC in raw biomass was also investigated by Plis and Wilk71 who found that the CO content in syngas is higher in the case of dry fuels, whereas the CO2 content increases with increasing moisture in the feedstock. Additionally, higher MC in the biomass reduces the molar fractions of the combustible components and the efficiency of the process. In order to examine the effects of biomass MC on syngas, Antonopoulos et al.72 developed a non-stoichiometric model for a downdraft gasifier using olive wood, miscanthus and cardoon. The increase in biomass MC decreases the LHV of the produced gas. A 40% increase in fuel MC results in an approximately 1 MJ m−3 reduction of the LHV of the synthesized gas. Perez et al.73 experimented with a downdraft reactor and pine bark as the feedstock, and concluded that the optimum fuel MC level was 10.62%. Hosseini et al.74 conducted a thermodynamic analysis of the effects of MC on the energy efficiency of gasification with air and steam with sawdust. When the moisture fraction of the feed biomass entering the gasifier was increased from 0.15 to 0.25 (kg of moisture to kg of wet biomass) the energy efficiency of the steam-biomass gasification process decreased from 17.8% to 16.4%. This change was from 19.1% to 18.4% for the air-biomass gasification process.
To get the best result from the pyrolysis process, it is predicted that 7% moisture content is suitable for the entire process because excess MC consumes a huge amount of heat and thus leads to low percentage yields.75 Nevertheless, Antal et al.76 showed that the presence of high MC during pyrolysis under atmospheric pressure systematically increases char yields and thus lowers HG and OG yields. This may be attributed to the fact that the presence of water (high MC contained biomass produces water during pyrolysis) promotes volatile vapor phase intermediate (VVPI) production and production of secondary char from this VVPI, respectively. However, Guoxin et al.77 showed that the formation of H2 gas was enhanced with MC. They showed that the pyrolysis of wet biomass with a moisture content of 47.4 wt% gave a higher yield of H2 than pyrolysis of predried biomass with a moisture content of 7.9 wt%, under the conditions of fast-heating rate and without the use of sweeping gas. Additionally, the rate of hydrogen formation increased with an increase in the rate of water evaporation until its value reached an optimum point. Beyond this point, the rate of hydrogen formation decreased due to water vaporized being in excess of that of the conversion capacity of reduction bed and decrease in the equivalence ratio.51
Notwithstanding, a decrease of drying and primary pyrolysis rates can be accounted as with the increasing PS. A simultaneous decomposition of drying and primary pyrolysis in several segments of the particle may occur because of non-uniform heating. Both of the pathways are directed towards from a high temperature zone to a low temperature zone gradually as well as serially. The high temperature zone stands for the outer surface of the particle whereas the low temperature zone stands for the centre of the particle. Therefore, the decomposition of fuel may proceed through different reaction zones throughout a large particle as: an inner zone that comprises of less or more raw material and drying happens; the yield of primary volatiles comes from the reaction of dry raw materials in a middle zone and the complete exhaustion of moisture and char layer in an outer zone. With increasing PS, the newly generated product species are supposed to be increased and the moisture is subjected to intra-particle secondary reactions. The product species formed from drying and primary pyrolysis steps are directed towards to take across the hot char layer to escape the particle. Moreover, the transportation of these product species through larger particles may accelerate both the heterogeneous as well as homogeneous reaction probability within the particle. In addition, the effectiveness of the reactions (heterogeneous reactions) between volatiles and char surfaces are expected to be high as as the time passes, the thickness of char layer increases in a large particle.
However, this review considered numerous investigations that have been carried out to explore the effect of biomass PS on gas composition and HG yield. Table 3 explores the effect of PS on the formation of HG and OG.
Raw material | MC (wt%) | Ash (wt%) | PS mm | T (°C) | HG yield (%) | OG yield (%) | Ref. | ||||
---|---|---|---|---|---|---|---|---|---|---|---|
CO | CO2 | CH4 | C2H6 | C2H4 | |||||||
a “a” – moisture content (MC) measured in wet basis. “b” – ash content measured in dry basis. “c” – PS expressed in terms of μm basis. “d” – references expressed the gas yield in the basis of wt% while rest of the values are in vol% basis. “nd” – corresponding values are not found in original work. | |||||||||||
Pine sawdust | 8.61 | 1.02 | 0.15–0.3 | 900 | 43.17 | 20.18 | 31.68 | 4.48 | 1.68 | 2.52 | 78 |
0.3–0.6 | 40.65 | 17.94 | 36.73 | 3.92 | 1.12 | 2.24 | |||||
Palm oil waste | 5.73 | 2.21b | 5–2 | 850 | 54.95 | 17.86 | 19.86 | 4.92 | nd | nd | 79 |
1–0.15 | 57.50 | 16.40 | 22.70 | 2.57 | nd | nd | |||||
White oak | nd | 0.5 | 15 | 600 | 0.001 | 0.183 | 0.110 | 0.018 | nd | nd | 80 |
20 | 0.00096 | 0.167 | 0.104 | 0.017 | nd | nd | |||||
Pine sawdust | 8a | 0.55b | 0.6–0.9 | 800 | 31.61 | 37.25 | 21.18 | 6.63 | 0.10 | 2.65 | 81 |
0.2–0.3 | 30.47 | 40.59 | 16.75 | 7.79 | 0.26 | 3.64 | |||||
Wood | 7 | 0.4b | 0.35 | 1000 | 0.025 | 0.09 | 0.12 | 0.060 | 0.001 | 0.012 | 24d |
0.80 | 0.027 | 0.08 | 0.11 | 0.058 | 0.005 | 0.011 | |||||
Beech wood | nd | nd | 5 | 750 | 0.25 | 0.44 | 0.2 | 0.13 | nd | nd | 82 |
10 | 0.30 | 0.42 | 0.15 | 0.16 | nd | nd | |||||
Bituminous coal | 2.4 | 3.4b | 100–125c | 1000 | 2.12 | 3.97 | 1.78 | 2.74 | 0.61 | 0.25 | 83d |
200–250c | 2.10 | 3.73 | 1.81 | 2.95 | 0.78 | 0.23 |
From Table 3, it can be seen that the formation of HG and OG differs in terms of product distribution depending on whether the PS is increased or decreased due to the raw materials having varying compositions in their original structures. For example, when the PS of beech wood increased from 5 to 10 mm, the H2 and CH4 concentrations increased while the CO and CO2 concentrations decreased.82 In accordance with this, when the PS of bituminous coal increased from 100–125 to 200–250 μm, the formation of CO2, CH4, and C2H6 increased while that of H2, CO, and C2H4 decreased.83 In addition, the yield of CO2 increased when the PS of pine sawdust increased from 0.15–0.3 to 0.3–0.6 mm while yields of H2, CO, CH4, C2H6, and C2H4 decreased.78
Scott et al.84 pointed out that when PS increased remarkably with time, the secondary reactions could also be high since the interior surface of PS is associated with a slow heating rate. Such conditions significantly favor the formation of HG and OGs rather than liquid production. A low yield of liquid products can be achieved by pyrolysis of large fuel particles84,85 and thus, the secondary reactions of volatiles may be influenced by the PS. For instance, the highest tar production can be decreased from 53 to 38% of fuel when tested PS increased from 53–63 mm to 270–500 mm, respectively.85 An increase of PS from 3 to 12 mm can be also influenced on the secondary reactions at 500 °C in a fluidized bed from fuel pyrolysis.86 Sensoz et al.87 stated that the gas yield increased from 16.77 to 19.10% when the PS increased from 0.425 to 0.85 mm during rapeseed pyrolysis in a fixed bed reactor at 500 °C with a heating rate of 40 °C min−1. The possible explanation of this aspect that the tar conversion may be raised as the PS is enhanced is due to a very negligible probability of homogeneous tar cracking reactions fewer than 500 °C that promoted the catalytic activity of the char layer.
A good agreement with these findings showed that a small part of tar is expected to be more supported to cracking of the char layer under/or even below 500 °C during biomass derived tars cracking whereas the cracking of gas-phase is highly resistive.88 Broadly speaking, an increase of PS significantly increases the water yield at around 500 °C.89 This may be explained as the transformation of species generated tars can be increased when it goes through the hot char layer in a large particle that motivated (catalytic activity) the fuel conversion pathways. On the other hand, a change of water yield can be found at 400–600 °C because the cracking of tar in the char layer has no significant effect.88,90 Coking (secondary char) in LAHC gases can be accounted for by the conversion of tar in presence of cracking of char layer.88 Therefore, a high yield of secondary char may be caused by the tar conversion within a larger particle and such types of results can be reported in the wood pyrolysis at 850 °C using a fluidized bed reactor.18 In that experiment, a 6% char yield was reported for increases of PS from 6–20 mm. Similarly, Gaston et al.80 pointed out that yields of LAHC gases decreased when PS increased because more char and condensate formed.
It can be seen from Table 3 that the yield of CO2 decreased while yields of CO, CH4, C2H6, and C2H4 increased when the PS of pine sawdust decreased from 0.6–0.9 mm to 0.2–0.3 mm. The largest particles led to the formation of 21 g less H2 than the smaller ones per kilogram of biomass (wet basis).81 In addition, palm oil waste produced more H2 and CO2 rather than CO and CH4 when the PS decreased from 2–5 mm to 1–0.15 mm. A possible explanation for this is that for large PSs the pyrolysis process is mainly controlled by heat transfer and possibly by liquid-phase diffusion because it is more difficult for the resultant product inside the particle to diffuse out, but reaction kinetics dominate the process when the PS is smaller.79
Additionally, smaller particles would be preferable for HG production and offer better combustion performance.16,23 Moreover, Nipattummakul et al.53 stated that a smaller PS not only increased hydrogen formation but also decreased char and tar formation, resulting in increased TG formation. A possible explanation could be that the particle surface area increased when the PS was smaller, improving the heat conduction efficiency, and thus improving the heating rate of biomass. Such results might account for the production of more HG with less char formation.91 However, Westerhof et al.92 pointed out that the gas yield decreased rapidly when the PS of beech wood decreased from 1 to 0.25 mm in a fluidized bed reactor at 500 °C. It is noteworthy that the temperature and PS do not affect the particle residence time during biomass pyrolysis, rather it depends on the type of reactor.24
Nevertheless, the heating rate of biomass particles has a viable effect on the final composition and properties of the product species. Generally, a high yield of liquids and a low yield of char can be subjected to a fast heating rate.93 For instance, a 10 wt% of tar yield of fuel was attained for an enhancement of the heating rate from 1–1000 °C per second.94 An increase of PS from 0.3 to 1.5 mm leads to a decrease of liquids yield at 500 °C using a fluidized bed reactor.90 Blondeau et al.95 reported that larger PSs produced more gas than smaller ones as the mean heating rate decreased with PS. In addition, when the PS increased, the thermal diffusion rate within the particle subsequently decreased, causing a lower heating rate, which increased the production of HG and OGs.
In Fig. 1, a rapid evolution of the volatiles produces huge heat at the pore side and thus, a higher internal pressure may break down the raw materials into fragments. In large biomass particles, the primary fragmentation is expected to be significant for a particular thermal severity (temperature and heat flux function).96 Therefore, it can be inferred from the previously mentioned discussion that if the small fragmentation of biomass particle breakage is supposed to meaningful before the completeness of primary pyrolysis, then the secondary reactions of tars may be influenced by the PS oppositely. This may be attributed to an immediate escape of the released volatiles inside the particle, which may happen without further intraparticle secondary conversions due to the initial phase of pyrolysis being subjected to small fragments and the fracture of the surface.
A plethora of investigations of PS effect on the product composition and properties showed that there is still a lack of knowledge to understand the PS effects mechanisms as well. With regard to these aspects, ten investigations46,97–105 proved that PS has a viable effect on product distribution whereas five investigations106–110 have reported that it has no effect on product composition as well as properties.
The thermolytic decomposition (above 600 °C) of solid fuel particles of biomass formed primary volatiles that include pyrolytic water and tars. The formation of liquid may be increased rapidly below 600 °C whereas the variation of total gas yield cannot be found in significant levels. A 45–75% liquid yield is expected to be in fast heating rates whereas 35–55% liquid yield denotes slow heating rates. 5–20% pyrolytic water yield is estimated to be below 300 to above 800 °C. It is noteworthy that below 300 °C, nearly all pyrolytic water is produced from the initial stage of pyrolysis. The relationship between almost constant pyrolytic water yield and temperature profile shows that the solid fuel liberates primary tars and hence, at 450–550 °C, the yield of total liquid is increased.111,112
Primary volatiles are subjected to a secondary conversion (secondary pyrolysis of tars) above 450–550 °C and thus, a reduction of pyrolytic liquid yield can be started. In comparison to the pyrolytic water yield, a similar volume of liquid yield (below 30%) can be found at 900 °C. This may be because the pyrolytic water is subjected to a secondary destruction/formation. The formation of LAHC gases indemnified the reduction of liquid yield. Above 600 °C, the fast pyrolysis would give 5–20% char yield while 10–30% char yield comes from slow pyrolysis. A broad explanation from these results shows that the yield of gaseous products increases under fast heating rates at high temperatures and is comparatively very low in slow heating rates. At higher temperatures, the thermal fissure of primary tars that comes from fast-pyrolysis below 450–550 °C produces a huge amount of LAHC gases.88,103
Higher residence times have a tendency to lead to decomposition through secondary reactions of hydrocarbons in the pyrolysis-volatiles, which accumulate as LAHCs.4,113 Many studies revealed that catalytic heterogeneous reactions between the carbon-based materials and pyrolysis-volatiles led to the formation of H2 gas. In addition, heterogeneous reactions proceed very rapidly due to longer residence times and then transform parts of the aliphatic compounds into gaseous products like H2 and CO.113,114 Moreover, this rapid heterogeneous reaction rate is responsible for enhancing H2 and CO in pyrolysis-gases while the percentage formation of both CO2 and LAHCs falls at higher temperatures with a low N2 purge rate and feedstock rate.
Furthermore, higher percentages of H2 and CO are also achieved because char formation and accumulation within the reactor reflect the catalytic effect on these heterogeneous reactions, which leads to a lower generation of LAHCs.115 With the assistance of a higher heating rate, the yield of volatile products such as gases could be increased as a result of a decline in the amount of solid residues. In addition, within the temperature range 475–525 °C, the residence time of gas declines with increases in the heating rate.116 However, Barneto et al.117 showed that a slow heating rate produces more hydrogen than a rapid heating rate. Table 4 demonstrates the heating rate profiles of some raw materials in the evolution of HG and TG formation.
Raw material | MC (wt%) | Ash (wt%) | Heating rate (°C min−1) | T (°C) | HG yield (mol%) | TG yield (wt%) | Ref. |
---|---|---|---|---|---|---|---|
a “a” – moisture content (MC) expressed in terms of % basis. “b” – moisture and free basis. “c” – ash expressed in terms of % basis. “d” – moisture free basis. “e, f, g, and h” – yield of HG expressed in terms of vol%, Nm3 kg−1, wt% and Mgas/Mwood%, basis respectively. “i, j, k, l, and m” – yield of TG expressed in terms of percentage (%), ml g−1, wB%, Nm3 kg−1 and vol%, basis respectively. “nd” – corresponding values are not available in the original work. | |||||||
Pine chips | 7.40a | 0.35c | 7 | 550 | nd | 19.0i | 118 |
Rapeseed cake | nd | 4.56c | 7 | 500 | nd | 12.8i | 119 |
Hazelnut shell | 7 | 0.7 | 7 | 700 | nd | 63 | 120 |
Hazelnut bagasse | 9.97a | 6.56c | 10 | 500 | nd | 29.13 | 121 |
Safflower seed | 6a | 3 | 10 | 600 | nd | 25 | 122 |
Kraft lignin | nd | 0.15 | 15 | 800 | 66 | 736 | 123 |
Alcell lignin | nd | 2.3 | 15 | 800 | 46 | 762j | 123 |
Apricot stones | nd | 0.2 | 15 | 800 | 22.4e | 39.8i | 124 |
Leucaena | 4.5a | 3.7 | 20 | 900 | 12.2e | nd | 117 |
Tagasaste | 4.2a | 1.1 | 20 | 900 | 10.5e | nd | 117 |
Almond shell | 3.3a | 0.55c | 20 | 800 | 24.3e | 28 | 125 |
Straw-stalk of rape plant | nd | 5.23c | 30 | 650 | nd | 34.35i | 126 |
Corn cob | nd | nd | 30 | 600 | 7.5e | 42 | 125 |
Black cumin seed cake | 5.18 | 4.80 | 35 | 800 | nd | 34.8k | 127 |
Walnut shell | 7.71 | 0.94 | 40 | 550 | nd | 45.88 | 128 |
Legume straw | 9.80 | 1.62 | 40 | 800 | 28.2 | 80 | 16 |
Apricot stone | 8.52 | 0.17 | 40 | 800 | 17.8 | 71.3 | 16 |
Pine wood | 7 | 0.8 | 40 | 720 | 0.045 | 29.6 | 129 |
Wood chips | 7 | nd | 42 | 1000 | 0.24f | 0.75l | 35 |
Sewage sludge | 71 | 31.2 | 70 | 1000 | 43.3e | nd | 130 |
Pine wood | 7 | 0.8 | 80 | 720 | 0.085 | 30.2 | 129 |
Walnut shell | 7.5a | 1.3c | 100 | 700 | nd | 29.1i | 101 |
Erica arborea | nd | nd | 150 | 700 | nd | 35 | 131 |
Hazelnut shell | 8.7 | 1.3 | 180 | 750 | 60.2e | 44.6m | 50 |
Olive wood | 15.45b | 1.06d | 200 | 600 | nd | 35 | 132 |
Olive kernel | 21.50b | 3.90d | 200 | 600 | nd | 33 | 132 |
Rapeseed | 4.9a | 5.5c | 300 | 550 | nd | 8.0i | 133 |
Legume straw | 9.80 | 1.62 | 1000 | 850 | 50.6 | nd | 134 |
Pine sawdust | 5.01 | 0.34 | 1000 | 850 | 44.0 | nd | 134 |
Cotton gin waste | 6 | 13.3 | 6 × 10³ | 800 | 0.8g | 60 | 135 |
Wood | 10.7 | 0.4 | 6 × 10⁴ | 900 | 8h | nd | 136 |
It can be seen from Table 4 that legume straw produced 50.6 mol% HG with a heating rate of 1000 °C min−1 at a temperature of 850 °C while 28.2 mol% HG formed with a heating rate of 40 °C min−1 at 800 °C.16,134 Additionally, apricot stones produced 17.8 mol% HG with a heating rate of 40 °C min−1 and 22.4 vol% HG at a heating rate of 15 °C min−1.124 On the other hand, pine wood produced 0.045 and 0.085 mol% HG respectively when the heating rate was changed from 40 to 80 °C min−1 at a temperature of 720 °C.129
Heating rate shows a profound effect on cellulose decomposition in terms of hydrogen and carbon yields. As the heating rate increases, the yields of CH4, H2 and CO increase remarkably above 566.85–606.85 °C.137 Rapid heating (100 °C s−1) significantly increases secondary pyrolysis of cellulose tar to yield H2, CO and CH4 prior to escape from the reactor because of the high heating rate. Therefore, it is noted that rapid heating of cellulose increases gas production in terms of secondary pyrolysis of volatiles formed by primary pyrolysis (upon rapid heating, a steam reforming and a water gas shift reaction may also happen). On the other hand, slow heating (1 °C s−1) of cellulose pyrolysis, secondary pyrolysis of tar yielding H2 and CO in the gas phase which is negligible due to tar formed by cellulose decomposing at low temperature quickly escaped from the reactor prior to heating. Lignin reflects the opposite tendency in the effect of heating rate. Char is the major predominant product in the primary pyrolysis of lignin. The yield of H2 and CO2 gas significantly increases above 650 °C by means of steam gasification of lignin char. In comparison to the heating rate, the steam gasification rate of lignin char is much slower. This result indicates that secondary pyrolysis of tar produced by primary pyrolysis of lignin is insignificant. This implies the low reactivity of lignin tar.137
Wang et al.138 discussed the effect of different heating rates (5, 10, 15 and 20 °C min−1) from the pyrolysis of cellulose, hemicellulose and lignin using a thermogravimetric analyzer (TGA 92) under the flow of syngas and hydrogen. They pointed out that the heating rate could not only affect the temperature at which the highest weight loss rate reached, but also affect the maximum value of weight loss rate. The maximum value of weight loss rate decreases with increasing heating rate. The maximum weight loss rate of cellulose moves from 319 to 348 °C when the heating rate increases from 5 to 20 °C min−1. The effect of increasing heating rate on the maximum weight loss rate of the second stage pyrolysis is notable than that of the first pyrolysis stage. As for hemicellulose, the maximum weight loss rate moves from 273 to 302 °C when the heating rate varies from 5 to 20 °C min−1.
However, Kraft lignin and Alcell lignin generated 66 and 46 mol% HG, respectively, at the equivalent temperature of 800 °C with the same heating rate of 15 °C min−1, while almond shell produced 24.3 vol% HG with a heating rate of 20 °C min−1 as shown in Table 4. Additionally, the yield of TG volume was also increased from 642 mL g−1 lignin to 820 mL g−1 lignin for Alcell lignin, whereas for Kraft lignin it was 670–820 mL g−1 lignin. In contrast, hazelnut shell produced 44.6 vol% TGs with a heating rate of 180 °C min−1 at a temperature of 750 °C and 63 wt% TGs with a heating rate of 7 °C min−1 at a temperature of 700 °C.50,120 In addition, corncob and safflower seeds produced 42 and 25 wt% TGs with heating rates of 30 °C min−1 and 7 °C min−1, respectively, at a temperature of 600 °C.
Zuo et al.139 investigated whether the gaseous products (especially H2 and CH4) of the pyrolysis of fir wood increase when the heating rate is changed from 1 to 6 °C min−1. More simply, gaseous products such as HG and OG formation rise with a higher heating rate.140,141 Ayllón et al.142 reported that the final pyrolysis temperature plays a key role in the gas composition and distribution. They showed that if heating rates of 2 to 14 °C min−1 are applied in a fixed bed reactor (FBR) at a temperature of 300 to 900 °C during meat and bone meal pyrolysis then a higher rate of gas formation is observable.
Pyrolysis reactions are known as endothermic reactions, which is why they need a high heat flux. For this purpose, a rapid heat transfer rate could be essential for agitating the particles sufficiently as quickly as possible.68 To achieve this, heat fluxes of 50 W cm−2 would be required, but it is not mandatory or practicable for a commercial process.143 Giudicianni et al.144 investigated the degradation pattern at different temperatures during the thermal analysis of cellulose degradation. They pointed out that the primary degradation at above 450 °C would produce condensable volatiles and that these volatiles undergo further secondary decomposition. These secondary reactions are responsible for the release of CO, CH4, C2, and H2, but the flow rate might reach a maximum when the temperature range is 500 to 550 °C.
Aarsen et al.145 reported that the reaction rate may be controlled by the rate of heat transfer instead of by the kinetics of reactions and these are the results found at higher temperature. In accordance with this, Fernández et al.26 showed that higher temperature and longer gas residence times decreased tar production but increased char formation as a result of the extension of secondary reactions. However, Menéndez et al.27 found that the gaseous products increased due to higher heating rates, which favor the quick release of volatiles and modify the solid residue structure. Agreement between the researchers is that gas residence time and temperature should be higher, but that HR might still need to be investigated.
Raw material | Temperature (°C) | HG yield (%) | OG yield (%) | Ref. | ||||
---|---|---|---|---|---|---|---|---|
CO | CO2 | CH4 | C2H6 | C2H4 | ||||
a “a, b, c and d” – gas yield measured in the basis of Nm3 kg−1 biomass, mol%, % and mass% respectively while the rest of the gas values are in vol% basis. “nd” – corresponding values are not available in the original work. | ||||||||
Wood chips | 800 | 0.101 | 0.32 | 0.0624 | 0.107 | 0.0044 | 0.0379 | 35a |
950 | 0.19 | 0.33 | 0.059 | 0.110 | 0.0022 | 0.024 | ||
Pine chips | 500 | 51.69 | 34.07 | 8.63 | 4.45 | 0.07 | 1.0 | 148 |
590 | 52.82 | 33.68 | 8.53 | 3.80 | 0.04 | 0.9 | ||
MSW | 700 | 27.01 | 9.34 | 35.25 | 20.30 | 1.79 | 6.31 | 149b |
950 | 53.29 | 16.92 | 22.05 | 5.76 | 0.97 | 1.01 | ||
Palm oil waste | 800 | 53.40 | 20.35 | 20.90 | 4.10 | nd | nd | 79 |
850 | 56.96 | 17.14 | 22.14 | 2.50 | nd | nd | ||
Sewage sludge | 800 | 40.23 | 17.33 | 17.00 | 17.01 | nd | nd | 53b |
900 | 43.17 | 22.90 | 12.75 | 15.70 | nd | nd | ||
Sawdust | 630 | 49.43 | 15.98 | 6.73 | 18.72 | nd | nd | 150c |
740 | 58.26 | 13.46 | 14.30 | 9.67 | nd | nd | ||
Rapeseed residues | 480 | 30 | 43.32 | 11.50 | 12.63 | nd | nd | 151 |
790 | 45.86 | 42.22 | 1.42 | 10.45 | nd | nd | ||
Mallee wood | 450 | 0.00625 | 0.70 | 6.133 | 0.328 | 0.0482 | 0.06875 | 89d |
550 | 0.03035 | 2.50 | 8.141 | 0.816 | 0.1178 | 0.2428 | ||
Corncob | 500 | 1.82 | 38.21 | 51.69 | 4.08 | 0.69 | 0.12 | 48 |
700 | 12.37 | 36.78 | 31.22 | 12.27 | nd | nd | ||
Legume straw | 600 | 22.50 | 38 | 26.03 | 9.16 | 0.452 | 2.90 | 32b |
700 | 25.95 | 41.18 | 14.51 | 12.88 | 0.906 | 4.44 | ||
Tobacco stalk | 600 | 18.60 | 40.05 | 31.52 | 7.33 | 0.459 | 2.65 | 32b |
700 | 22.36 | 42.70 | 19.06 | 10.26 | 1.194 | 5.86 | ||
Pine sawdust | 500 | 0.82 | 53.22 | 32.72 | 9.91 | nd | nd | 152 |
600 | 9.25 | 54.71 | 18.67 | 11.40 | nd | nd | ||
Pine sawdust | 600 | 17.06 | 46.24 | 15.87 | 14.45 | nd | nd | 153 |
700 | 23.70 | 48.13 | 9.94 | 13.26 | nd | nd | ||
Pine sawdust | 700 | 21.48 | 42.89 | 20.57 | 9.12 | 0.37 | 4.44 | 81 |
900 | 39.40 | 33.42 | 19.36 | 6.10 | 0 | 0.96 | ||
Sawdust | 750 | 51.6 | 22.4 | 20.3 | 4.9 | 0.3 | 0.5 | 154 |
850 | 56.6 | 18.1 | 22.6 | 2.5 | 0.1 | 0.1 | ||
Sawdust | 860 | 9.27 | 9.25 | 13.28 | 4.21 | nd | nd | 155c |
890 | 9.73 | 5.52 | 12.47 | 2.45 | nd | nd | ||
Birch | 800 | 16.8 | 50.7 | 8.3 | 16.2 | 0.3 | 6.2 | 47 |
1000 | 34.0 | 45.7 | 7.5 | 11.7 | nd | 0.5 | ||
Corncob | 550 | 22.20 | 25 | 50.00 | 4.30 | 0.95 | 0.98 | 156b |
600 | 34.23 | 15 | 48.60 | 7.80 | 1.02 | 1.00 | ||
Sylvester and Spruce | 800 | 1.7 | 2.71 | 0.18 | 0.54 | nd | 0.106 | 157b |
1000 | 2.64 | 2.88 | 0.204 | 0.305 | nd | 0.036 | ||
Oat straw | 500 | 9.62 | 1.07 | 4.81 | 13.37 | nd | nd | 158b |
550 | 16.08 | 3.71 | 7.31 | 11.44 | nd | nd |
Qu et al.159 have demonstrated the fast pyrolysis of cellulose, hemicellulose (xylan), and lignin in a tube furnace using a temperature range between 350 and 650 °C and showed the temperature effect on pyrolysis product distributions. The major pyrolytic products of the three components are: CO2, CO, CH4, and some organics (a mixture of acids, aldehydes (CO), alkanes (C–C), and ethers (C–O–C), etc.) along with some H2O. With pyrolytic temperature, the CO2 enriched volume fraction of cellulose decreases. Evidently, at 500 °C, the volume fraction of CO enhances, reaches a maximum of 47% (which is maximum in comparison to hemicellulose and lignin pyrolysis) and then reduces with temperature. Above 550 °C, the volume fraction of hydrogen increases rapidly. Xylan contains the highest amount of CO2 volume fraction which substantially reduces from 60 to 40% over the pyrolytic temperature change between 500 and 550 °C. With temperature, approximately 30% CO volume fraction fluctuates. At below 500 °C, a small quantity of the H2 volume fraction is observable but in temperatures between 500 and 550 °C, the quantity of H2 increases remarkably, shows a maximum of 29% at 550 °C and thereafter, remains nearly constant with a temperature increase.
Shen et al.160 studied the effect of elevated temperature (400–690 °C) on the yields of CO, CO2, CH4 and H2 from hemicellulose pyrolysis using TG-FTIR and Py-GC-MS. They found that the yields of H2 and CH4 are much lower than CO and CO2 within this temperature range. The rapid gradual development of CO2 is attributed to the decarboxylation reaction of the large content of O-acetyl groups linked to the xylan chain normally on the C2 position. In addition, while the yield of CO2 only alters slightly, more CO is formed at an elevated temperature. It is a fact that the formation of CO is highly affected by the decomposition of the ring-opened intermediate, the secondary reactions of the low molecular weight products (especially decarbonylation of the aldehyde-type compounds); CO2 is presumably produced in the primary reactions.
Clearly, the thermolytic decomposition of lignin breaks the weak bonds at lower temperatures whereas the cleavage of stronger bonds takes place at higher temperatures. Structurally, lignin contains a high amount of aromatic ring and O–CH3 functional groups and H2 is released from the cracking and rearrangement of aromatic bonds of CC and C–H at higher temperature (>500 °C) whereas the relatively weak bond of the methoxyl group (–O–CH3) produces CH4. Apart from lignin decomposition, the high carbonyl content gives a high CO yield from cellulose decomposition whereas the high carboxyl content produces a significant amount of CO2 yield from hemicellulose decomposition.31 Qu et al.159 also pointed out that the yield of gas from cellulose pyrolysis enhances remarkably with temperature and shows a maximum when the temperature exceeds 560 °C, while xylan pyrolysis yields the highest quantity of gas below this temperature. In comparison to xylan and cellulose pyrolysis, lignin is subjected to produce a lower amount of gas species in the whole temperature range. This may be attributed to the release of volatile matter and secondary decomposition of bio-oil.
Nunn et al.161 have demonstrated the rapid pyrolysis of milled wood lignin in a captive sample electrical screen heater under 5 psig of helium at heating rate of 1000 °C s−1 in the temperature range 327–1127 °C. With temperature, the conversion increased noticeably to an asymptote of 86 wt% at 777 °C. Tar was the major pyrolysis product at temperatures above 527 °C. Its yield was at a maximum of 53 wt% at 627 °C and declined to 47 wt% at 877 °C. The main gaseous products were CO, CO, CH4, and C2+ hydrocarbons. Above 577 °C, CO dominated in the product gas and reached a yield of 19 wt% at 1127 °C. Sada et al.162 discussed the production of H2, CO, CO, hydrocarbons and phenolic compounds from pyrolysis of Kraft and Solvolysis lignin over the temperature range 500–800 °C at atmospheric pressure.
Caballero et al.163 reported the primary pyrolysis of Kraft lignin in a pyroprobe 1000 apparatus over a temperature range of 450–900 °C at a heating rate of 20 °C min−1 for different pyrolysis times (1–30 s). The product compositions were CO, CO2, H2O, hydrocarbons, benzene, methanol, acetaldehyde, acetic acid, formaldehyde and acetylene under experimental conditions. They believed that the decomposition of lignin took place below 600 °C and with temperature, the tar yield was decreased. The yield of hydrocarbon products increased in the range between 500 and 600 °C. However, at higher temperatures; 750–800 °C, the yields increased more slowly or remained constant. The CO yield showed a large increase up to a temperature of 550 °C, beyond which it remained nearly constant. Based on the analysis of main gaseous and volatile products the authors developed a mathematical model accounting for heat transfer limitations in the heating and cooling stages, correlated the specific rate of decomposition of lignin with reaction temperature and calculated the heat of reaction as 116 kJ kg−1 lignin.
Wang et al.164 investigated the pyrolysis characteristics of cellulose, hemicellulose and lignin within 350–500 °C using TG-FTIR and pyrolyzer. They reported that the pyrolysis of lignin yielded more CH4 and CO, which are indicative of secondary cracking. However, the TGs generated by pyrolysis of the components enhanced in the order: cellulose < lignin < hemicellulose, which differs from the order determined from the TG analyses of lignin < cellulose < hemicellulose at maximal release rates. It is explained as: the TG-FTIR analysis results were obtained at the maximum release rates and did not include the secondary cracking reactions.
However, the formation of pyrolysis gases is enhanced due to cracking of hydrocarbons into smaller fragments at higher PTs. At higher PTs, the secondary cracking rate is so high that char formation increases as well as TG formation.165 In this case, gaseous products like H2, CO, CO2 CH4, H2O, and light species are formed by gasification in the temperature range 800–850 °C.166 At lower PTs (450–550 °C), the secondary cracking rate is so low that CO and CO2 formation along with a small fraction of CH4 can be found as the main gases from primary decomposition. At these low PTs, the predictive HG yield can be achieved with a small fraction from primary pyrolysis (Fig. 4). However, pyrolytic gases such as CO2, CO, CH4, C2H6, and C2H4 are produced in different proportions depending on the PT.167,168
![]() | ||
Fig. 4 Hydrogen yield versus temperature profile. Adapted from Neves et al.64 |
Demirbas169 argued that if the PT was increased, then the yield of HG would increase as the percentage of TGs evolved. Secondary cracking of pyrolysis vapors at higher PTs causes greater production of TG products.170 The yield of gaseous products as well as the degree of secondary cracking depends on the time–temperature functions. Although thermal cracking in secondary reactions resulted in more HG products, this could be achieved by increasing either the temperature or the gas-phase residence times.171 Roughly, estimation shows that CO shares about one third of TG, whereas two thirds of TG (mass fractions of total permanent gas) stands for CO2 below 450 °C. Notwithstanding, PT has a viable effect on the production of CO, HG, and LAHCs above 450–550 °C. About 2 to 15% (mass% of daf fuel) of CO yield can be increased at 450–550 °C that successively increased up to 30 to 55% at high temperature (>850 °C). This may be attributed that at higher PTs, there was more liquid cracking, resulting in a higher yield of CO products and lower yield of tar and/or char during biomass pyrolysis.46 In addition, this is indicative that secondary reactions of tars may produce mainly CO gas. On the other hand, the yield of LAHCs such as CH4, C2H4, C2H6, etc., may increase from 1 to above 10% at 450–550 °C to higher PT (>850 °C) and these compounds mainly come from the remaining tar conversion.88 A possible reason could be that approximately 20% of the tar may proceed for LAHCs formation during the gas-phase cracking of wood pyrolysis tars while 65% of the tar stands for CO formation.
The maxima of the overwhelming majority of the output of TG are related to the final temperature of the process. If PT is increased then it is possible to break the chemical bonds of heavy tars that lead to the formation of LAHCs, as stated by Phuphuakrat et al.172 Ioannidou et al.48 noted that higher yields of gas are mostly found above 500 °C, and showed that 63% gas was obtained from corn cob at 730 °C and 55% gas was obtained from corn stalk at 630 °C. Another researcher observed that the secondary cracking of volatiles occurred above 500 °C and the cracking led to higher production of HG and CO compounds.39 At 450–550 °C, the HG yield can be found less than 0.2%, whereas it increases greater than 1% at PT higher than 850 °C as shown in Fig. 4. Additionally, this phenomenon is also caused from the secondary reactions of tars. It should be noted that above 500 °C, the activity of secondary reactions increases and thus, the yield of HG and CO increases. It is meant to suggest that these gases can be emerged as an indicator in the conversion of tars.173 Moreover, the effect of PT on the yield of CO2 emphasizes that the secondary conversion of volatiles produces a very small volume of CO2 between 450 and 550 °C to 800 °C. It is meant to prove that PT has a limited effect on the yield of CO2.
In addition, the formation of TGs increased from 18.2 to 23.5 wt% when the nitrogen flow rate increased from 50–200 cm3 min−1 at 500 °C with a heating rate of 50 °C min−1 during the pyrolytic conversion of safflower.122 Moreover, the N2 purge rate not only reduced the partial pressure of the volatiles but could also lessen the condensation of the pyrolysis volatiles into pyrolysis oil since a large amount of the N2 stream was present in the vapor phase. Such results cause an extremely high heat within the reactor, which leads to secondary decomposition of the primary pyrolysis products and promotes the formation of TG products.114 However, Putun et al.176 found that the formation of TGs was higher in a nitrogen atmosphere compared to a steam atmosphere during the pyrolysis of Euphorbia rigida biomass at 550 °C with a heating rate of 7 °C min−1 in a well swept FBR. But when the purpose is to maximize the production of TGs, then secondary reactions such as thermal cracking, re-polymerization, and re-condensation should be maximized because the IG removes the volatiles from the pyrolysis environment.177
Pindoria et al.175 pointed out that the pyrolytic conversion of eucalyptus wood under He, CO2, H2, and steam atmospheres at pressures between 1 and 20 bar with a heating rate of 10 °C s−1 in an FBR would give different proportions of volatiles such as 88–94%, 87–90.1%, and 85–88% for hydrogen, CO2, and He atmospheres, respectively. Likewise, Panigrahi et al.178 reported that an atmosphere comprising a mixture of steam and nitrogen would significantly increase gas production. They also noted that hydrogen, CO, and TG formation increased from 47 to 49 mol%, 26.6 to 30.2 mol%, and 67 to 81 wt%, respectively, during biomass-derived oil pyrolysis at a temperature of 800 °C. On the other hand, the yield of methane and other hydrocarbons decreased with steam flow rate due to the further reaction of methane via steam reformation and partial oxidation reactions.
Lv et al.81 pointed out that the formation of the HG and CO increased from 31.84 to 32.10 mol% and 34.19 to 37.73 mol% respectively when the steam flow rate changed from 0.27 to 1.2 kg h−1 during the pyrolytic conversion of pine sawdust at a temperature of 800 °C. However, Panigrahi et al.179 reported that HG formation increased from 13 to 21.5 mol% with an increase in the nitrogen flow rate from 18 to 54 mL min−1 during pyrolytic conversion of biomass-derived oil at 650–800 °C. The TG formation increased from 900 to 1780 mL, while CH4 was higher (30 mol%) at a low nitrogen flow rate of 800 °C. The formation of CO increased with nitrogen flow rate but the effect on the OGs was negligible.
Sensoz et al.118 predicted that if the nitrogen flow rate increased from 50 to 300 cm3 min−1 at 500 °C with a heating rate of 40 °C min−1 during pyrolysis of pine chips the TGs would increase from 12.3 to 16.7%. On the other hand, Gercel et al.36 stated that the formation of TGs increased from 23.8 to 38.8 wt% during pyrolysis of apricot stones at a nitrogen flow rate of 25 mL min−1 in the temperature range 400–700 °C with a heating rate of 300 °C min−1. However, Sensoz et al.87 stated that longer residence times at high PTs favor secondary pyrolysis reactions, resulting in higher production of TGs with nitrogen flow as the purge gas. As is expected to produce more HG and OG products during pyrolysis, the residence times of volatiles in the reactor increased as the sweep gas velocity decreased, and hence the formation of secondary reactions increased.180
To design a pyrolysis reactor, it is of crucial importance to know the characteristics of each biomass particles inside the reactor. Essential features such as particle residence time, conversion time (reaction rate), spatial distribution and so on, are the key parameters that are required to fulfil this target.181 These features are controlled by feedstock grades and degrees, as well as by governing reactor conditions (e.g., the external heat transfer co-efficient). The final product composition and properties are significantly influenced by the presence of pyrolysis severity.
For the sake of simplicity, here we outline the fast pyrolysis of biomass in a fluidized bed due to its capability to convert the biomass into diverse energy outcomes depositions. The last statement is meant to explain the pyrolysis severity for ultimate product distributions using a fluidized bed system. High heat transfer rate and spatial isotherm external conditions are crucial parameters in the fluidized bed reactor. Uddin et al.182 reported that hydrogen production from biomass pyrolysis using fluidized bed reactors would be attained at a higher production rate because of its higher heating rates. However, these parameters are not only observed in the fluidized bed reactor but also in a circulating fluidized bed, cyclone reactor, rotating reactor, and transported bed reactor. Apart from these reactors, ablative reactors, screw reactors and fixed bed reactors are of different natures.183
It could therefore be better to designate that fast pyrolysis in a fluidized bed reactor as a high-temperature reactor or indirect gasifier due to the pyrolysis process happens in the absence of oxidant.184 Devolatilization of the feedstock is the primary reaction of indirect gasification that forms permanent gases, condensable vapors and char. Secondary gas-phase reactions such as the water–gas shift reaction may affect the ultimate gas composition as well as properties but this phenomenon is strongly dependent on vapor residence time and reaction medium. A heat transfer media or heat transfer surfaces may be routes for transferring the heat into the reactor in fast pyrolysis process. A typical temperature range from 600 to 1500 °C may be used in fast pyrolysis, but transferring high-temperature heat into the reactor may create numerous difficulties during the experiment and this is why most systems operate the process with temperatures ranging from 600–850 °C. A lower amount of nitrogen and CO2 can be produced from fast pyrolysis due to the heating mechanism absence of oxidant and this figure can be comparable with air- or oxygen-blown gasifiers because they produce much higher nitrogen and CO2. In addition, the higher heating value of gas number of 18–20 MJ Nm−3 can be achieved due to product gas not being diluted with nitrogen or CO2. The gas composition (HG, OG, and TG) for a number of processes that use diverse biomass feedstocks, temperature, heating rate, and reactor are shown in Table 6.
Reactor name | Reactor configurations | Heating source | Biomass feed | Operating conditions | HG yield (vol %) | OG yield (vol %) | TG yield (vol %) | Ref. |
---|---|---|---|---|---|---|---|---|
a “EFR, DTR, FBR, PBR, VR, FR, TR, FFR, SBR, and BSQR” – represent entrained flow reactor, drop tube reactor, fixed bed reactor, packed bed reactor, vacuum reactor, fluidized reactor, tubular reactor, free-fall reactor, spouted bed reactor, and bell shaped quartz reactor respectively. “a, b, c and d” – references measured the gas yield in the basis of mol%, wt%, percentage (%) and g H2 per kg biomass respectively. “EF, T, P, HR, PS, RT, and IGFR” – represents electrical heater, temperature, pressure, heating rate, particle size, residence time and inert gas flow rate respectively. “nd” – corresponding values are not available in the original work. | ||||||||
EFR | Made up of alumina tube | EF | Sylvester pine wood | T: 1073–1273 °C | 20 | CO: 40; CO2: 5; CH4: 10; C2H4: 5 | 70 | 157a |
HR: 500 °C s−1 | ||||||||
Spruce wood | PS: 0.4–1.1 mm | |||||||
RT: 0.7–3.5 | ||||||||
DTR | Made up of alumina tube, height 2.3 m, inner diameter 0.075 m | EF | Commercial beech | T: 1600 °C | 2.5 | CO: 4; CO2: 12; CH4: 6; C2H6: 1; C2H4: 1.5 | nd | 24b |
P: 1 atm | ||||||||
FBR | nd | nd | Pine wood | T: 520 °C | 2.3 | CO: 28.6; CO2: 56.8; CH4: 10.1 | 46 | 186 |
HR: 5 °C min−1 | ||||||||
PBR | Made up of stainless steel, diameter 125 mm, height 500 mm | EF | Waste wood | T: 1600 °C | 7 | CO: 30.5; CO2: 44.7; CH4: 14.7 | 41.3 | 187c |
HR: 10 °C min−1 | ||||||||
VR | Cylindrical horizontal, height 3 m long, 0.6 m diameter. | EF | Sugarcane bagasse | HR: 12 °C min−1 | 1.1–2.4 | CO: 28.6–31.8; CO2: 48.2–56; CH4: 2.2–6.7; C2H6: 0.6–0.9; C2H4: 0.3–0.6 | 22 | 188 |
P: 8 Kpa | ||||||||
FR | Made up of 316 stainless steel, height 915 mm, bed diameter 30 mm | EF | Corn cob | T: 923 °C | 37 | CO: 2–3; CO2: 48; CH4: 8; C2H6: 2; C2H4: 2 | nd | 189 |
P: 30 Mpa | ||||||||
FBR | Made up of stainless steel, height 800 mm, inner diameter 20 mm | EF | Sawdust | T: 850 °C | 81.1 | nd | nd | 190c |
P: 1 atm | ||||||||
FR | Made up of 1Cr18Ni9Ti stainless steel pipe, height 1400 mm, bed diameter 40 mm, freeboard diameter 60 mm | EF | Pine sawdust | T: 900 °C | 71 | CO: 40; CO2: 20; CH4: 8; C2H6: 0.15; C2H4: 3 | nd | 81d |
P: 1 bar | ||||||||
FBR | nd | EF | Wheat straw | T: 450 °C | 14 | CO: 5–7; CO2: 15–20; CH4: 12 | 22 | 191 |
IGFR: 0.75–1.79 m3 h−1 | ||||||||
EFR | Made up of straight tube, height 60 cm or 120 cm | EF | Wheat straw | T: 900 °C | 20 | CO: 52; CO2: 8; CH4: 11; C2H6: 2; C2H4: 5 | 91 | 192 |
RT: 150–250 ms | ||||||||
FFR | nd | EF | Legume straw | T: 800 °C | 28.2 | CO: 38.5; CO2: 15; CH4: 18; C2H6: 5; C2H4: 8 | nd | 16a |
PS: 0.45–0.90 mm | ||||||||
FR | Made up by 1Cr18Ni9Ti stainless steel, height 1200 mm outer diameter 100 mm | Sandy particle | Saw dust | T: 750–860 °C | 9.27 | CO: 9.25; CH4: 4.21; C2H6: 0.25; C2H4: 0.65 | nd | 193 |
P: 1 atm | ||||||||
TR | Made up of stainless steel cylinder, height 0.75 m, inner diameter 2.2 × 10⁻² m | EF | Kraft lignin | T: 800 °C | 50 | CO: 33–44; CO2: 12–2; CH4 + C2H6 + C2H4: 1–6 | nd | 171a |
Organocell lignin | ||||||||
FBR | Made up of 316-stainless steel tube, height 63 cm3 | EF | Rapeseed residues | T: 480–790 °C | 28.77 | CO: 44.1; CO2: 10; CH4: 10 | nd | 151 |
HR: 48 °C s−1 | ||||||||
P: 1 atm | ||||||||
SBR | Made up of stainless steel, inner diameter 50 mm | EF | Ethylene glycol | T: 850 °C | 80 | nd | nd | 194 |
P: 1 bar | ||||||||
PS: 250–355 μm | ||||||||
BSQR | Filled with 1 kg of particulate carbon, the reactor has an agitation system that consists of an impeller with two 45° pitched blades, a 11-mm-diameter stainless steel shaft, and a motor operating at 6 rpm | EF | Shell 10W/40 highly refined base oil | T: 250–700 °C | 19 | CH4 + C2H6 + C2H4: 86 | nd | 4 |
IGFR: 0.1–0.075 L min−1 | ||||||||
FBR | Made up of high-temperature stainless steel, height of the reactor 71.2 cm, inner diameter 12.52 mm | EF | Bio-oil | T: above 600 °C | 90 | nd | nd | 195c |
P: 1 bar | ||||||||
FBR | Made up of stainless steel tube, inner diameter 1.65 cm, height: 42.6 cm | EF | Bio-oil | T: 800 °C | 85 | nd | nd | 196c |
FBR | Made up of 316 l stainless steel tube, outer diameter 12.7 mm | EF | Sunflower oil | T: 800 °C | 72.87 | CO: 18.1; CO2: 10.7; CH4: 13.4; C2H6: 3.2; C2H4: 39.1 | nd | 197c |
The pyrolysis reactor was classified depending on the feedstock and heating mode so that the thermo-chemical conversion of biomass into a desired maximum amount of HG and OGs was easily achieved. It can be observed from Table 6 that the ultimate product of biomass conversion is exclusively dependent on the reactor design and operating conditions.185 Although numerous techniques have been applied for biomass conversion, each of the conversion tools uses a different kind of reactor. The outcome from the reactors is having a significant calorific value rather than feedstock but it depends on the applications. It can be seen that if the temperature is above 600 °C, the H2 and OGs are enhanced due to degradation and decomposition of the pyrolytic vapors. Therefore, to maximize these products, the reactor could be used in such a way that heat-transfer mechanisms within the reactor favor higher residence times.
A number of investigations describe the intrinsic kinetics of primary and secondary decomposition reactions and product distribution.198,199 The most important issue in the study of pyrolysis kinetics is the resistance of heat transport limitations. Kersten et al.200 reviewed the pyrolysis kinetics including selectivity to products from woody biomass at 280–650 °C using different reactors such as a thermogravimetric analyzer (TGA), drop tube reactor, tube furnace and so on. They showed that the measurement of pyrolysis kinetics was affected by the system used, biomass type and by the tested interpretation models. They also pointed out that the reaction rate and product distributions with respect to kinetic expressions have varied a lot because the experimental data differ a lot from one raw material to another (Fig. 5–8). This is because the woody plant species (pine wood and beech wood) have tightly bound fibers and are richer in lignin that produces a higher gas yield than oak sawdust which has more loosely bound fibers, a fact that indicates lower lignin content, produces a lower gas yield as well.
![]() | ||
Fig. 5 Plot of gas yield versus reactor temperature. Adapted from Kersten et al.200 |
![]() | ||
Fig. 6 Plot of liquid yield versus reactor temperature. Adapted from Kersten et al.200 |
![]() | ||
Fig. 7 Plot of char yield versus reactor temperature. Adapted from Kersten et al.200 |
![]() | ||
Fig. 8 Plot of conversion time versus reactor temperature. Adapted from Kersten et al.200 |
Fig. 5–8 show the plot of reactor temperature versus yields and conversion time. Principally, if the heat transfer to and inside the particle is much faster than chemical kinetics; then the pyrolysis process is controlled by intrinsic kinetics. Assuming that at the reactor temperature, the chemical reactions take place inside the particle due to zero or very low enthalpy of reaction with respect to the heat required to heat the biomass fuel. The reactor temperature is always higher than the reaction temperature and this feature is necessary to precede a significant endothermic reaction enthalpy. Kinetics parameters in Fig. 5–8 were determined by assuming that the decomposition of wood occurs through a single process, involving three parallel first order decay reactions to attain classical products such as permanent gas, liquids (bio-oil, tar) and char. It can be inferred from Fig. 5–8 that the predicted kinetic parameters had shown much fluctuation between the data sets and displayed a non-uniform nature.
Great efforts have been made by previous researchers to describe the thermolytic decomposition of a biomass single particle.201–203 It is meant to study the details of moisture evaporation, chemical kinetics, and heat transport phenomena (conduction, convection and radiation) to and inside the particle, particle shrinkage and convective mass transfer within the particle. However, the direct application of such types of effort is not easy with respect to reactor design. A possible explanation may be the limitation to predict the product distributions and the reaction rates with respect to the operating conditions prevailing in practical pyrolysis reactors. Apart from defining the product, distribution and reaction rates, a detailed description of the intraparticle phenomenon can highlight the true difficulties in application of these mechanisms. An Arrhenius-type equation can be used to describe the evaporation of moisture in single particle models.204–206 One-dimensional pyrolysis models were derived to recognize the rate-controlling steps of wood pyrolysis by Pyle and Zaror.207 The simplification of this model suggested some guidelines to models for external heat transfer controlled (uniform particle temperature); internal heat transfer controlled and kinetically controlled pyrolysis. This model also suggested whether reaction or heat transfer is the faster mechanism.
Antal208 studied the yields of light, permanent gases evolved by the gas-phase pyrolysis of cellulose- and lignin-derived volatile matter and represented these yields as a function of temperature and gas phase residence time. He also showed these yield as a function of kinetic severity function (KSF) that usually used to quantify reactor severity. Findings from that experiment showed that KSF couldn't alone be able to predict the permanent gases like CO, CO2, CH4 and other light gases rather these yields significantly influence by temperature. The yield of gas is dependent on residence time and temperature may be described in terms of a global mechanism. This mechanism consists of two competitive reactions that quickly seize reactive volatile matter derived from solid-phase pyrolysis reactions. The yield of permanent gases by cracking of volatile matter proceeds through the first reaction, whereas the second reaction forms a refractory condensable material, which may be a tar or some combination of water soluble organic compounds.
The influence of vapor residence time on the product distribution is comparatively well known although the interaction of temperature and residence time is less understood. Boroson et al.19 showed that the residence time and temperature as well as the degree of the secondary reaction increased with decreasing average molecular weight when the temperature was under 400 °C. Scott et al.116 investigated the influence of vapor residence time (VRT) at 525 °C in a fluidized bed reactor in the range 0.2–0.9 s. The yield of liquid can be decreased from 75 to 60 wt% with respect to VRT. At extended VRT, lower yields of oil are imposed to fissuring and polymerization reactions of vapors and forms gases and solids, respectively. At 650–850 °C, the liquid yield was directed towards the reduction level due to the homogeneous cracking of the gas-phase for increasing the VRTs from 0.1 to 1 s.209 This trend remains steady for any longer VRTs. In addition, such types of trend may not be described by a single first-order decay reaction for tar cracking. In this respect, Antal’s208 mechanism can be an appropriate selection showing that gases and less reactive refractory tar can be formed from primary tar and these products decomposed very slowly or not.
The extent of cracking or fissuring is dependent on the amount of produced char in the reactor and this is why it is not a good idea to compare the vapor cracking rates because of temperature and residence time. Boroson et al.88 showed that in the presence of wood char at 400 °C controlled pyrolysis, a fraction of wood tar was found with significant reactivity. The effect of heating rate or heat flux cannot be explained as individual parameters in a practical pyrolysis reactor to predict the product distribution and properties due to the fact that they are dependent on local conditions of the reactor and non-stationary. A high heat transfer rate is the minimum requirement to heat particles adequately quickly to attain a high heat flux. As a result, high heating rate and endothermic pyrolysis reactions may be achieved to fulfil the major reactor design requirement.
Raw material | Catalyst type | Operating conditions | HG yield (vol%) | Ref. |
---|---|---|---|---|
a “C/W” – weight ratio of catalyst to biomass. “PS, WHSV and HR” – represents particle sizes, weight hourly space velocity and heating rate respectively. “a, b and c” – references measured the HG yield in and mol%, wt%, and μmol basis respectively. | ||||
Olive husk | ZnCl2 | T = 700 °C | 70.30 | 43 |
Cotton cocoon shell | ZnCl2 | T = 700 °C | 59.90 | 43 |
Tea waste | ZnCl2 | T = 700 °C | 60.30 | 43 |
Tea waste | Na2CO3 | T = 750 °C | 59.70 | 213 |
Olive husk | Na2CO3 | T = 750 °C | 62.90 | 43 |
Palm shell | Na2CO3 | T = 900 °C; C/W = 5 wt% | 16.93 | 44 |
Tea waste | K2CO3 | T = 750 °C | 48.50 | 213 |
Olive husk | K2CO3 | T = 750 °C | 62.90 | 43 |
Palm shell | K2CO3 | T = 900 °C; C/W = 5 wt% | 31.42 | 44 |
Palm shell | CaMg(CO3)2 | T = 900 °C; C/W = 5 wt% | 36.57 | 44 |
Palm shell | La/Al2O3 | T = 900 °C; C/W = 5 wt% | 38.45 | 44 |
Polyethylene | NiO/γ-Al2O3 | T = 750 °C; steam/polyethylene = 1.33; PS = 5 mm; NiO loading = 10 wt%; feed = 0.3 kg h−1; | 21.31 | 214a |
Palm shell | γ-Al2O3 | T = 900 °C; C/W = 5 wt% | 34.63 | 44 |
Rice straw | Al2O3 | T = 750 °C; PS = 0–4 mm | 45.60 | 38b |
Saw dust | Al2O3 | T = 750 °C; PS = 0–1 mm | 45.00 | 38a |
Palm shell | Fe2O3 | T = 900 °C; C/W = 5 wt% | 34.50 | 44 |
Rice straw | Cr2O3 | T = 750 °C; PS = 0–4 mm | 48.00 | 38b |
Saw dust | Cr2O3 | T = 750 °C; PS = 0–1 mm | 49.30 | 38b |
Rice straw | MnO | T = 750 °C; PS = 0–4 mm | 47.60 | 38b |
Saw dust | MnO | T = 750 °C; PS = 0–1 mm | 48.50 | 38b |
Rice straw | FeO | T = 750 °C; PS = 0–4 mm | 45.80 | 38b |
Saw dust | FeO | T = 750 °C; PS = 0–1 mm | 47.30 | 38b |
Paper-sludge | CaO | T = 600 °C; ER = 0.30 | 24.64 | 215 |
Disposal chopsticks | CaO | T = 600 °C; PS = 5 mm; feed = 0.8 kg min−1; ER = 0.30; | 14.57 | 216 |
Cedar wood | Dolomite | T = 700 °C; PS = 0.1–0.3 mm; ER = 0.28; feed = 150 mg min−1 | 1098 | 217c |
Almond shells | Dolomite | T = 770 °C; feed = 0.3 kg h−1; WHSV = 0.5 h−1; PS = 1100 μm; S/B = 1 | 55.50 | 45 |
Municipal solid waste | Dolomite | T = 750 °C; S/MSW = 0.77; WHSV = 1.29 h−1; HR = 10 °C min−1 | 34.70 | 149a |
Almond shells | Olivine | T = 770 °C; feed = 0.3 kg h−1; WHSV = 0.5 h−1; PS = 1100 μm; S/B = 1 | 52.20 | 45 |
Commercial wood | ZSM-5 zeolite | T = 550 °C; PS = 0.25–1 mm; ZSM-5 to steel ratio = 1![]() ![]() |
0.08 | 218b |
Palm shell | Ni | T = 900 °C; C/W = 5 wt% | 33.49 | 44 |
Cedar wood | Rh/CeO2/SiO2 (60) | T = 700 °C; PS = 0.1–0.3 mm; CeO2 loading = 60 wt%; ER = 0.28; feed = 150 mg min−1 | 3456 | 217c |
Cedar wood | G-91 | T = 700 °C; PS = 0.1–0.3 mm; ER = 0.28; feed = 150 mg min−1 | 3433 | 217c |
It is observed from Table 7 that the addition of different catalysts is responsible for the formation of different properties of HG from the same raw material at the same temperature. For example, if we considered only HG during the entire process, the catalytic effect of La/Al2O3 is higher than that of other catalysts when palm shells are pyrolyzed at 900 °C. However, in this case, Ni is found to have a strong catalytic effect since it improves the TG content.44 By using a Ni-based catalyst, hydrogen formation of up to 90% could be achieved.212 Anis et al.219 showed that when using a Ni-based catalyst, the space velocity has little effect on gas composition, but hydrogen production is enhanced when the temperature is increased and the tar content is reduced by more than 99%. A similar results is presented by Zhang.220 He had presented the effect of Ni-based catalysts on tar reduction and gas compositions using a guard bed and catalytic reactor and showed that more than 99% of destruction efficiency of tar can be found in presence of Ni-based catalysts. He also pointed out that as temperature increased, the yield of HG (6–11 vol% in dry basis) can be increased with the reduction of CH4 and C2H4 compounds. This is indicative that tar reduction in the presence of Ni-based catalysts was dominated by chemical kinetics. On the other hand, the yield of gaseous products can be accelerated with the assistance of Ni into Cu/Ni/γ-Al2O3 catalysts while the formation of acetic acid can be reduced during ethanol gasification as highlighted by Marino.221
The assistance of the nano-NiO/γ-Al2O3 catalyst may be explained in terms of CO and HG yield at 800 °C from catalytic pyrolysis. The volume of CO (42.2%) and HG (49.2%) in gas increased significantly and also increased with the temperature of the catalytic bed. In comparison to commercial catalysts, nano-NiO/γ-Al2O3 catalyst shows excellent efficiency in promoting the yield of H2 and CO in gas compositions along with lower CO2, even at low temperature. Li et al.79,154,222 have presented that the quality of produced gas from tar removal in biomass steam gasification is profoundly affected in the presence of nano-Ni–lanthanum (La)–Fe/γ-Al2O3 catalysts. They believed that a steady yield of HG can be found on addition of La and Fe to the nano-NiO/γ-Al2O3 catalyst under the same conditions compared with nano-NiO/γ-Al2O3, while the yield of total gas and CO, CO2, and LAHCs formation increased with a few fractions.154 Such results display that biomass can be converted into valuable gases significantly and thus, formed less coking in the presence of nano-Ni–La–Fe/γ-Al2O3 catalysts.
However, palm shells in the presence of Na2CO3 and K2CO3 catalysts at 900 °C yield 16.93 and 31.42 vol% H2 gas, respectively, while olive husks yield 62.90 and 62.90 vol% H2 gas, respectively, at 750 °C as shown in Table 7. This may be explained by the fact that the different ligno-cellulosic materials have different lignin and extractive properties. Olive husk in the presence of ZnCl2 produces more HG than cotton cocoon shell and tea waste at 700 °C. The highest yield of hydrogen-rich gas of nearly 70.3% was obtained from olive husk using about 13% ZnCl2 at 700 °C and the catalytic effect of Na2CO3 was stronger than that of K2CO3 for the cotton cocoon shell and tea-waste, but the effect of K2CO3 was very strong for olive husk.43 If the catalytic temperature increased, the hydrogen and hydrocarbons concentrations of the gases also increased.223 For example, rice husks at 550 °C yielded 25.4 wt% gases but by applying catalysts, a pattern of tremendous increases (22.2 wt% to 41 wt% gas) in gas formation could be observed from 400 to 600 °C.
The influence of Na2CO3 as an alkali on pyrolysis depends on the sample species and structural composition of the feedstock.42 From Table 7, it also observed that metal oxides could positively influence the formation of TG. Rice straw pyrolysis, for example, in the presence of a Cr2O3 catalyst, produces 48 wt% HG while 49.30 wt% HG is derived at 750 °C from sawdust. The assistance of MnO, FeO, and Al2O3 catalysts in sawdust pyrolysis is somewhat stronger than that for rice straw. This is because rice straw and sawdust originally contain mineral contents (K, Na), resulting in a positive effect but reducing the catalytic role of catalysts with an inverse effect on the pyrolytic process. Ni et al.212 found that Al2O3 and Cr2O3 appear to have a stronger catalytic role than other metal oxides.
In cedar wood pyrolysis, the effect of Rh/CeO2/SiO2 catalyst on HG generation is significant and beneficial compared to other conventional catalysts because 98% gaseous products are produced.224 Owing to the use of this catalyst, char formation was very low even at low temperatures, and it was also capable of increasing HG with temperature. Nevertheless, in this case, dolomite and G-91 catalysts have opposite trends. The effect of the mineral catalyst CaO depends on the use of a catalyst loading that favors hydrogen and TG formation. If the CaO catalyst loading increased from 10% to 20%, then TG yield and hydrogen formation also increased because the water–gas shift reactions are high between 600 and 700 °C. Thus, CO and CO2 formation decreased slightly but H2 generation increased as a whole. In addition, the CaO catalyst enhanced the reaction rate and thus improved the formation of HG as well as showing good energy yield within the temperature range of 650–700 °C.8
However, Xie et al.225 studied the effect of CaO and MgO on gas yield from steam gasification of biomass. They showed that the quality and the fractions of permanent gas (HG, CO, CO2 etc.) yield could be ameliorated by accelerating the gasification reaction of char and cracking reactions of tar and light hydrocarbons. Hu et al.226 reported the un-calcined and calcined dolomite catalysts during tar removal from steam gasification of apricot stone and showed that among all the catalysts tested, calcined dolomite is a more feasible and active catalyst for the production of HG content in TG. Gusta et al.227 demonstrated that tar decomposition into gaseous products improved by means of dolomites by an order of 21% magnitude compared with noncatalytic results at 750 °C. At 750 °C, the conversion of carbon into gaseous products increased to 97% using 3.2 cm3 dolomite per gram of biomass whereas 66% tar destruction was achieved using a Canadian dolomite along with 0.9 wt% Fe. This may be attributed to the water–gas shift reaction and tar conversion reactions, which can be promoted in the presence of iron content in dolomite. Natural olivine plays an excellent role on tar conversion and hence, increasing the gas quality by means of high hydrogen volume fraction as well as high syngas yield and less coke formation.228
Zeolite has a high surface area, excellent activity, shape selectivity for hydrocarbon, higher thermal stability, and an acidic site for enhancing the pyrolysis and/or gasification reaction of tar.216 Evidently, HZSM-5 zeolite catalysts could maximize the production of hydrocarbons by converting bio-oil and hence generate smaller amounts of acidic silica–alumina with non-acidic silicalite during the improvement of bio-oils in a fixed bed micro-reactor by fast pyrolysis with different catalysts.229 In agreement with this, Valle et al.230 reported that Ni/La2O3–α-Al2O3 catalyst is more efficient than Ni/α-Al2O3 catalyst for producing hydrogen gas (70%) during the improvement of bio-oils between 600 and 800 °C in a FBR.
This journal is © The Royal Society of Chemistry 2014 |