New organometallic ruthenium(II) complexes containing chelidonic acid (4-oxo-4H-pyran-2,6-dicarboxylic acid): synthesis, structure and in vitro biological activity

Thangavel Sathiya Kamatchi a, Palaniappan Kalaivani a, Paramasivan Poornima b, Viswanadha Vijaya Padma b, Frank R. Fronczek c and Karuppannan Natarajan *a
aDepartment of Chemistry, Bharathiar University, Coimbatore 641046, India. E-mail: k_natraj6@yahoo.com; Fax: +91 422 2422387; Tel: +91 422 2428319
bDepartment of Biotechnology, Bharathiar University, Coimbatore 641 046, India
cDepartment of Chemistry, Louisiana State University, Baton Rouge, LA 70803, USA

Received 24th July 2013 , Accepted 14th October 2013

First published on 15th October 2013


Abstract

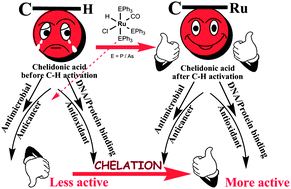
Two new bivalent organometallic ruthenium complexes [Ru(HL)(CH3CN)(CO)(PPh3)2] (3) and [Ru(HL)(CH3CN)(CO)(AsPh3)2] (4), (HL = 4-oxo-4H-pyran-2,6-dicarboxylic acid) were synthesized, structurally characterized and their biological activities (anti-microbial, DNA–protein interactions, antioxidant and cytotoxic activity studies (MTT, LDH release and NO release)) have been investigated and compared with that of appropriate precursor complexes [RuHCl(CO)(PPh3)3] (1), [RuHCl(CO)(AsPh3)3] (2) and the ligand H2L. The crystal structure of the complex 3 was solved by a single crystal X-ray diffraction technique, which revealed that it is a distorted octahedral with HL as a dibasic bidentate donor and the chelator was observed to undergo C–H activation at one of the ortho positions, leading to the formation of a five membered metallacycle. The in vitro antimicrobial activity was carried out using the well diffusion method against different species of pathogenic bacteria and fungi and complex 4 exhibited a better activity in inhibiting the growth of the tested organisms. DNA–protein interactions of the complexes have been examined by photophysical studies, which revealed that the complexes can bind with DNA through non-intercalation and the complexes strongly quench the intrinsic fluorescence of bovine serum albumin, through a static quenching process. The free radical scavenging ability, assessed by a series of in vitro antioxidant assays involving the DPPH radical, hydroxyl radical, nitric oxide radical, superoxide anion radical, hydrogen peroxide and a metal chelating assay showed that the new complexes 3 and 4 possess excellent radical scavenging properties over 1, 2, H2L, and the standard drugs, vitamin C and BHT. The in vitro cytotoxic activities of the compounds have been validated against A549 cells via an MTT assay, LDH release, NO release and the values were compared with that of the standard drug cisplatin. The results indicated that the new complexes, specifically the complex 3, displayed a higher cytotoxic activity in inhibiting the growth of A549 cells, outperforming by five fold, the standard drug cisplatin.

1. Introduction

Due to development of transition metal mediated reactions involving C–H bonds, the functionalization of traditionally inert carbon–hydrogen bonds represents one of the most powerful tools in organic synthesis.1 Intramolecular C–H activation reactions are one of the major discoveries of organometallic chemistry that provide access to metallacyclic derivatives of transition metal complexes2,3 and cyclometallation is one of the most commonly used methods in the activation of C–H bonds.4 Though nearly all transition metals have been successfully employed for cyclometallation, the use of palladium,5,6 ruthenium,7 rhodium,8 copper9 or iron10,11 complexes has set the stage for chemo-, site-,12 diastereo-,13,14 and/or enantioselective15 C–H bond functionalizations. Although palladium is, without any doubt, the transition metal that has been the most studied to promote the formation of metallacycles,16 ruthenium(II) derivatives could efficiently complement their widely used palladium(II) congeners.17 In particular, in the recent years, cycloruthenated compounds have emerged as an extraordinarily versatile family of molecules, exhibiting interesting applications in several fields. For example, their unique photophysical and electrochemical properties have been exploited in the design of sensitizers for solar cells18 or electron shuttles in redox-catalyzed processes.19 In addition, ruthenacycles have been found to display an appealing potential as antitumor agents20 and are among the most active catalysts reported to date for transfer hydrogenation reactions.21 Various examples have appeared recently in the literature dealing with the synthesis of ruthenacycles, implying the participation of a vast range of precursors and ligand settings.22 However, examples of cycloruthenated complexes from heterocyclic rings is still scarce.23 In this area, it would be interesting to synthesise ruthenium mediated cyclometallated complexes comprising dicarboxylic acids and hence, an attempt was made to study the reactions of chelidonic acid (H2L, 4-oxo-4H-pyran-2,6-dicarboxylic acid) with ruthenium(II) complexes. Chelidonic is one of the constituents of the greater celandine Chelidonium majus, which exhibits a wide range of therapeutic properties24 and its pKa value, of about 2.4, for both carboxyl groups makes it an effective coordinating agent at a physiological pH.25 The coordination chemistry of the chelidonate ion has been investigated with several metal ions26–31 in which the chelidonate ligand showed diverse coordination modes (Fig. 1, I to VII), which suggests great potential for the construction of new coordination complexes. However, to the best of our knowledge, its coordinative behaviour with ruthenium(II) complexes containing triphenylphosphine/triphenylarsine and the biological properties of new carboxylate complexes obtained have not been studied.
image file: c3ra43865a-f1.tif
Fig. 1 Observed and the new coordination mode of H2L found in the literature. I = κO2, II = κO3, III = κO3:κO4, IV = κ3O1, O4, O6, V = (μ) κO3:κO5, VI = (μ3) κO5, 2:3 κO4, VII = (μ4) O2:κO3:κO5:κO6, VIII = κ2 CO3.

With this background in mind, we attempted to synthesize new organometallic complexes by reacting [RuHCl(CO)(PPh3)3]/[RuHCl(CO)(AsPh3)3] with chelidonic acid monohydrate. As expected, we obtained new organometallic ruthenium(II) complexes, with a new type of coordination mode for chelidonic acid (Fig. 1, VIII). Herein, we report the synthesis, structure and assessment of its biological properties, such as antimicrobial and anticancer activity studies (DNA/protein binding, antioxidant and cytotoxic activities (MTT, LDH release and NO release)) of the new organometallic ruthenium(II) dicarboxylate complexes.

2. Results and discussion

2.1. Synthesis and characterization

Over recent years, research in medicinal organometallic chemistry has mainly focused on the preparation of organometallic compounds for anticancer and antimicrobial purposes. Although the organometallic pharmaceutical salvarsan was used for the treatment of syphilis in the early 20th century,32 only a very few organometallic compounds have reached the clinic in the meantime. Taking into account the urgent need for novel organometallic chemotherapeutics, the present contribution describes the synthesis of two new biologically active organometallic ruthenium complexes, comprising 4-oxo-4H-pyran-2,6-dicarboxylic acid. Straightforward reactions of H2L with [RuHCl(CO)(PPh3)3]/[RuHCl(CO)(AsPh3)3] gave new complexes of the type [Ru(HL)(CH3CN)(CO)(EPh3)2] (where E = P/As), as depicted in Scheme 1. The complexes are diamagnetic which corresponds to the bivalent state of ruthenium (low-spin d6, S = 0). The ligand was observed to undergo C–H activation at one of the ortho positions, leading to the formation of a five-membered metallacycle. The complexes were stable to air and light, non-hygroscopic in nature and were remarkably soluble in methanol, ethanol, chloroform, dichloromethane, DMF and DMSO. The synthesized complexes were then characterized by elemental analysis, IR, 1H and 13C NMR spectroscopic techniques. The complexes were analytically pure, as their microanalytical data conform to the proposed molecular formula. It has been observed that a molecule of 4-oxo-4H-pyran-2,6-dicarboxylic acid (H2L) replaced a hydride and chloride ions from the precursor complexes and acetonitrile, the solvent used for the reaction, replaced one of the triphenylphosphines/triphenylarsines and occupied one of the equatorial sites. The solid state structure of one of the complexes (3) was determined by single crystal X-ray crystallographic studies. It revealed that H2L behaved as a dibasic bidentate donor.
image file: c3ra43865a-s1.tif
Scheme 1 General scheme for the synthesis of new organometallic ruthenium complexes.

2.2. Spectroscopic studies

The spectroscopic data for the new complexes 3 and 4 looked very similar and hence, the spectroscopic data of complex 3 will be described in detail here. The IR spectrum of the free 4-oxo-4H-pyran-2,6-dicarboxylic acid (H2L) showed bands at 3575, 3476, 1790, 1730, 1644, 1587 and 1255 cm−1 corresponding to ν(COOH), ν(COOH)′, ν(C[double bond, length as m-dash]OOH), ν(C[double bond, length as m-dash]OOH)′, ν(C[double bond, length as m-dash]O)ring, ν(C[double bond, length as m-dash]C) and ν(C–O) respectively. In the spectra of 3, the band due to free COOH′ seems to be virtually unaltered, but slightly broadened at 3476 cm−1, indicating the non-participation of one of the carboxylic acid groups. The presence of a medium intensity band at 1600 cm−1 is attributable to the C[double bond, length as m-dash]O stretching vibrations of the free carboxylic acid group ν(C[double bond, length as m-dash]OOH)′. However, the complete disappearance of vibrational responses corresponding to ν(COOH) at 3575 cm−1 evidences the coordination of another carboxylic acid oxygen atom to a ruthenium ion after deprotonation. It is to be noted that the asymmetric carboxylate vibrations νas(CO2) are submerged in the range of 1617 cm−1, because the skeleton vibrations of the ν(C[double bond, length as m-dash]O)ring of the aromatic rings appear at the same range. The strong and sharp band at 1433 cm−1 can probably be assigned to the symmetric vibrational mode νsy(CO2) of the carboxylate group after coordination to the ruthenium ion. The difference between the asymmetric and symmetric stretches of the carboxylate group is 184 cm−1, which suggests a monodentate binding of the carboxylate group to the metal ion.33 The considerable decrement of the ν(C[double bond, length as m-dash]C) vibrational frequency in the complex drives us to think that another point of attachment of H2L to the ruthenium ion is one of the pyrone carbons. The strong absorption at 1952 cm−1 has been assigned to the terminally coordinated carbonyl group. The electronic spectrum of complex 3 presents absorption maxima at 229, 243, 265 and 370 nm. The absorption observed at 229, 243 and 266 nm is most likely due to a transition involving only ligand orbitals (π → π* and n → π*). The absorption at 370 nm is probably due to metal-to-ligand charge transfer transitions. These charge transfer transitions may be taking place from the highest filled ruthenium t2 orbital (highest occupied molecular orbital) to the vacant π* (–C[double bond, length as m-dash]C– or –C[double bond, length as m-dash]O–) orbital of H2L (lowest unoccupied molecular orbital) or to the higher energy vacant orbitals of another fragment of the ligand.

The NMR spectrum of the complex 3 contained one well resolved, broad singlet, two sharp singlets and one multiplet that were assigned as shown below (the numbering scheme can be found in Fig. 2). A one proton sharp singlet, at δ 11.29 ppm, in complex 3 is due to the hydroxyl proton of the carboxylic acid. Another one proton sharp singlet at δ 7.87 ppm, is due to the proton which is attached to carbon C4 of the pyrone ring. The resonance around δ 2.09 ppm is due to the methyl protons of the coordinated acetonitrile solvent. A multiplet at the δ 7.23–7.70 ppm range corresponds to the aromatic ring protons of the triphenylphosphine groups. The 13C-NMR spectrum of the complex 3 displayed 14 signals. A downfield sharp, medium intensity singlet at δ 204.42 ppm is assigned to the terminal carbonyl carbon, C8. The next downfield singlet at δ 196.57 ppm could be due to C2 and the very low field appearance of this is indicative of its coordination to ruthenium. A signal at δ 119.18 ppm is due to the nitrile carbon C9[triple bond, length as m-dash]N. C10 (aliphatic methyl), a shielded carbon of the coordinated acetonitrile resonated as a singlet at δ 13.62 ppm. The skeleton carbonyl carbon, C3, appeared as a singlet at δ 172.14 ppm. A singlet at δ 93.57 ppm is assigned to the C4 sp2 carbon. C5 (sp, low intensity band at δ 153.44 ppm) is around 60 ppm downfield compared to that of C4 (δ 93.57 ppm). This might be due to the attachment of the electron withdrawing COOH. C1 (sp) resonated as a singlet at δ 168.52 ppm. One singlet appearing at δ 163.38 is due to C7 of the free carboxylic acid group and the other at δ 181.91ppm is due to the other carboxylic acid group (C6), whose oxygen is bonded to ruthenium. Furthermore, four singlets appeared at δ 130.52, 131.91, 132.00 and 132.52 ppm, for the carbon atoms (a, b, c and d types) of the triphenylphosphine groups.


image file: c3ra43865a-f2.tif
Fig. 2 Numbering scheme for the representative complex 3.

2.3. X-ray crystal structure

The molecular structure of 3 has been determined by single crystal X-ray analysis. ORTEPs diagram with the atom labeling scheme, hydrogen bonding interaction and packing diagram of the unit cell of 3 are displayed in Fig. 3, S1 and S2 (ESI), respectively. A summary of the structure refinement is shown in Table 1. The selected geometrical parameters (interatomic distances and angles) and the hydrogen bond distances are given in the Table S1 (ESI). Single crystals of complex 3 were obtained as colorless needles from the slow evaporation of the reaction mixture for at least one week at room temperature. The crystal was a solvate, containing two acetonitriles and a water molecule. A crystal fragment of the approximate dimensions of 0.35 × 0.30 × 0.25, was used for the diffraction data collection at 100 K. The molecule lies on a crystallographic mirror plane. The crystal structure of 3 consists of a six-coordinated ruthenium ion with a C2N1O1P2 core, where the equatorial plane is constructed by a carbon and an oxygen atom of the bidentate ligand HL and a carbonyl carbon. The nitrogen atom of the acetonitrile (solvent used for the reaction) molecule completes the equatorial plane. As is commonly observed for hexa-coordinated complexes containing the {Ru(PPh3)2} unit, the two bulky PPh3 molecules are above and below the equatorial plane. The five membered chelate ring has a bite angle of 78.52(7)°. The +2 oxidation state of the complex is compensated by one of the carboxylate oxygens and a carbanion of the ligand HL. When ruthenium(II) is coordinated to two triphenylphosphine ligands, the relative disposition of them depends on the competition of steric and electronic (π-back bonding) factors. In our case, the former predominates and hence, the two phosphine groups are trans to each other. However, if the latter dominates, a cis structure is expected. As expected, the two trans Ru–P bond lengths are much longer than the four equatorial bond lengths, indicating a large axial distortion. This lengthening is due to the strong trans influence of the bulky triphenylphosphine ligands. The lengthening is evidenced by two central bond lengths Ru1–P(1) [2.3897(3) Å] and Ru1–P′ [2.3897(3) Å] that are longer when compared to that of the other four basal planar bonds Ru1–N(1) [2.119(2) Å], Ru1–C(2) [2.033(2) Å], Ru1–O(1) [2.143(2) Å], Ru1–C(8) [1.845(2) Å]. The trans angle of P(1)–Ru1–P′(1) [175.48(3)°] is not close to the ideal value of 180°, providing further evidence for the axial distortion. However, the other trans angles of the basal planes, namely C(2)–Ru1–N(1) [169.65(8)°] and O(1)–Ru1–C(8) [174.34(9)°], are constrained, indicating clearly that the coordination geometry around the ruthenium metal centre is distorted octahedral. The cis bond angles spread over the range from 78.52(7) to 95.83(10)°. The P(1)–Ru–P′(1) is the largest (175.48(2)), while C(2)–Ru–N(1) is the smallest (169.65(8)) trans angle. From the covalent radii values, the Ru(II)–C(2) (sp2) length is estimated to be 2.06 Å and the observed values span the range 1.96 to 2.16 Å.34 Furthermore, the Ru1–C(2) distance is 2.033 Å, which is very similar to that of the other structurally characterized cyclometallated ruthenium(II) complexes.35 The Ru1–C(8) bond distance (1.844(2) Å) is in accordance with those found in other ruthenium(II) complexes.35,36 The Ru–C(2) (sp2) bond is 0.189(3) Å, longer than the Ru1–C(8) (sp) distance due to Ru–CO back bonding. The carbonyl group occupies a site trans to the O(1). This may be a consequence of strong Ru(II) → CO back donation, as indicated by the short Ru–C bond (1.844(2) Å) and low CO IR stretching frequency (1952 cm−1) preferring σ or weak π donor groups occupying a site opposite to CO to favor the d–π* back donation. The two Ru–P bond lengths are identical by symmetry and are comparable to those reported for other ruthenium(II) complexes containing coordinated triphenylphosphine.37,38 Ru(1)–N(1) (nitrogen from coordinated acetonitrile solvent) bond length (2.119(2) Å) agrees well with those reported for similar ruthenium complexes having the same coordination sphere.35 The complex is stabilized by the intermolecular hydrogen bonding networks with neighboring molecules. Though one of the carboxylic acid groups O(5) (H-donor) does not take part in coordination, it is involved in intermolecular hydrogen bonding interactions with a neighboring carboxylate oxygen O(2) (H-acceptor) atom. A water molecule forms a hydrogen-bonded bridge, by serving as donor to both O(2) and O(4) of the same complex.
image file: c3ra43865a-f3.tif
Fig. 3 ORTEP diagram with atom numbering scheme for 3 as thermal ellipsoids at a 50% probability level. The hydrogen atoms (except one carboxylic acid proton) and the solvent molecules of crystallization have been omitted for clarity.
Table 1 Crystallographic data for complex 3
CCDC deposit number 900109
Empirical formula C46H35NO7P2Ru.2(C2H3N)·H2O
Formula weight 976.88
Temperature/K 100.0(5)
Crystal system Orthorhombic
Space group Cmc21
a 15.2613(3)
b−1 18.5194(4)
c 16.2330(3)
Volume/Å3 4587.75(16)
Z 4
ρ calc/mg mm−3 1.414
Absorption coefficient mm−1 0.469
F(000) 2008
Crystal size/mm3 0.35 × 0.30 × 0.25
2θ range for data collection 5.2–68.2°
Index range −22 ≤ h ≤ 22, −27 ≤ k ≤ 27, −25 ≤ l ≤ 25
Reflections collected 28[thin space (1/6-em)]264
Independent reflections 8448[R(int) = 0.041]
Data/restraints/parameters 8448/1/337
Goodness-of-fit on F2 1.024
Final R indexes [I ≥ 2σ(I)] R 1 = 0.0292, wR2 = 0.0692
Final R indexes [all data] R 1 = 0.0323, wR2 = 0.0712
Largest diff. peak/hole/e Å−3 0.82/−0.90


2.4. Antimicrobial activity

Infections due to different pathogenic bacteria and fungi are a dreadful threat to the human race and modern healthcare. Ruthenium based compounds exert an antimicrobial action against a range of Gram-negative, Gram-positive bacteria and fungi. A survey of the literature showed that ruthenium complexes containing dicarboxylic acids are relatively unstudied for their potential antimicrobial activity for exploitation in medicine and industry. Here in our study, an attempt was made to investigate the toxic effects of the ligand, ruthenium precursor complexes and their corresponding newly synthesized organometallic complexes on the antimicrobial activity against four different bacterial species and two fungal strains. As described in the materials and methods, different concentrations of the compounds were used to identify their minimum inhibitory concentration on two Gram-positive bacteria (Staphylococcus aureus, Enterococcus faecalis), two Gram-negative bacteria (Escherichia coli, Klebsiella pneumonia) and fungal strains (Aspergillus niger and Candida albicans) by an agar well diffusion method. The effectiveness of an antimicrobial agent in sensitivity testing is based on the size of the diameter zones of inhibition against Gram-positive, Gram-negative bacteria and fungal strains. The diameter of the zone is measured to the nearest millimetre and the data are given in Table 2 and the minimum inhibitory concentration is represented in Table 3.
Table 2 Antibacterial and antifungal activity of the ligand, precursors and new ruthenium complexes – zone of inhibition in mm
Compounds Gram-positive Gram-negative Fungi
S. aureus a E. faecalis b E. coli c K. pneumoniae d A. niger e C. albicans f
a Staphylococcus aureus. b Enterococcus faecalis. c Escherichia coli. d Klebsiella pneumonia. e Aspergillus niger. f Candida albicans “—” no activity.
H2L 10 09 07 10 4 3
1 12 11 10 11 5 5
2 16 14 12 15 6 7
3 18 24 14 17 10 8
4 22 29 17 18 14 10
Ciprofloxacin 28 30 29 32
Fluconazole 22 31
Control


Table 3 Minimum inhibitory concentration (MIC), μg mL−1
Compounds Gram-positive Gram-negative Fungi
S. aureus E. faecalis E. coli K. pneumoniae A. niger C. albicans
H2L 100 100 100 100 >100 >100
1 75 75 100 75 >100 >100
2 50 50 50 75 >100 >100
3 25 25 75 50 100 100
4 25 25 50 25 50 50
Ciprofloxacin 12.5 12.5 12.5 12.5
Fluconazole 12.5 12.5


Inhibition zones were measured and compared with the current antimicrobial drugs ciprofloxacin (antibacterial) and fluconazole (antifungal). A comparison of the antimicrobial activities of the free ligand, precursors and the new ruthenium complexes with standard antibiotics exhibit the following:

(a) The new organometallic ruthenium complexes are more toxic than their parent ligand and the precursor complexes against the same microorganisms under identical experimental conditions. However, they behaved as better antibacterial agents, rather than antifungal agents. The higher antibacterial activity of the new ruthenium complexes is due to the chelation of the metal ion, as has been explained by Tweedy's chelation theory.39

(b) Among the new complexes tested, complex 4 was found to have higher reactivity against the different strains of bacteria and fungi than complex 3.

(c) Complex 4 exhibited an almost equipotent activity in the zone of inhibition (29 mm) with the standard drug ciprofloxacin (30 mm) against Enterococcus faecalis and 3 and 4 exhibited good activity against all the other bacteria tested with the inhibition zone of 14–29 mm. Complex 3 (17 mm) and 4 (18 mm) exhibited comparable antibacterial activities toward the inhibition of growth of K. pneumoniae.

(d) The in vitro antifungal evaluation exhibited that the precursors and the ligand were almost inactive and complexes 3 and 4 showed only a moderate activity. The new complexes 3 and 4 were found to be less active against the yeast C. albicans, but moderate antifungal activity for both complexes was seen against the pathogenic mould A. niger.

(e) The antimicrobial activity results displayed by the new complexes are much better than that reported for other organometallic ruthenium(II) complexes.38

(f) In general, the deduced patterns of antimicrobial activity of the newly synthesized organometallic complexes are in the following order:

Complex 4 > complex 3 > [RuHCl(CO)(AsPh3)3] (2) > [RuHCl(CO)(PPh3)3] (1) > H2L

The arsenic containing precursor complex [RuHCl(CO)(AsPh3)3] (2) and the corresponding new complex [Ru(HL)(CH3CN)(CO)(AsPh3)2] (4) were found to be more active against the pathogens than the phosphine analogues. From this, it presumed that arsenic plays a major role in the antimicrobial activity.

2.5. Anticancer activity studies

2.5.1. DNA binding studies. For evaluating the antitumor property of any new compound, DNA binding is the predominant property looked for in pharmacology and hence, the interaction between DNA and metal complexes is of paramount importance in understanding the mechanism. Thus, the mode and propensity for binding of the ligand H2L, ruthenium(II) starting materials 1, 2 and their corresponding new ruthenium(II) complexes 3, 4 to HS DNA were studied with the aid of electronic absorption and luminescence quenching techniques.
2.5.1.1. Electronic absorption spectra. Electronic absorption spectroscopy is commonly used technique to determine the binding strength and binding mode of DNA with complexes.40 Hence, the ligand H2L, ruthenium(II) starting materials 1, 2 and their corresponding new ruthenium(II) complexes 3, 4 were subjected to DNA binding studies by taking HS DNA as a model DNA. In the UV-vis spectra of the ligand and complexes 1–4, absorption bands were observed at 230 and 270 nm. These are assigned to the predominant π–π* and n–π* transitions, respectively. The electronic spectra of the compounds are slightly different from each other only in their visible region. In order to study the binding of the test compounds with DNA, the change in the electronic spectrum was observed by titrating DNA with the test compounds. As the concentration of DNA was increased, the intensity of the absorption bands at 269, 267, 259, 265 and 262 corresponding to H2L and complexes 1–4 was affected, resulting in hyperchromicity, with a blue shift. The spectral changes of H2L and complexes 1–4 upon addition of DNA are shown in Fig. 4. The observed hyperchromic effect with a blue shift suggested that the new complexes bind to HS DNA by external contact, possibly due to electrostatic binding.41
image file: c3ra43865a-f4.tif
Fig. 4 Absorption titration spectra of fixed concentration (10 μM) of H2L and complexes 1–4 with increasing concentrations (0–50 μM) of HS DNA (Tris-HCl buffer, pH 7).

In order to compare quantitatively the binding strength of the compounds, the intrinsic binding constants, Kb, of the compounds with DNA were obtained by monitoring the changes in absorbance around 259–269 nm with increasing concentration of DNA, using the following eqn (1):

 
[DNA]/[εaεf] = [DNA]/[εbεf] + 1/Kb[εbεf](1)
wherein, [DNA] is the concentration of DNA in base pairs, εa, εf, and εb are the apparent, free and bound-metal–complex extinction coefficients, respectively. Kb is the equilibrium binding constant of the compound binding to DNA. Each set of data, when fitted to the above equation, gave a straight line with a slope of 1/(εbεf) and a y-intercept of 1/Kb(εbεf) and Kb was determined from the ratio of the slope to the intercept (Table 4 and Fig. 5).

Table 4 Binding constant for the interaction of compounds with HS DNA
System K b (M−1)
HS DNA + H2L 9.84 × 10⁴
HS DNA + 1 1.21 × 10⁴
HS DNA + 2 1.08 × 10⁴
HS DNA + 3 2.93 × 10⁵
HS DNA + 4 2.88 × 10⁵


image file: c3ra43865a-f5.tif
Fig. 5 Binding isotherms of the H2L and complexes 1–4 with HS DNA.

From the binding constant values (Table 4), it is inferred that there are intense interactions of complexes 3, 4 with DNA, which are stronger than that of H2L and their parent complexes 1 and 2.


2.5.1.2. Ethidium bromide displacement studies. Though electronic spectral studies indicated the binding of the compounds with DNA, it has to be confirmed by other methods and hence, steady-state competitive binding experiments using compounds H2L, 1, 2, 3 and 4 as quenchers were undertaken to obtain final proof for the mode of binding of the compounds to DNA. For that, ethidium bromide (EB) was used as a fluorescence probe. In general, the intrinsic fluorescence intensity of DNA is very low and that of EB in Tris-HCl buffer is also not high, due to quenching by the solvent molecules. However, on addition of DNA to EB, the fluorescence intensity of EB will be enhanced, because of its intercalation into the DNA. Thus, EB can be used to probe the interaction of compounds with DNA. The fluorescence intensity of EB can be quenched by the addition of another molecule, due to decreasing of the binding sites of DNA available for EB. In our experiment, the EB–DNA system exhibits a strong emission band at a wavelength around 620 nm. By adding the H2L and complexes 1–4, the fluorescence emission of the EB–DNA system was enhanced rather than quenched in the emission maximum, shown in Fig. S3 (ESI), indicating that they could not displace EB from the DNA–EB complex. This observation indicates that the compounds bind weakly to the DNA, probably by an electrostatic interaction.
2.5.2. BSA binding studies.
2.5.2.1. UV absorption spectra of BSA. Serum albumins are major transport proteins42 found in the blood plasma and are capable of binding, transporting and delivering an extraordinarily diverse range of endogenous and exogenous compounds like fatty acids, nutrients, steroids, certain metal ions, hormones and a variety of therapeutic drugs43−45 in the bloodstream to their target organs.46 Bovine serum albumin (BSA) has been one of the most extensively studied proteins, particularly because of its structural homology with human serum albumin (HSA). Binding to these proteins may lead to the loss or enhancement of the biological properties of the original drug, or provide paths for drug transportation. In order to investigate the binding of our compounds with BSA, the binding experiments were carried out using H2L and the complexes 1–4. In all the experiments, the concentration of the BSA was kept constant at 1 μM and the concentration of H2L and the complexes 1–4 was varied from 0–30 μM.

Fig. 6 shows the absorption spectra of BSA in the absence and presence of H2L and complexes 1–4. On adding H2L and complexes 1–4 to BSA, a progressive decrease in the absorbance of BSA was observed, except for the ligand and there was a small blue shift, of about 1, 3, 3, 1 and 3 nm for the ligand and complexes 1–4, respectively. The observed changes indicate a static quenching mechanism of BSA by H2L and the complexes (1–4), as the alternative dynamic quenching mechanism does not change the electronic absorption spectrum.47


image file: c3ra43865a-f6.tif
Fig. 6 UV absorption spectra of BSA (1 μM) in the absence and presence of H2L and complexes 1–4 (10 μM).

2.5.2.2. Fluorescence quenching studies of BSA. In order to obtain more information on the binding of the compounds with BSA, the fluorescence spectrum of BSA was studied upon the addition of the test compounds. Though BSA contains three fluorophores, namely, tryptophan, tyrosine and phenylalanine, the intrinsic fluorescence of BSA is mainly due to tryptophan alone, because phenyl alanine has a very low quantum yield and the fluorescence of tyrosine is almost totally quenched if it is ionized or near an amino group, a carbonyl group, or a tryptophan residue.48 Changes in the emission spectra of tryptophan are common in response to protein conformational transitions, subunit associations, substrate binding, or denaturation. Therefore, the intrinsic fluorescence of BSA can provide considerable information on the structure and dynamics and is often utilized in the study of protein folding and association reactions. Hence, the interaction of BSA with our compounds (H2L and 1–4) was studied by fluorescence measurement at room temperature and the binding constants of the compounds were calculated. In a typical experiment, a solution of BSA (1 μM) was titrated with various concentrations of the compounds (0–35 μM) and the fluorescence spectra were recorded in the range 290–500 nm, upon excitation at 280 nm. The changes observed on the fluorescence emission spectra of BSA on the addition of increasing amounts of H2L or ruthenium(II) complexes 1–4 are shown in Fig. 7. Addition to BSA produced a dramatic modification of the emission profile. The fluorescence of BSA was quenched effectively with a blue shift in the emission maximum of H2L, complexes 3, 4 and with a red shift in the starting complexes 1, 2 and this may be due to the binding of compounds with the active site in BSA.49
image file: c3ra43865a-f7.tif
Fig. 7 The emission spectra of BSA (1 μM; λexc = 280 nm; λemi = 346 nm) in the presence of increasing amounts of H2L and complexes 1–4 (0–35 μM). The arrow shows the emission intensity changes upon increasing complex concentration.

To study the quenching process further, fluorescence quenching data were analyzed with the Stern–Volmer equation (2) and Scatchard equation (3). The ratio of the fluorescence intensity in the absence of (I0) and in the presence of (I) the quencher, is related to the concentration of the quencher [Q] by a coefficient KSV.

 
I0/I = 1 + KSV[Q](2)

The KSV value obtained from the plot of I0/I vs. [Q] was found to be 1.06 × 10⁵ M−1, 1.39 × 10⁵ M−1, 5.10 × 10³ M−1, 2.49 × 10⁵ M−1 and 2.25 × 10⁵ M−1 corresponding to H2L and complexes 14, respectively. The observed linearity in the plots (Fig. 8 and Table 5) indicated the ability of the complexes to quench the emission intensity of BSA. From the KSV values, it is seen that the complexes 3 and 4 exhibited a strong protein-binding ability, with enhanced hydrophobicity compared to H2L and their corresponding starting materials.


image file: c3ra43865a-f8.tif
Fig. 8 Plot of I0/I vs. log[Q].
Table 5 Binding constant and number of binding sites for interaction of complexes with BSA
System K SV × M−1 K × M−1 n
BSA + H2L 1.06 × 10⁵ 1.22 × 105 1.03
BSA + 1 1.39 × 10⁵ 1.26 × 105 0.96
BSA + 2 5.10 × 10³ 1.00 × 105 0.59
BSA + 3 2.49 × 10⁵ 2.89 × 106 1.30
BSA + 4 2.25 × 10⁵ 3.88 × 105 1.05


For the static quenching, when molecules bind independently to a set of equivalent sites on a macromolecule, the binding constant (K) and the number of binding sites (n) can be determined by the Scatchard equation (3).

 
image file: c3ra43865a-t1.tif(3)
where K is the binding constant of the quencher with BSA, n is the number of binding sites, and F0 and F are the fluorescence intensity in the absence and presence of the quencher. The value of K can be determined from the slope of log[(F0F)/F] versus log[Q], as shown in Fig. 9. The calculated value of the binding constant (K) and the number of binding sites (n) are listed in Table 5. The values of n at room temperature are approximately equal to 1, except for complex 2, which indicates that there is just one single binding site in BSA for the H2L and complexes 1, 3 and 4.


image file: c3ra43865a-f9.tif
Fig. 9 Plot of log[(F0F)/F] vs. log[Q].

2.5.2.3. Synchronous fluorescence spectra. After having obtained the binding constant and binding number of the compounds with BSA, it is important to know about the conformational change of the protein molecular environment in the vicinity of the fluorophore functional groups.50 This can be obtained from synchronous fluorescence spectral studies and hence, the synchronous fluorescence spectra of BSA with the compounds were studied. The fluorescence of BSA is mainly due to the tryptophan and tyrosine residues. Among them, tryptophan lies in the active site of the protein. When the D value (Δλ) between the excitation and emission wavelength are stabilized at 60 nm, the synchronous fluorescence gives the characteristic information of the tryptophan residues.51 The variation in the tryptophan emission is the consequence of the protein conformational changes. Therefore, to explore the structural change of BSA, we measured the synchronous fluorescence spectra at Δλ = 60 nm (Fig. 10) and Δλ = 15 nm (Fig. S4 ESI) of BSA with H2L and the complexes 14.
image file: c3ra43865a-f10.tif
Fig. 10 Synchronous spectra of BSA (1 μM) in the presence of increasing amounts of H2L and complexes 1–4 (0–40 μM) for a wavelength difference of Δλ = 60 nm. The arrow shows the emission intensity changes upon increasing concentration of compound.

The results showed that the fluorescence of the tyrosine residue was hyperchromic, and that of tryptophan residue was hypochromic. However, the fluorescence intensities of the tryptophan residues changed significantly, with a red shift, by the addition of an increasing amount of the compounds. It indicates that the hydrophobicity of the microenvironment around the tryptophan residues decreases in the presence of the added compounds52 and that the complexes bind to the active site in the protein, which makes them potential molecules for biological applications. This result prompted us to further explore the biological activities of the new organometallic ruthenium(II) complexes.

2.6. Antioxidant activity

The antioxidant properties of ruthenium complexes have attracted much interest and have been investigated mainly in in vitro systems, but their radical scavenging activity is limited to the hydroxyl radical.53 We carried out experiments to explore the free radical scavenging ability of the new complexes, precursors and the ligand, against a panel of free radicals, with a hope to develop potential antioxidants and therapeutic reagents. The IC50 values of all the precursor complexes, ligand and new ruthenium complexes for the selected free radicals show interesting results and are presented in Table 6. The IC50 values obtained from the different types of assay experiments strongly support the view that the new complexes 3 and 4 presented in this work possess excellent antioxidant activities, which are better than those of the standard antioxidants including natural antioxidant, vitamin C and the synthetic antioxidant, BHT. The ligand displayed an almost comparable radical scavenging activity with respect to the standard synthetic antioxidant (BHT), except in the case of the hydroxyl and superoxide anion radicals.
Table 6 Antioxidant and metal chelating activity of the ligand, precursors, new complexes, vitamin C and BHT
Compounds IC50 (μM)
DPPH˙ OH˙ NO˙ O2˙ H2O2 Metal chelation
H2L 96.3 ± 2.9 129.9 ± 3.6 151.7 ± 0.4 187.3 ± 5.2 144.2 ± 1.7 51.6 ± 2.4
1 199.7 ± 3.4 234.9 ± 1.5 212.2 ± 4.8 267.4 ± 3.6 288.5 ± 3.2 387.9 ± 1.8
2 243.5 ± 4.5 289.8 ± 5.8 256.3 ± 5.9 294.2 ± 4.8 302.2 ± 2.7 413.1 ± 2.3
3 41.6 ± 2.8 54.2 ± 2.3 66.2 ± 1.3 68.1 ± 3.1 135.8 ± 2.0 49.7 ± 0.8
4 37.4 ± 1.9 57.7 ± 0.8 62.9 ± 3.5 67.3 ± 0.9 146.9 ± 4.1 45.2 ± 2.7
Vitamin C 147.6 ± 4.2 232.8 ± 1.9 215.8 ± 2.7 221.4 ± 1.2 238.5 ± 3.6
BHT 86.2 ± 1.8 163.4 ± 0.7 154.3 ± 2.4 131.6 ± 1.5 149.8 ± 4.3


The reactivity of free radicals can be neutralized by the donation of an electron or proton. Lower the IC50 increases the hydrogen donating ability and thus the antioxidant activity of the free radical scavengers. Consistent with the above fact, 3 and 4 showed better a radical scavenging activity than the precursor complexes and the ligand. This might be due to the presence of a free carboxylic acid group in 3 and 4, thus making those complexes efficient hydrogen donors to stabilize the unpaired electrons and thereby scavenging the free radicals. The appropriate attachment of a COOH group and a metal fragment might only be the responsible factor which makes 3 and 4 superior to the ligands and the precursor complexes in all the radical scavenging assays. Out of the six radical species chosen for examination, the DPPH radical scavenging power of the tested complexes was the greatest (37.4 ± 1.9 μM) and the hydrogen peroxide scavenging ability was the least (146.9 ± 4.1 μM). A plausible mechanism for the DPPH scavenging activity of the complexes is given in Fig. S5 (ESI). The DPPH radical scavenging ability of the new complexes is better than that of those reported by us for other ruthenium(II) complexes, comprising dicarboxylic acids.37

The antioxidant capacity of any compound, besides being related with the hydrogen atom transfer reaction, could also be due to its capacity to chelate metal ions and/or inhibit oxidative enzymes. Some investigators have proposed the participation of a perferryl complex (ADP–Fe3+–O2˙) in the initiation and propagation of lipid peroxidation, which also require the presence of oxygen and free iron.54 So, the presence of molecules with the ability to chelate metal ions could reduce the reactive species and, consequently, protect lipid membranes against peroxidation. Hence, we studied the metal chelating ability of our compounds with the Fe2+ ion, which showed that the complexes (3 and 4) have a high metal chelating activity, which might be due to the chelation by the uncoordinated COOH group. It is to be noted that no significant radical scavenging activities were observed in all the experiments carried out with the ruthenium precursor complexes under the same experimental conditions. From the above results, it can be concluded that the scavenging effects of the precursor complexes and free ligands is significantly less when compared to their corresponding new ruthenium(II) complexes, which is mainly due to the chelation of the organic ligand with the ruthenium(II) ion. Although the radical scavenging mechanism of the complexes under study remains unclear, the experimental results are helpful in designing more effective antioxidant agents against free radicals.

2.7. Cytotoxic activity studies

2.7.1. MTT assay. Since the results of the antioxidant activity experiments revealed that the compounds can exhibit a good radical scavenging activity, we focussed our attention on the anticancer activity evaluation studies, because it is strongly suspected that cancer may be one of those degenerative disease induced by free radicals. Hence, the tumour inhibiting capacity of the compounds against A549 cells (a model cell line for lung cancer) by the MTT assay, that is based on the mitochondrial reduction of the tetrazolium salt by actively growing cells to produce blue insoluble formazan crystals, was undertaken. The cells were treated with different concentrations of the test compounds. The compounds were dissolved in DMSO and blank samples containing the same volume of DMSO were taken as controls, to identify the activity of the solvent in this cytotoxicity experiment. In parallel, the influence of the widely used anticancer drug, cisplatin, was also assayed, as a positive control. The cell viability of the human lung cancer cells was assessed and the results were expressed as the % cell viability. It is to be noted that the ruthenium precursor complexes 1, 2 and the ligand did not show any significant activity, even up to a 100 μM concentration, on the A549 cell growth in the MTT assay, LDH release and NO release, confirming that the chelation of the ligand with the ruthenium(II) ion might be the only responsible factor for the observed cytotoxic properties of the new complexes. The new complexes exhibited high cytotoxic effects on lung cancer cells with low IC50 values indicating their efficiency in inhibiting the growth of lung cancer cells even at low concentrations. The results also showed that the new complexes inhibited A549 cell proliferation in a dose dependent manner. The IC50 values were found to be 5 ± 0.29, 50 ± 2.39 and 25 ± 1.68 μM for complexes 3, 4 and cisplatin, respectively. On comparing the IC50 values of the complexes, it was found that 3 was more effective in inducing cell death than 4 (Fig. 11). The IC50 value of the complex 3 was found to be five times lower than the standard anticancer drug cisplatin, suggesting that these complexes can be explored for their potential use as medicines for cancer.
image file: c3ra43865a-f11.tif
Fig. 11 The IC50 value (50% inhibition of cell growth for 48 hours) for complexes 3, 4 and cisplatin on human lung cancer cell line A549. Results shown are mean ± SEM, which are three separate experiments performed in triplicate.
2.7.2. Lactate dehydrogenase release. LDH is a stable cytoplasmic enzyme that is released into the culture medium, following the loss of membrane integrity resulting from apoptosis. LDH activity, therefore, can be used as an indicator of the cell membrane integrity and serves as a general means to assess cytotoxicity resulting from chemical compounds or environmental toxic factors.55,56 Hence, in the present study, LDH leakage into the culture medium of the compounds treated cells was analyzed. It was observed that the new complexes could significantly induce the release of LDH into the culture medium, which indicates that the complexes could rupture the plasma membrane (Fig. 12). Among the compounds examined, 3 was found to be more potent in inducing LDH leakage into the culture than the rest. Even though there was significant increase in the LDH leakage in the complex treated cells than the control cells, they could not induce LDH leakage as high as that of cisplatin.
image file: c3ra43865a-f12.tif
Fig. 12 Percentage of lactate dehydrogenase released by human cancer cell line, A549 after an incubation period of 48 hours with the complexes 3 (5 μM) and 4 (50 μM) and cisplatin (25 μM). Results shown are mean ± SEM, which are from three separate experiments performed in triplicate.
2.7.3. Nitric oxide release. A major challenge in the treatment of cancer is improving the response to chemotherapy. Nitric oxide (NO) has great potential as an agent to augment the effects of radiation therapy in several cancers. Hence, we focussed our study on the release of NO by the treatment of our complexes on A549 cells and the results are shown in Fig. 13. The results of the NO release assay authenticate the results obtained by MTT and LDH leakage assays indicating that complex 3 is more effective than the complex 4. Though it is slightly lower than that of cisplatin, it is much better than those reported for other ruthenium(II) complexes containing triphenylphosphines.57
image file: c3ra43865a-f13.tif
Fig. 13 Nitric oxide released by the human cancer cell line, A549, after an incubation period of 48 hours with the complexes 3 (5 μM), 4 (50 μM) and cisplatin (25 μM). Results shown are mean ± SEM, which are from three separate experiments performed in triplicate.

3. Conclusion

The present contribution describes the synthesis of two new organometallic ruthenium complexes comprising chelidonic acid. Both the complexes have been extensively characterized and their biological activities were compared with the activities their respective precursor complexes and the ligand. The dibasic bidentate behavior of the ligand, the metal mediated C–H activation and ortho metallation along with the molecular structure of 3 were confirmed by single crystal X-ray crystallographic studies. Such an ortho metallation is quite surprising in this case, though an electron rich donor (6 oxygen atoms) is present in the ligand. The antimicrobial tests showed that the new complexes 3 and 4 exhibited antimicrobial properties, but the activity of 4 is better than that of 3 and both were found to be more active against Gram-positive than Gram-negative bacteria and fungi. While comparing the binding ability of ligand and complexes 14 with HS DNA/BSA, the new ruthenium(II) complexes (3 and 4) had a better binding ability than the ligand and their parent complexes (1 and 2). The phosphine analogues (1 and 3) showed a greater binding affinity over the arsine analogues (2 and 4). This might be due to the presence of bulky AsPh3 groups trans to each other, which causes steric hindrance. It revealed that the effective binding strength of the chelating ligand (H2L) towards the double helical DNA would be reduced by the steric clashes from the six phenyl rings of the trans AsPh3 with the DNA surface. The steric clash involving the co-ligands and the DNA polymer would hinder the placing of the chelating rings in between the DNA helix. These steric clashes also appeared in the triphenylphosphine complexes, but the potency was small when compared to the triphenylarsine analog. The details obtained from the various antioxidant assays showed that the new complexes, which contain an uncoordinated COOH group displayed an excellent radical scavenging ability and the deduced patterns of antioxidant activity decreased in the following order 3–4 > H2L > 1, 2. The cytotoxic effects of the compounds examined on A549 cells by an MTT assay, LDH and NO release demonstrated that complex 3 showed a promising tumour cell growth inhibiting activity, outperforming that of cisplatin. This significant activity of 3 might be due to the presence of the phosphine ligands, which is supposed to provide a better cytotoxicity by enhancing lipophilicity and consequently permeability through the cell membrane. At this juncture, it is notable to mention that the cyclometallation reaction presented in this paper took place under neutral conditions (without auxiliaries).

4. Experimental section

4.1. Materials and instrumentation

All the chemicals were of reagent grade and were used as received from commercial suppliers, unless otherwise stated. All the solvents were degassed and distilled according to standard procedures.58 Commercially available RuCl3·3H2O (Himedia) was used to prepare the starting complexes. The starting complexes [RuHCl(CO)(PPh3)3],59 [RuHCl(CO)(AsPh3)3]60 were prepared as reported earlier. The ligand chelidonic acid monohydrate was purchased from Acros Organics. The melting points were determined with a Lab India instrument. The elemental analyses of carbon, hydrogen and nitrogen were performed on a Vario EL III Elementar elemental analyzer. The electronic absorption spectra of the compounds were recorded using a JASCO 600 spectrophotometer and the emission measurements were carried out by using a JASCO FP-6600 spectrofluorometer. A Nicolet Avatar Model FT-IR spectrophotometer was used to record the IR spectra (4000–400 cm−1) of the free ligand and the complexes as KBr pellets. The 1H NMR and 13C NMR spectra were recorded on a Bruker AV 500 (500 MHz (1H) and 125 MHz (13C)) spectrometer using tetramethylsilane (TMS) as an internal reference. The chemical shifts are expressed in parts per million (ppm). Protein free herring sperm ds DNA obtained from SRL Chemicals was stored at 0–4 °C. Bovine serum albumin (BSA) and ethidium bromide (EB) were obtained from Sigma-Aldrich. The antioxidant activity measurements were done using a UV spectrophotometer (UV-1800, Shimadzu).

4.2. Synthesis of complexes

4.2.1. Synthesis of [Ru(HL)(CH3CN)(CO)(PPh3)2] (3). The ligand 4-oxo-4H-pyran-2,6-dicarboxylic acid (0.021 g, 0.105 mmol) and [RuHCl(CO)(PPh3)3] (0.100 g, 0.105 mmol) were dissolved in dry CH3CN (20 mL) and refluxed for 6 h. The resulting solution was allowed to stand for at least one week under air, until colorless crystals of the target complex 3 were formed. These were filtered, washed with n-hexane and dried.

Yield: 76%. Mp: 246 °C. Anal. Calcd for C46H35NO7P2Ru: C, 63.01; H, 4.02; N, 1.60%. Found: C, 63.12; H, 4.01; N, 1.60%. FT-IR (cm−1) in KBr: 3436 ν(free COOH), 1600 ν(free C[double bond, length as m-dash]OOH), 1617 ν(pyrone ring (C[double bond, length as m-dash]O) + asymm. COO), 1433 ν(symm. COO), 1188 ν(C–O), 1952 ν(C[triple bond, length as m-dash]O), 695, 1090, 1395 ν(PPh3). UV-vis (DMSO), λmax, nm (ε, dm3 mol−1 cm−1): 229 (77890), 243 (31110), 265 (11200) (intraligand transitions); 370 (1670) (MLCT π*(H2L) ← dπ(Ru)). 1H NMR (DMSO-d6, ppm): 11.29 (bs, 1H, –COOH), 7.87 (s, 1H, [double bond, length as m-dash]C–H), 2.09 (s, 1H, –CH3), 7.23–7.70 (m, 30H, aromatic PPh3). 13C NMR (DMSO-d6, ppm): 204.42 (C[triple bond, length as m-dash]O), 119.18 (C[triple bond, length as m-dash]N), 196.57 (C–Ru), 13.62 (CH3), 163.38 (free COOH), 181.91 (COORu), 168.52 (C[double bond, length as m-dash]C–COO), 130.52, 131.91, 132.00, 132.52 (aromatic PPh3), 172.14 (pyrone ring C[double bond, length as m-dash]O), 93.57 (C[double bond, length as m-dash]C–H), 153.44 (C–COOH).

4.2.2. Synthesis of [Ru(HL)(CH3CN)(CO)(AsPh3)2] (4). This compound was synthesized using the same procedure as described for 3, with the ligand (H2L) (0.021 g, 0.106 mmol) and the precursor complex, [RuHCl(CO)(AsPh3)3] (0.115 g, 0.106 mmol). The purity of the complex was checked by TLC ((99[thin space (1/6-em)]:[thin space (1/6-em)]5) chloroform–methanol) and attempts to isolate crystals suitable for single crystal XRD studies were unsuccessful.

Yield: 71%. Mp: 227 °C. Anal. Calcd for C46H35NO7As2Ru: C, 57.27; H, 3.66; N, 1.45%. Found: C, 57.31; H, 3.62; N, 1.40%. FT-IR (cm−1) in KBr: 3189 ν(free COOH), 1611 ν(free C[double bond, length as m-dash]OOH), 1644 ν(pyrone ring (C[double bond, length as m-dash]O) + asymm. COO), 1431 ν(symm. COO), 1254 ν(C–O), 1955 ν(C[triple bond, length as m-dash]O), 697, 1086, 1388 ν(AsPh3). UV-vis (DMSO), λmax, nm (ε, dm3 mol−1 cm−1): 235 (55460), 246 (53460), 262 (43830) (intraligand transition); 360 (3400) (MLCT π*(H2L) ← dπ(Ru)). 1H NMR (DMSO-d6, ppm): 12.32 (bs, 1H, –COOH), 7.79 (s, 1H, [double bond, length as m-dash]C–H), 2.37 (s, 1H, –CH3), 7.17–7.26 (m, 30H, aromatic AsPh3). 13C NMR (DMSO-d6, ppm): 205.47 (C[triple bond, length as m-dash]O), 121.53 (C[triple bond, length as m-dash]N), 199.41 (C–Ru), 16.87 (CH3), 163.90 (free COOH), 181.35 (COORu), 169.87 (C[double bond, length as m-dash]C–COO), 132.12, 132.21, 132.87, 132.94 (aromatic AsPh3), 172.68 (pyrone ring C[double bond, length as m-dash]O), 93.99 (C[double bond, length as m-dash]C–H), 153.59 (C–COOH).

4.3. Single crystal X-ray crystallography

The X-ray diffraction measurements were performed on a Nonius Kappa CCD diffractometer equipped with graphite monochromated Mo Kα radiation and an Oxford Cryostream cryostat. The structure of the complex was solved by direct methods and the refinements were carried out by the full matrix least-squares technique. The hydrogen atoms were generally visible in the difference maps and were placed in idealized positions and treated as riding in the refinements, except for those on the water molecule, for which the coordinates were refined. The crystal was an inversion twin, with A refined Flack parameter x = 0.67(16). The following computer programs were used: structure solution SIR-97,61 refinement SHELXL-97,62 molecular diagrams and ORTEP-363 for Windows.

4.4. In vitro antimicrobial assay

The synthesized compounds were evaluated for their antimicrobial activity by the agar well diffusion method.64,65 The bacterial pathogens used in the present study included Staphylococcus aureus, Enterococcus faecalis, Escherichia coli and Klebsiella pneumonia and the fungi Aspergillus niger and Candida albicans, which were procured from the PSG Hospital, Coimbatore, India. The required nutrient broth and sabouraud dextrose broth were prepared and sterilized at 121 °C. The bacterial strains were inoculated onto nutrient broth (108 cells per mL) and fungal strains were inoculated onto sabouraud dextrose broth (10 spores per mL) and incubated overnight. About 30 mL of a sterilized agar medium were transferred aseptically in to each sterilized petri plate. The plates were left at room temperature for solidification. The overnight grown bacterial cultures and fungal spores were swabbed onto the solidified media to achieve a lawn of confluent bacterial/fungal growth. A well of 6 mm diameter was made using a sterile cork borer. The test drugs were added at concentrations of 0 (control), 25, 50, 75, 100 μg mL−1. Ciprofloxacin and fluconazole were used as positive control drugs for the antibacterial and antifungal activities, respectively. The antibacterial assay plates were incubated at 37 ± 2 °C for 24 h and the antifungal assay plates were incubated at 28 ± 2 °C for 48 h. After the incubation period, the diameter of the inhibition zone was measured as an indicator for the activity of the compounds. Dimethyl sulphoxide was used both as a solvent and as a negative control. No inhibition zone was observed in the control (i.e. for DMSO). Each experiment was performed in triplicate.

4.5. DNA interaction studies

All of the experiments involving the binding of the compounds with HS DNA were carried out in deionised water with tris(hydroxymethyl)-aminomethane (Tris, 5 mM) and sodium chloride (50 mM) and adjusted to pH 7.2 with hydrochloric acid at room temperature. A solution of herring sperm DNA (0.1 g) in tris-HCl buffer (10 mL) gave a ratio of UV absorbance at 260 and 280 nm of ca. 1.7–1.8[thin space (1/6-em)]:[thin space (1/6-em)]1 indicating that the DNA was sufficiently free of protein. The DNA concentration per nucleotide was determined by absorption spectroscopy, using the molar absorption coefficient (6600 M−1 cm−1) at 260 nm. The compounds were dissolved in a mixed solvent of 5% DMSO and 95% tris-HCl buffer. The absorption spectra were recorded after equilibrium at 20 °C for 10 min. The absorption titration experiments were performed with a fixed concentration of the compounds (10 μM) while gradually increasing the concentration of DNA (0–50 μM). While measuring the absorption spectra, an equal amount of DNA was added to both the test solution and the reference solution, to eliminate the absorbance of DNA itself.

In order to know the exact mode of attachment of the compounds with HS DNA, fluorescence quenching experiments of ethidium bromide (referred to as EB)–DNA complex were also carried out by increasing the concentration of the ruthenium(II) complexes (0–50 μM) to the samples containing 10 μM EB, 10 μM DNA, and tris buffer. Before the measurements, the system was shaken and incubated at room temperature for ∼5 min. The emission was recorded at 530–750 nm. The fluorescence spectra in the fluorimeter were obtained at an excitation wavelength of 522 nm and an emission wavelength of 620 nm.

4.6. Protein binding studies

The binding of the compounds with bovine serum albumin (BSA) was studied from the fluorescence spectra recorded with an excitation wavelength of 280 nm and the corresponding emission at 345 nm, assignable to that of BSA. The excitation and emission slit widths and scan rates were maintained constant for all of the experiments. A stock solution of BSA was prepared in 50 mM phosphate buffer (pH = 7.2) and stored in the dark at 4 °C for further use. A concentrated stock solution of the compounds was prepared as mentioned for the DNA binding experiments, except that the phosphate buffer was used instead of a Tris-HCl buffer for all of the experiments. The titrations were manually done by using a micropipette for the addition of the compounds. For the synchronous fluorescence spectra also, the same concentrations of BSA and the compounds were used, and the spectra were measured at two different Δλ values (difference between the excitation and emission wavelengths of BSA), such as 15 and 60 nm.

4.7. Antioxidant assays

The ability of the ligand and ruthenium complexes to act as hydrogen donors or free radical scavengers was tested by conducting a series of in vitro antioxidant assays, involving the DPPH radical, hydroxyl radical, nitric oxide radical, hydrogen peroxide, superoxide anion radical, metal chelating assay and the results were compared with that of standard antioxidants including natural antioxidant vitamin C and the synthetic antioxidant BHT.
4.7.1. DPPH˙ scavenging assay. The DPPH radical scavenging activity of the compounds was measured according to the method of Blois.66 The DPPH radical is a stable free radical and due to the presence of an odd electron, it shows a strong absorption band at 517 nm in the visible spectrum. If this electron becomes paired off in the presence of a free radical scavenger, this absorption vanishes resulting in decolorization stoichiometrically with respect to the number of electrons taken up. Various concentrations of the experimental compounds were taken and the volumes were adjusted to 100 μL with methanol. About 5 mL of a 0.1 mM methanolic solution of DPPH was added to the aliquots of samples and standards (BHT and vitamin C) and shaken vigorously. A negative control was prepared by adding 100 μL of methanol in 5 mL of 0.1 mM methanolic solution of DPPH. The tubes were allowed to stand for 20 minutes at 27 °C. The absorbance of the sample was measured at 517 nm against the blank (methanol).
4.7.2. OH˙ scavenging assay. The hydroxyl radical scavenging activity of the compounds was investigated using the Nash method.67In vitro hydroxyl radicals were generated by an Fe3+–ascorbic acid system. The detection of the hydroxyl radicals was carried out by measuring the amount of formaldehyde formed from the oxidation reaction with DMSO. The formaldehyde produced was detected spectrophotometrically at 412 nm. In a typical experiment, a mixture of 1.0 mL of iron–EDTA solution (0.13% ferrous ammonium sulfate and 0.26% EDTA), 0.5 mL of EDTA solution (0.018%), and 1.0 mL of DMSO (0.85% DMSO (v/v) in 0.1 M phosphate buffer, pH 7.4) were sequentially added in the test tubes, which contained a fixed concentration of the test compounds. The reaction was initiated by adding 0.5 mL of ascorbic acid (0.22%) and was incubated at 80–90 °C for 15 min in a water bath. After incubation, the reaction was terminated by the addition of 1.0 mL of ice-cold trichloroacetic acid (17.5% w/v). Subsequently, 3.0 mL of the Nash reagent was added to each tube and left at room temperature for 15 min. The intensity of the colour formed was measured spectrophotometrically at 412 nm against the reagent blank.
4.7.3. NO˙ scavenging assay. The assay of nitric oxide (NO˙) scavenging activity is based on the method,68 where sodium nitroprusside in an aqueous solution at a physiological pH spontaneously generates nitric oxide, which interacts with oxygen to produce nitrite ions. This can be estimated using the Griess reagent. Scavengers of nitric oxide compete with oxygen, leading to a reduced production of nitrite ions. For the experiment, sodium nitroprusside (10 mM) in phosphate buffered saline was mixed with a fixed concentration of the compounds, standards and incubated at room temperature for 150 min. After the incubation period, 0.5 mL of the Griess reagent containing 1% sulfanilamide, 2% H3PO4 and 0.1% N-(1-naphthyl)ethylenediaminedihydrochloride was added. The absorbance of the chromophore formed was measured at 546 nm.
4.7.4. H2O2 scavenging assay. The ability of the compounds to scavenge hydrogen peroxide was determined using the method of Ruch et al.69 In a typical experiment, a solution of hydrogen peroxide (2.0 mM) was prepared in a phosphate buffer (0.2 M, pH-7.4) and its concentration was determined spectrophotometrically from the absorption at 230 nm with a molar absorptivity of 81 M−1cm−1. The compounds (100 μg mL−1), BHT and vitamin C (100 μg mL−1) were added to 3.4 mL of a phosphate buffer prepared above, together with a hydrogen peroxide solution (0.6 mL). An identical reaction mixture without the sample was taken as a negative control. The absorbance of hydrogen peroxide at 230 nm was determined after 10 min against the blank (phosphate buffer).
4.7.5. O2˙scavenging assay. The superoxide anion radical (O2˙) scavenging assay is based on the capacity of the compounds to inhibit formazan formation by scavenging the superoxide radicals generated in the riboflavin–light–NBT system.70 In a typical experiment, a 3 mL reaction mixture contained 50 mM sodium phosphate buffer (pH 7.6), 20 μg riboflavin, 12 mM EDTA, 0.1 mg NBT and 1 mL complex solution (20–100 μg mL−1). The reaction was started by illuminating the reaction mixture with different concentrations of the complex for 90 s. Immediately after illumination, the absorbance was measured at 590 nm. The entire reaction assembly was enclosed in a box lined with aluminium foil. Identical tubes with the reaction mixture kept in the dark served as blanks.
4.7.6. Metal chelating activity. The chelation with ferrous ions by the experimental compounds was estimated by the method of Dinis et al.71 Initially, about 100 μL of the samples and the standards were added to a 50 μL solution of 2 mM FeCl2. The reaction was initiated by the addition of 200 μL of 5 mM ferrozine and the mixture was shaken vigorously and left standing at room temperature for 10 minutes. The absorbance of the solution was then measured spectrophotometrically at 562 nm against the blank (deionized water).

For the above six assays, all the tests were run in triplicate and the percentage activity was calculated using the following equation:

Scavenging activity (%) = [(A0A1)/A0] × 100
where A0 is the absorbance of the control, A1 is the absorbance of the complex/standard. When the inhibition of the tested compounds is 50%, the tested compound concentration is IC50.

4.8. Anticancer activity studies

4.8.1. MTT assay. The effects of the compounds on the viability of human lung cancer cells (A549) was assayed by the 3-(4,5-dimethylthiazol-2-yl-)-2,5-diphenyltetrazoliumbromide (MTT) assay.72 The cells were seeded at a density of 10[thin space (1/6-em)]000 cells per well in 200 μL DMEM (Dulbecco's Modified Eagle's Medium) and were allowed to attach overnight in a CO2 incubator. Then the ligand and the complexes dissolved in DMSO were added to the cells at a final concentration of 1, 10, 25 and 50 μM in the cell culture media. After 48 h, 20 μL of MTT (5 mg mL−1 PBS) was added and incubated at 37 °C for 4 h. The purple formazan crystals formed were dissolved in 200 μL of DMSO and read at 570 nm in a micro plate reader.
4.8.2. Release of lactate dehydrogenase (LDH). The LDH activity was determined by the linear region of a pyruvate standard graph, using regression analysis and expressed as the percentage (%) leakage, as described previously.73 Briefly, to a set of tubes, 1 mL of buffered substrate (lithium lactate) and 0.1 mL of the media or cell extract were added and the tubes were incubated at 37 °C for 30 min. After adding 0.2 mL of NAD (nicotinamide adenine dinucleotide) solution, the incubation was continued for another 30 min. The reaction was then arrested by adding 0.1 mL of DNPH (dinitrophenylhydrazine) reagent and the tubes were incubated for a further period of 15 min at 37 °C. After this, 0.1 mL of media or cell extract was added to the blank tubes, after arresting the reaction with DNPH. A 3.5 mL portion of 0.4 N sodium hydroxide was added to all the tubes. The intensity of the colour that developed was measured at 420 nm, using a Shimadzu UV-visible spectrophotometer. The amount of LDH released was expressed as a percentage.
4.8.3. Nitric oxide (NO) assay. The amount of nitrite was determined by the method of Stueher and Marletta.74 Nitrite reacts with the Griess reagent, to give a coloured complex which can be measured at 540 nm. In a typical experiment, to a 100 μL of the medium, 50 μL of the Griess reagent I was added, mixed and allowed to react for 10 min. This was followed by 50 μL addition of the Griess reagent II and the reaction mixture was mixed well and incubated for another 10 min at room temperature. The intensity of the pink colour that developed was measured at 540 nm using a microquant plate reader (Biotek Instruments).

Acknowledgements

The Department of Science and Technology, New Delhi for funds for the research and the Council of Scientific and Industrial Research, New Delhi, India, for the award of a Senior Research Fellowship to T. Sathiya Kamatchi are gratefully acknowledged. We would also like to thank Mr T. Sajeesh and Dr T. Parimelazhagan, Department of Botany, Bharathiar University, India for their help in the radical scavenging assays.

References

  1. (a) C. Jia, T. Kitamura and Y. Fujiwara, Acc. Chem. Res., 2001, 34, 633–639 CrossRef CAS PubMed; (b) J. A. Labiner and J. E. Bercaw, Nature, 2002, 417, 507 CrossRef PubMed; (c) L. C. Campeau, D. R. Stuart and K. Fagnou, Aldrichim. Acta, 2007, 40, 35–41 CAS; (d) L. Ackermann, R. Vicente and A. R. Kapdi, Angew. Chem., Int. Ed., 2009, 48, 9792–9826 CrossRef CAS PubMed; (e) T. W. Lyons and M. S. Sanford, Chem. Rev., 2010, 110, 1147–1169 CrossRef CAS PubMed; (f) J. Wencel-Delord, T. Droge, F. Liu and F. Glorius, Chem. Soc. Rev., 2011, 40, 4740–4761 RSC.
  2. A. E. Shilov and G. B. Shulpin, Chem. Rev., 1997, 97, 2879–2932 CrossRef CAS PubMed.
  3. D. J. De Geest, B. J. O'keefe and P. J. Stell, J. Organomet. Chem., 1999, 579, 97–105 CrossRef CAS.
  4. V. Ritleng, C. Sirlin and M. Pfeffer, Chem. Rev., 2002, 102, 1731–1769 CrossRef CAS PubMed.
  5. A. R. Dick and M. S. Sanford, Tetrahedron, 2006, 62, 2439–2463 CrossRef CAS.
  6. E. M. Beck and M. J. Gaunt, Top. Curr. Chem., 2010, 292, 85–121 CrossRef CAS PubMed.
  7. L. Ackermann and R. Vicente, Top. Curr. Chem., 2010, 292, 211–229 CrossRef CAS PubMed.
  8. J. Bouffard and K. Itami, Top. Curr. Chem., 2010, 292, 231–280 CrossRef CAS PubMed.
  9. O. Daugulis, Top. Curr. Chem., 2010, 292, 57–84 CrossRef CAS PubMed.
  10. A. A. Kulkarni and O. Daugulis, Synthesis, 2009, 24, 4087–4109 Search PubMed.
  11. C. L. Sun, B. J. Li and Z. J. Shi, Chem. Rev., 2011, 111, 1293–1314 CrossRef CAS PubMed.
  12. J. R. Wang and K. Manabe, Synthesis, 2009, 1405–1427 Search PubMed.
  13. J. Q. Yu, R. Giri and X. Chen, Org. Biomol. Chem., 2006, 4, 4041–4047 CAS.
  14. P. Herrmann and T. Bach, Chem. Soc. Rev., 2011, 40(4), 2022–2038 RSC.
  15. R. Giri, B. F. Shi, K. M. Engle, N. Maugel and J. Q. Yu, Chem. Soc. Rev., 2009, 38, 3242–3272 RSC.
  16. M. Pfeffer and J. Dupont, Palladacycles: Synthesis, Characterization and Applications, Wiley-VCH, Weinheim, Germany, 1st edn, 2008 Search PubMed.
  17. (a) N. Beydoun and M. Pfeffer, Synthesis, 1990, 729 CrossRef CAS; (b) R. C. Larock and E. K. Yum, J. Am. Chem. Soc., 1991, 113, 6689–6690 CrossRef CAS; (c) M. Pfeffer, J. P. Sutter, M. A. Rotteveel, A. DeCian and J. Fischer, Tetrahedron, 1992, 48, 2427–2440 CrossRef CAS; (d) J. Vicente, J. A. Abad and J. Gil-Rubio, J. Organomet. Chem., 1992, 436, C9–C12 CrossRef CAS; (e) J. P. Sutter, M. Pfeffer, A. DeCian and J. Fischer, Organometallics, 1992, 11, 386–392 CrossRef CAS; (f) A. De Cian, J. J. Fischer and A. Gil-Rubio, Inorg. Chim. Acta, 1994, 222, 1 CrossRef; (g) F. Maassarani, M. Pffefer, J. Spencer and E. Wehman, J. Organomet. Chem., 1994, 466, 265–271 CrossRef CAS; (h) R. C. Larock, E. K. Yum, M. J. Doty and K. K. C. Sham, J. Org. Chem., 1995, 60, 3270–3271 CrossRef CAS; (i) J. Spencer, M. Pfeffer, N. Kyritsakas and J. Fischer, Organometallics, 1995, 14, 2214–2224 CrossRef CAS; (j) J. Spencer, M. Pfeffer, A. De Cian and J. Fischer, J. Org. Chem., 1995, 60, 1005–1012 CrossRef CAS; (k) J. Vicente, J. A. Abad, R. Bergs, P. G. Jones and M. C. Ramirez de Arellano, Organometallics, 1996, 15, 1422–1426 CrossRef CAS; (l) J. Spencer and M. Pfeffer, in Advances in Metal–Organic Chemistry, ed. L. S. Liebeskind, JAI Press, London, 1998, 6, pp. 103–144 Search PubMed.
  18. (a) T. Bessho, E. Yoneda, J. H. Yum, M. Guglielmi, I. Tavernelli, H. Imai, U. Rothlisberger, M. K. Nazeeruddin and M. J. Grcatzel, J. Am. Chem. Soc., 2009, 131, 5930–5934 CrossRef CAS PubMed; (b) P. G. Bomben, K. C. D. Robson, P. A. Sedach and C. P. Berlinguette, Inorg. Chem., 2009, 48, 9631–9643 CrossRef CAS PubMed; (c) B. D. Koivisto, K. C. D. Robson and C. P. Berlinguette, Inorg. Chem., 2009, 48, 9644–9652 CrossRef CAS PubMed.
  19. (a) A. D. Ryabov, V. S. Soukharev, L. Alexandrova, R. L. Lagadec and M. Pfeffer, Inorg. Chem., 2001, 40, 6529–6532 CrossRef CAS PubMed; (b) I. S. Alpeeva, V. S. Soukharev, L. Alexandrova, N. V. Shilova, N. V. Bovin, E. Cscoregi, A. D. Ryabov and I. Y. Sakharov, JBIC, J. Biol. Inorg. Chem., 2003, 8, 683–688 CrossRef CAS PubMed; (c) V. S. Soukharev, A. D. Ryabov and E. Cscoregi, J. Organomet. Chem., 2003, 668, 75–81 CrossRef CAS; (d) R. L. Lagadec, L. Rubio, L. Alexandrova, R. A. Toscano, E. V. Ivanova, R. Meskys, V. Laurinavicius, M. Pfeffer and A. D. Ryabov, J. Organomet. Chem., 2004, 689, 4820–4832 CrossRef; (e) A. D. Ryabov, R. L. Lagadec, H. Estevez, R. A. Toscano, S. Hernandez, L. Alexandrova, V. S. Kurova, A. Fischer, C. Sirlin and M. Pfeffer, Inorg. Chem., 2005, 44, 1626–1634 CrossRef CAS PubMed; (f) A. D. Ryabov, V. S. Kurova, E. V. Ivanova, R. L. Lagadec and L. Alexandrova, Anal. Chem., 2005, 77, 1132–1139 CrossRef CAS PubMed; (g) R. L. Lagadec, L. Alexandrova, H. Estevez, M. Pfeffer, J. Razumiene, V. Laurinavicius and A. D. Ryabov, Eur. J. Inorg. Chem., 2006, 2006(14), 2735–2738 CrossRef.
  20. (a) C. Gaidon, P. Jeannequin, P. Bischoff, M. Pfeffer, C. J. P. Sirlin and Loeffler, J. Pharmacol. Exp. Ther., 2005, 315, 1403–1411 CrossRef PubMed; (b) L. Leyva, C. Sirlin, L. Rubio, C. Franco, R. L. Lagadec, J. Spencer, P. Bischoff, J. Gaidon, C. P. Loeffler and M. Pfeffer, Eur. J. Inorg. Chem., 2007, 2007(19), 3055–3066 CrossRef; (c) L. Leyva, F. Malek, S. Benzina, J. M. Denis, J. Gueulette, P. Dufour, C. Gaiddon, J. P. Loeffler, C. Sirlin, M. Pfeffer and P. Bischoff, Lett. Drug Des. Discovery, 2008, 5, 1–6 CrossRef CAS; (d) X. Meng, M. L. Leyva, M. Jenny, I. Gross, S. Benosman, B. Fricker, S. Harlepp, P. Hebraud, A. Boos, P. Wlosik, P. Bischoff, C. Sirlin, M. Pfeffer, J. P. Loeffler and C. Gaiddon, Cancer Res., 2009, 69, 5458–5466 CrossRef CAS PubMed; (e) J. Ruiz, C. Vicente, C. De Haro and D. Bautista, Dalton Trans., 2009, 5071–5073 RSC . For excellent reviews including noncyclometalated ruthenium complexes with anticancer properties, see: ; (f) P. J. Dyson and G. Sava, Dalton Trans., 2006, 1929–1933 RSC; (g) L. Ronconi and P. J. Sadler, Coord. Chem. Rev., 2007, 251, 1633–1648 CrossRef CAS.
  21. (a) P. Dani, T. Karlen, R. A. Gossage, S. Gladiali and G. Van Koten, Angew. Chem., Int. Ed., 2000, 39, 743–745 CrossRef CAS; (b) W. Baratta, P. Da Ros, A. Del Zotto, A. Sechi, E. Zangrando and P. Rigo, Angew. Chem., Int. Ed., 2004, 43, 3584–3588 CrossRef CAS PubMed.
  22. J. P. Djukic, J. B. Sortais, L. Barloy and M. Pfeffer, Eur. J. Inorg. Chem., 2009, 817–853 CrossRef CAS.
  23. (a) A. J. Deeming, S. N. Jayasuriya, A. J. Arce and Y. D. Sanctis, Organometallics, 1996, 15(2), 786–793 CrossRef CAS; (b) C. Moorlag, O. Clot, M. O. Wolf and B. O. Patrick, Chem. Commun., 2002, 3028–3029 RSC; (c) T. Koizumi, T. Tomon and K. Kanata, Organometallics, 2003, 22, 970 CrossRef CAS; (d) T. Koizumi, T. Tomon and K. Tanaka, J. Organomet. Chem., 2005, 690, 4272–4279 CrossRef CAS; (e) C. Moorlag, M. O. Wolf, C. Bohne and B. O. Patrick, J. Am. Chem. Soc., 2005, 127, 6382–6393 CrossRef CAS PubMed; (f) S. K. Patra and J. K. Bera, Organometallics, 2006, 25, 6054–6060 CrossRef CAS; (g) T. S. Lobana, G. Bawa, A. Castineiras, R. J. Butcher and M. Zeller, Organometallics, 2008, 27, 175–180 CrossRef CAS.
  24. A. Chevallier, The Encyclopedia of Medicinal Plants, London, Dorling Kindersley, 1996 Search PubMed.
  25. (a) E. B. Borthwick, S. J. Connell, D. W. Tudor, D. J. Robins, A. Shneier, C. Abell and J. R. Coggins, Biochem. J., 1995, 305, 521–524 CrossRef CAS PubMed; (b) S. Miyamoto and E. Brochmann-Hanssen, J. Pharm. Sci., 1962, 51, 552–554 CrossRef CAS PubMed.
  26. V. Yasodha, S. Govindarajan, J. N. Low and C. Glidewell, Acta Crystallogr., Sect. C: Cryst. Struct. Commun., 2007, 63, m207–m215 CAS.
  27. A. B. Lago, R. Carballo, N. Fernández-Hermida and E. M. Vázquez-López, CrystEngComm, 2011, 13, 941–951 RSC.
  28. S. W. Ng, S. S. S. Raj, H. K. Fun, A. R. Ibrahim and J. M. Hook, Acta Crystallogr., Sect. C: Cryst. Struct. Commun., 2000, 56, 966–968 Search PubMed.
  29. J. F. Eubank, V. C. Kravtsov and M. Eddaoudi, J. Am. Chem. Soc., 2007, 129, 5820–5821 CrossRef CAS PubMed.
  30. X. X. Zhou, M. S. Liu, X. M. Lin, H. C. Fang, J. Q. Chen, D. Q. Yang and Y. P. Cai, Inorg. Chim. Acta, 2009, 362, 1441–1447 CrossRef CAS.
  31. (a) V. Yasodha, S. Govindarajan, V. Manivannan and O. Buyukajungor, Acta Crystallogr., Sect. E: Struct. Rep. Online, 2007, 63, m2720 CAS; (b) L. Manojlovic-Muir, K. W. Muir, R. A. Campbell, J. E. McKendrick and D. J. Robins, Acta Crystallogr., Sect. C: Cryst. Struct. Commun., 1999, 55, 178–180 Search PubMed; (c) M. Fainerman-Melnikova, J. K. Clegg and R. Codd, Acta Crystallogr., Sect. E: Struct. Rep. Online, 2006, 62, m3582–m3584 CAS; (d) J. C. Chen, Z. Kristallogr. NCS, 2009, 224, 29 CAS.
  32. G. Jaouen, S. Top and A. Vessières, Bioorganometallics, Wiley-VCH, Weinheim, 2006 Search PubMed.
  33. A. B. Lago, R. Carballo, N. Fernández-Hermida and E. M. Vázquez-López, CrystEngComm, 2011, 13, 941 RSC.
  34. M. D. Fryzuk, C. D. Montgomery and S. J. Rettig, Organometallics, 1991, 10, 467–473 CrossRef CAS.
  35. K. R. Flower, M. W. Garrould, L. G. Leal, C. Mangold, P. J. O. Malley and R. G. Pritchard, J. Organomet. Chem., 2008, 693, 408–416 CrossRef CAS.
  36. N. Chitrapriya, V. Mahalingam, M. Zeller and K. Natarajan, Polyhedron, 2008, 27, 1573–1580 CrossRef CAS.
  37. (a) T. Sathiya Kamatchi, N. Chitrapriya, S. K. Kim, F. R. Fronczek and K. Natarajan, Dalton Trans., 2012, 41, 2066–2077 RSC; (b) T. Sathiya Kamatchi, N. Chitrapriya, H. Lee, F. R. Fronczek and K. Natarajan, Eur. J. Med. Chem., 2013, 59, 253–264 CrossRef CAS PubMed.
  38. K. N. Kumar, R. Ramesh and Y. Liu, J. Inorg. Biochem., 2006, 100, 18–26 CrossRef CAS PubMed.
  39. B. G. Tweedy, Phytopathology, 1964, 55, 910–914 Search PubMed.
  40. J. P. Cheng, Q. Y. Lin, R. D. Hu, W. Z. Zhu, H. Q. Li and D. H. Wang, Cent. Eur. J. Chem., 2009, 7, 105 CrossRef CAS.
  41. (a) E. C. Long and J. K. Barton, Acc. Chem. Res., 1990, 23, 271–273 CrossRef CAS; (b) R. F. Pasternack, E. J. Gibbs and J. Villafranca, Biochemistry, 1983, 22, 2406–2414 CrossRef CAS PubMed; (c) E. L. Gelamo, C. H. Silva, H. Imasato and M. Tabak, Biochim. Biophys. Acta, Protein Struct. Mol. Enzymol., 2002, 1594, 84–99 CrossRef CAS.
  42. F. L. Cui, J. Fan, W. Li, Y. C. Fan and Z. D. Hu, J. Pharm. Biomed. Anal., 2004, 34, 189–197 CrossRef CAS PubMed.
  43. K. Yamasaki, T. Maruyama, U. Kragh-Hansen and M. Otagiri, Biochim. Biophys. Acta, Protein Struct. Mol. Enzymol., 1996, 1295, 147–157 CrossRef.
  44. X. M. He and D. C. Carter, Nature, 1992, 358, 209–215 CrossRef CAS PubMed.
  45. I. Sjoholm, B. Ekman, A. Kober, I. Ljungstedt-Pahlman, B. Sieving and T. Sjodin, Mol. Pharmacol., 1979, 16, 767–777 CAS.
  46. N. Ibrahim, H. Ibrahim, S. Kim, J. P. Nallet and F. O. Nepveu, Biomacromolecules, 2010, 11, 3341–3351 CrossRef CAS PubMed.
  47. (a) H. Y. Liu, Z. H. Xu, X. H. Liu, P. X. Xi and Z. Z. Zeng, Chem. Pharm. Bull., 2009, 57, 1237–1242 CrossRef CAS PubMed; (b) Y. Hu, Y. Yang, C. Dai, Y. Liu and X. Xiao, Biomacromolecules, 2010, 11, 106–112 CrossRef CAS PubMed.
  48. A. Sulkowska, J. Mol. Struct., 2002, 614, 227–232 CrossRef CAS.
  49. Y. Wang, H. Zhang, G. Zhang, W. Tao and S. Tang, J. Lumin., 2007, 126, 211–218 CrossRef CAS.
  50. G. Z. Chen, X. Z. Huang, J. G. Xu, Z. B. Wang and Z. Z. Zhang, Method of Fluorescent Analysis, Science Press, Beijing, second edn, 1990, ch. 4, pp. 123–126 Search PubMed.
  51. J. N. Miller, Proc. Anal. Div. Chem. Soc., 1979, 16, 203–208 CAS.
  52. B. Liu, Y. Guo, J. Wang, R. Xu, R. Wang, L. Q. Zhang and Y. N. Xu, J. Lumin., 2010, 130, 1036–1043 CrossRef CAS.
  53. (a) H. L. Huang, Y. J. Liu, C. H. Zeng, J. H. Yao, Z. H. Liang, Z. Z. Li and F. H. Wu, J. Mol. Struct., 2010, 966, 136 CrossRef CAS; (b) Y. J. Liu, C. H. Zeng, Z. H. Liang, J. H. Yao, H. L. Huang, Z. Z. Li and F. H. Wu, Eur. J. Med. Chem., 2010, 45, 3087–3095 CrossRef CAS PubMed; (c) X. L. Hong, H. Li and C. H. Peng, J. Mol. Struct., 2011, 990, 197 CrossRef CAS; (d) Z. Z. Li, Z. H. Liang, H. L. Huang and Y. J. Liu, J. Mol. Struct., 2011, 1001, 36–42 CrossRef CAS; (e) Y. J. Liu, Z. H. Liang, Z. Z. Li, J. H. Yao and H. L. Huang, J. Organomet. Chem., 2011, 696, 2728–2735 CrossRef CAS.
  54. K. Kogure, H. Sassa, K. Abe, K. Kitahara, Y. Sano, H. Kawano, Y. Nakagawa and H. Terada, Biol. Pharm. Bull., 1998, 21, 180–183 CAS.
  55. E. Bonfoco, D. Krainc, M. Ankarcrona, P. Nicotera and S. A. Lipton, Proc. Natl. Acad. Sci. U. S. A., 1995, 92(16), 7162–7166 CrossRef CAS.
  56. C. Legrand, J. M. Bour, C. Jacob, J. Capiaumont, A. Martial, A. Marc, M. Wudtke, G. Kretzmer, C. Demangel, D. Duval and J. Hache, J. Biotechnol., 1992, 25(3), 231–243 CrossRef CAS PubMed.
  57. P. Kalaivani, R. Prabhakaran, P. Poornima, F. Dallemer, K. Vijayalakshmi, V. Vijaya padma and K. Natarajan, Organometallics, 2012, 31, 8323–8332 CrossRef CAS.
  58. A. I. Vogel, Textbook of Practical Organic Chemistry, Longman, London, 5th edn, 1989, p. 268 Search PubMed.
  59. N. Ahmad, J. J. Levison, S. D. Robinson and M. F. Uttley, Inorg. Synth., 1974, 15, 45–64 CAS.
  60. R. A. S. Pelgado, W. Y. Lee, S. R. Choi, Y. Cho and M. J. Jun, Transition Met. Chem., 1991, 16, 241–244 CrossRef.
  61. M. C. Altomare, M. Burla, G. Camalli, C. Cascarano, A. Giacovazzo, A. G. G. Guagliardi, G. Moliterni and R. Polidori, J. Appl. Crystallogr., 1999, 32, 115–119 CrossRef.
  62. G. M. Sheldrick, Acta Crystallogr., Sect. A: Found. Crystallogr., 2008, 64, 112–122 CrossRef CAS PubMed.
  63. L. J. Farrugia, J. Appl. Crystallogr., 1997, 30, 565–566 CrossRef CAS.
  64. C. Perez, M. Pauli and P. Bazerque, Acta Biol. Med. Exp., 1990, 15, 113–115 Search PubMed.
  65. D. Srinivasan, N. Sangeetha, T. Suresh and P. Lakshmana, J. Ethnopharmacol., 2001, 74, 217–220 CrossRef CAS PubMed.
  66. M. S. Blois, Nature, 1958, 29, 1199–1200 CrossRef.
  67. T. Nash, J. Biochem., 1953, 55, 416–421 CrossRef CAS.
  68. L. C. Green, D. A. Wagner, J. Glogowski, P. L. Skipper, J. S. Wishnok and S. R. Tannenbaum, Anal. Biochem., 1982, 126, 131–138 CrossRef CAS PubMed.
  69. R. J. Ruch, S. J. Cheng and J. E. Klaunig, Carcinogenesis, 1989, 10, 1003–1008 CrossRef CAS PubMed.
  70. C. Beauchamp and I. Fridovich, Anal. Biochem., 1971, 44, 276–287 CrossRef CAS PubMed.
  71. T. C. P. Dinis, V. M. C. Madeira and L. M. Almeida, Arch. Biochem. Biophys., 1994, 315, 161–169 CrossRef CAS PubMed.
  72. T. Mossman, J. Immunol. Methods, 1983, 65, 55–63 CrossRef.
  73. W. E. C. Wacker, D. D. Ulmer and B. L. Valee, N. Engl. J. Med., 1956, 255, 449–453 CrossRef CAS.
  74. D. J. Stueher and M. A. Marletta, J. Immunol., 1987, 139, 518–525 Search PubMed.

Footnote

Electronic supplementary information (ESI) available: ORTEP diagram of 3 with hydrogen bonding interaction (Fig. S1). Packing diagram of the unit cell for complex 3: (Fig. S2). Selected bond lengths (Å) and angles (°) for 3 (Table S1). The emission spectra of the DNA–EB system in the presence of H2L and complexes 1–4 (Fig. S3). Synchronous spectra of BSA in the presence of increasing amounts of H2L and complexes 1–4 (Fig. S4). Plausible mechanisms for DPPH radical scavenging activity (Fig. S5). CCDC reference number: 900109 (3). For ESI and crystallographic data in CIF or other electronic format see DOI: 10.1039/c3ra43865a

This journal is © The Royal Society of Chemistry 2014
Click here to see how this site uses Cookies. View our privacy policy here.