From systems biology to systems chemistry: metabolomic procedures enable insight into complex chemical reaction networks in water

Michaël Méret a, Daniel Kopetzkib, Thomas Degenkolbea, Sabrina Kleessena, Zoran Nikoloskia, Verena Tellstroemc, Aiko Barschc, Joachim Kopkaa, Markus Antonietti*b and Lothar Willmitzera
aMax Planck Institute of Molecular Plant Physiology, Potsdam-Golm, D-14476, Germany
bMax Planck Institute of Colloids and Interfaces, Potsdam-Golm, D-14476, Germany. E-mail: markus.antonietti@mpikg.mpg.de
cBruker Daltonik GmbH, Bremen, D-28359, Germany

Received 15th May 2013 , Accepted 6th February 2014

First published on 6th February 2014


Abstract

Metabolomics comprises of the monitoring of small molecules present in a biological system as a function of time and space. Coupled with emerging modeling approaches, it facilitates predictions of reaction sequences. Here, we explore the potential of metabolomic tools for analyzing the complex chemical systems in a model reaction, the hydrothermal reforming (HTR) of glycine. The profiles for more than 20 monitored compounds were used to reconstruct the glycine reaction network. The mechanism of glycine conversion into serine and alanine was validated, where new carbon–carbon (C–C) bonds are formed from the C2-position of glycine. We thus demonstrated that metabolomic methods are useful for the analysis of complex combinatorial problems in chemistry.
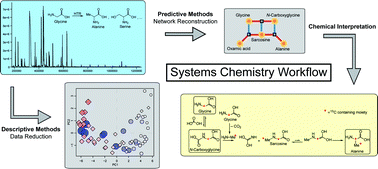

Recent efforts in the field of metabolomics have created novel methods to analyze the complex biochemical reaction networks of living organisms and brought significant understanding. These developments were based on new analytical techniques and bioinformatics procedures for the time-resolved profiling of metabolites. Coupled with emerging modeling approaches, these technologies facilitate predictions of reaction sequences in biochemical systems, which then can be validated by in vivo labeling and isotopic tracing. Interestingly, these developments are, up to now, not applied in the field of classical chemistry. It is therefore promising to translate these approaches to analyze modern combinatorial chemical reaction networks, as they might occur in food processing (“cooking”) or in modern biorefinery schemes. These applications also occur in water and are largely based on biological educts, so the transfer of metabolomics techniques should be straightforward. In metabolomic systems, the system is often quenched to avoid propagation of the reaction schemes. The quench here in the chemical system is done by moving from high temperature hydrothermal conditions to room temperature conditions in fractions of a second, provided by a small volume capillary reactor.

For the illustration of the potential advantages and restrictions, we apply here these tools to the hydrothermal reforming (HTR) of glycine, which is known to result in a large number of biologically relevant intermediates and platform chemicals. Glycine is a simple, abundant and multifunctional chemical which was likely relevant to pre-biotic chemistry.1–3 In evolutionary terms, HTR reactions are discussed as palaeo-chemical reactions that preceded life and that may still be active on Earth, for example, at deep sea hot vents.2,4–7 New insights into glycine HTR may lead to the use of glycine as a reaction modulator of the hydrothermal carbonization of carbohydrates.8–11 HTR, once appropriately understood, is however also expected to enable the green synthesis of valuable chemicals in de novo biorefining schemes.

HTR conditions and analysis of glycine HTR products by 1H-NMR and GC-MS

1% solutions of glycine (1) (Fig. 1) in water were processed at 100 bar using a high pressure continuous flow reactor. Glycine decomposition was 20 ± 1% after 7.16 min and 2.31 min at 180 °C and 250 °C, respectively, i.e. rather fast. HTR products were monitored up to 7.16 min at 180 °C and up to 3.23 min at 250 °C by sampling at 9 or 10 time points starting at 0.40 min (Fig. 2). Reaction products were analyzed by 1H-NMR and GC-MS based profiling. 1H-NMR confirmed for instance the previously reported decarboxylation product methylamine (Fig. S1). Decarboxylation is the main decomposition path of 2-amino acids subjected to HTR conditions.12,13 Methylamine again decomposes into ammonia, methanol, formaldehyde, and CO2/H2CO3 (2). 1H-NMR also identifies the cyclic dimer of glycine, 3,6-dihydropyrazine-2,5-diol (17), verifying the formation of new C–N bonds in parallel to decomposition.12,13 Additional minor glycine HTR products were indicated in the 1H-NMR, but could not be clearly identified. Previous analyses of glycine HTR neither gave the presence of high molecular weight products nor glycine oligomers, other than traces of triglycine.14 Peptides are therefore not formed under these conditions. Glycine oligomers were previously reported after repeated cycles of HTR followed by adiabatic expansion cooling.15 However, these conditions do not apply here.
image file: c3ra42384k-f1.tif
Fig. 1 HTR products of glycine. The chemicals were identified by paired GC-EI-TOF-MS and GC-APCI-TOF-MS. GC-APCI-TOF-MS enabled the unambiguous elucidation of molecular formulas from complex mixtures (Table S1). Structure hypotheses were deduced from molecular formulas and the paired EI-TOF-MS fragmentation spectra.

image file: c3ra42384k-f2.tif
Fig. 2 Descriptive statistical analyses of the glycine HTR system. (A) Accumulation of the glycine HTR products between 0 and 7.16 min at 180 °C and 0–3.23 min at 250 °C. The heatmap shows log2-transformed relative concentrations with respect to t0 (average of 3 replications at each time point). (B) Temporal sequence of glycine HTR product accumulation. The data matrix visualized in (C) was transformed into a Hamming matrix with the color coding indicating a significant (light yellow) or non-significant (red) increase relative to t0. (C and D) Principal component analysis (PCA) of the joined HTR data sets at 180 °C and 250 °C. The scores plot (C) comprised each measured sample with temperature and temporal coding. Analysis of the loadings (D) demonstrated that decomposition of glycine (1) and accumulation of oxamic acid (5) explained the major variance of the early HTR processes. The accumulation of all other products characterizes the later time points.

Our GC-MS analysis resulted in no less than 21 glycine HTR products (Fig. 1, Table S1), exceeding the previously reported set of products.12,13 These encompassed highly diverse structures (Fig. 1) ranging from aromatic and non-aromatic heterocycles (16–22), to amino acids, such as alanine (13) and serine (14), to carboxylic acids, such as glycolic acid (3) and glyoxylic acid (4). In addition, condensation products, such as iminodiacetic acid (7), N-glycylglycine (6), and glycine-N-methylamide (12) could be identified. As described in the ESI,the chemical identity of the HTR products was determined by fast scanning GC-EI-TOF-MS and high mass resolution GC-APCI-TOF-MS. Moreover, glycine isotopomers differentially labeled with stable 13C, 15N or 2D isotopes were used as the starting materials to cross-check the structural analyses (Fig. 1, Table S1, and ESI).

“Metabolomics”: descriptive statistical analysis of the time-resolved chemical profiles

The glycine HTR products appeared rapidly; some reached a constant level, e.g., oxamic acid (5), or declined at later time points, e.g., sarcosine (8) and serine (14), indicating that these compounds were intermediates rather than end products (Fig. 2A).

The first statistical method, hierarchical cluster analysis, separated the HTR products into five distinct clusters. Glycine, as the substrate, was the sole member of cluster 5 (Fig. 2B). Glycolic acid, glyoxylic acid, oxamic acid (3–5), and N-glycylglycine (6) appeared early (cluster 1). Cluster 2 contained the subsequently occurring amino acids alanine (13) and serine (14), as well as the heterocycles hydantoin (16) and four hydroxylated pyrazines (17–20). According to GC-MS and confirmed by NMR, the main glycine HTR product is 3,6-dihydropyrazine-2,5-diol (17).

The time pattern of (17) was in agreement with a previously proposed reaction path via the early intermediate N-glycylglycine (6).13 3,6-Dihydropyrazine-2,3,5-triol (19) represents a mixed dimer of glycine and either glyoxylic (4) or oxamic acid (5), both members of the early cluster 1. Cluster 3 contained a third dihydropyrazine, 3-methyl-3,6-dihydropyrazine-2,5-diol (21), which can be interpreted as a mixed dimer of glycine (1) and alanine (13), which appeared after the preceding accumulation of alanine. The presence of pairs of pyrazines/dihydropyrazines, namely (17)/(18), (19)/(20), and possibly (21)/(22) (Fig. 1, Table S1) indicated the existence of a dehydrogenation reaction which irreversibly transformed the dihydro-dimers into the more stable aromatic structures.

It is interesting to note that the observed pyrazines are positional isomers of pyrimidines, the biologically relevant nucleobases. The presence of uracil, 5,6-dihydrouracil, thymine or 5,6-dihydrothymine, can however be ruled out. Cluster 3 included in addition, iminodiacetic acid (7), sarcosine (8), and glycineamide (11) which represented potential alternative condensation and decarboxylation products of glycine. Cluster 4 contained glycine-N-methylamide (12), a decarboxylation product of N-glycylglycine (6). The remaining constituents of cluster 4 indicated the gradual increase of CO2/H2CO3 (2) which is generated by decarboxylation reactions. The N-carboxyamines (9), (10), (15) represented reversible products of amines with CO2/H2CO3 (2).

The second statistical method applied to complex data sets is “principal component analysis” (PCA), a method for dimension reduction. Subjecting the joined kinetic data sets (i.e. the reactions taking place at 180 °C and 250 °C) to a PCA, we find that the reactions performed at 180 °C and 250 °C follow the same trajectories, with the reaction at 180 °C just trailing behind the reaction at 250 °C. Therefore, HTR at the two temperatures runs very similarly, with the 250 °C experiments only being faster. The principal components PC1 and PC2 explain 77% and 7% of the total variance, respectively. The decomposition of glycine (1) and the accumulation of oxamic acid (5) explain the major variance of the early HTR process (Fig. 2D).

Correlation-based network approaches

Advanced statistical techniques must be applied to identify more detailed associations among reaction products. Systems biology uses network approaches for the global investigation of measured features. Nodes of such networks represent compounds, while edges denote weighted associations between compounds. These are often defined by similarity measures calculated from the corresponding chemical profiles (Fig. 2A). While these correlation-networks can identify associations between pairs of metabolites, they cannot infer substrate–product relationships.

Applying a simple Spearman correlation to the time-resolved profiles did not allow us to identify associations between the products (Fig. S2A and B). Thus, in a second step, the first-order partial correlations for the network construction were applied. This approach is applied to remove spurious secondary correlations16,17 and can thus identify the concerted appearance or consumption of compounds. In chemistry, the statistical associations found in this network imply that the respective compounds are common products of a single reaction or are linked by sequential reactions. For instance, 3,6-dihydropyrazine-2,5-diol (17) and pyrazine-2,5-diol (18), and 3,6-dihydropyrazine-2,3,5-triol (19) and pyrazine-2,3,5-triol (20) are correlated (ESI Results, Fig. S2C and D), which means that they form simultaneously or in a direct cascade.

Usually, simple correlation-based approaches consider the association of compounds across the full monitored time interval. Here, we found at least two different phases of the glycine HTR system (Fig. 2), i.e., early processes, predominantly seen in the 180 °C kinetic series, and late processes, more active in the 250 °C time series (Fig. 2C). The resulting two networks for the glycine HTR were strikingly different. Only a single edge, namely between N-glycylglycine (6) and glycolic acid (3), is shared between the two networks, indicating that this product pair is relevant in both the early and late phase of the glycine HTR system. While the 180 °C network was composed of single paths, the 250 °C HTR network contains locally dense regions (ESI Results, Fig. S2A–D). This means that the complexity found is created in the later stages of the reaction.

Analysis of glycine HTR by the reversed engineering of reaction networks

We then used the time-resolved profiles to extract so-called bipartite networks with two types of nodes, representing compounds and reactions (Scheme 1). As correlation-based approaches neglect the observed temporal data dependence, we reconstructed networks for each local time interval. Log-transformed ratios of the replicate profiles from each time point were subjected to robust constrained-regression with each compound treated as a dependent variable.18 The statistically significant relationships detected through cross-validation were interpreted as reactions involving more than two compounds, i.e. bimolecular reactions creating at least one product. Compounds entering the regression with coefficients of same sign, indicated with the same edge color (Scheme 1), can be interpreted either as common substrates or as common products of the reaction. To start, we used the set of identified structures and assumed the presence of known HTR products of glycine, namely methylamine, methanol, formaldehyde and ammonia (Fig. 1), which then allowed interpretation of the elaborated reaction networks in chemical terms (Scheme 1). For example, the reaction network reconstructed for the second time point (t2) at 180 °C represents the formation of N-glycylglycine (6) from two glycine molecules (1) by the reaction with water. Glycine (1) is alternatively added to carbonic acid to build N-carboxyglycine (9). Since both reactions are reversible, the network at t2 can be interpreted as an equilibrium between the three chemical species. The reaction models at later time points were more complex but all were in agreement with plausible chemical reactions (ESI, Schemes S1–S9).
image file: c3ra42384k-s1.tif
Scheme 1 Reconstructed reaction networks from the data at (A) t2 = 0.60 min and (B) t7 = 3.58 min of the 180 °C HTR together with the interpretation in terms of a chemical reaction network. The reconstructed networks were comprised of reaction nodes (gray) and compound nodes (orange), which were linked by edges that indicated the compounds participation on the same side of the reaction. The positional label information indicated by red asterisks was in agreement with the positional labeling obtained from HTR of 1-13C-glycine and 2-13C-glycine (ESI Results, Fig. S3).

At t4, the reconstructed reaction network indicated that iminodiacetic acid (7) was formed from two molecules of glycine (1) by the loss of NH3 (ESI Results, Scheme S1). Sarcosine (8) and glycine-N-methylamide (12) resulted from the condensation of glycine (1) and methylamine. The equilibrium between the previously formed (Scheme 1A, t2) N-carboxyglycine (9), and glycine (1) was displaced in favor of the dimerization of two glycine molecules to 3,6-dihydropyrazine-2,5 diol (17). This compound was then dehydrogenated to the thermodynamically stable aromatic compound pyrazine-2,5-diol (18).

Generation of other amino acids

The unexpected formation of new C–C bonds (Scheme 1B) interestingly led to the appearance of two natural amino acids, alanine (13) and serine (14). The numerical models indicate that these amino acids are generated via several steps. By subjecting the positional labeled 1-13C-glycine and 2-13C-glycine to HTR, one can demonstrate that the carbon atoms at the C3-position of serine (14) and of alanine (13) originate from the C2-position of glycine. The C-atom of the N-methyl moiety of sarcosine (8) is also derived from the C2-position of glycine. In addition, we synthesized aminomalonic acid and ruled out the possibility that N-carboxyglycine (9) rearranges from the N-carboxyl- into a C-carboxyl-isomer. Therefore, it is safe to say that the formation of new C–C bonds during glycine HTR occurs via the coupling of two C2-positions (ESI Results, Fig. S3).

Conclusion

Chemical, time-resolved profiles of complex chemical systems and reaction networks can be analyzed by the numerical tools of metabolomics, which allows the construction of self-consistent hypothetical reaction schemes. Among the various metabolomics tools, we presented the applications of hierarchical cluster analysis, principal component analysis, correlation based network approaches, and the reverse engineering of reaction networks. Each technique resulted in relevant, complementary information, which finally provides a clear view of the ongoing chemical processes.

Systems chemistry, as we suggest calling this approach in analogy to systems biology, can improve our insights into reaction cascades or just detrimental side reactions causing yield limitations. However, the observation of (at a given set of conditions) spurious side products and the analysis of the path of their formation can point to new possible reaction schemes, and in the case of food chemistry, these side products can define taste and value. Most importantly, systems chemistry approaches might enable the analysis and finally, the understanding of highly complex chemistry involving reactions of multiple substrates and mechanisms occurring at the same time.

Acknowledgements

We kindly acknowledge funding by the ERC and the Max Planck Society.

References

  1. N. Goldman, E. J. Reed, L. E. Fried, I. F. W. Kuo and A. Maiti, Nat. Chem., 2010, 2, 949–954 CrossRef CAS PubMed.
  2. E. Imai, H. Honda, K. Hatori, A. Brack and K. Matsuno, Science, 1999, 283, 831–833 CrossRef CAS.
  3. S. Pizzarello, L. B. Williams, J. Lehman, G. P. Holland and J. L. Yarger, Proc. Natl. Acad. Sci. U. S. A., 2011, 108, 4303–4306 CrossRef CAS PubMed.
  4. A. Eschenmoser, Tetrahedron, 2007, 63, 12821–12843 CrossRef CAS PubMed.
  5. R. Furuuchi, E. I. Imai, H. Honda, K. Hatori and K. Matsuno, Origins Life Evol. Biospheres, 2005, 35, 333–343 CrossRef CAS PubMed.
  6. C. Huber and G. Wächtershäuser, Science, 2006, 314, 630–632 CrossRef CAS PubMed.
  7. K. H. Lemke, R. J. Rosenbauer and D. K. Bird, Astrobiology, 2009, 9, 141–146 CrossRef CAS PubMed.
  8. A. A. Peterson, R. P. Lachance and J. W. Tester, Ind. Eng. Chem. Res., 2010, 49, 2107–2117 CrossRef CAS.
  9. A. A. Peterson, F. Vogel, R. P. Lachance, M. Fröling, M. J. Antal and J. W. Tester, Energy Environ. Sci., 2008, 1, 32–65 CAS.
  10. B. Hu, K. Wang, L. Wu, S. Yu, M. Antonietti and M. M. Titirici, Adv. Mater., 2010, 22, 813–828 CrossRef CAS PubMed.
  11. M. M. Titirici, M. Antonietti and N. Baccile, Green Chem., 2008, 10, 1204–1212 RSC.
  12. J. S. Cox and T. M. Seward, Geochim. Cosmochim. Acta, 2007, 71, 2264–2284 CrossRef CAS PubMed.
  13. D. Klingler, J. Berg and H. Vogel, J. Supercrit. Fluids, 2007, 43, 112–119 CrossRef CAS PubMed.
  14. D. K. Alargov, S. Deguchi, K. Tsujii and K. Horikoshi, Origins Life Evol. Biospheres, 2002, 32, 1–12 CrossRef CAS.
  15. Y. Futamura, K. Fujioka and K. Yamamoto, J. Mater. Sci., 2008, 43, 2442–2446 CrossRef CAS PubMed.
  16. A. Arkin and J. Ross, J. Phys. Chem., 1995, 99, 970–979 CrossRef CAS.
  17. A. de la Fuente, N. Bing, I. Hoeschele and P. Mendes, Bioinformatics, 2004, 20, 3565–3574 CrossRef CAS PubMed.
  18. R. Tibshirani, J. Roy. Stat. Soc. B Stat. Meth., 1996, 58, 267–288 Search PubMed.

Footnotes

Electronic supplementary information (ESI) available: Methods, supplementary results. See DOI: 10.1039/c3ra42384k
Contributed equally.

This journal is © The Royal Society of Chemistry 2014