Lithium ion electrochemical insertion in vanadium pentoxide/cucurbit[6]uril intercalates†
Francisco de Araújo
Silva
,
Fritz
Huguenin
,
Silvânia Marilene
de Lima
and
Grégoire Jean-François
Demets
*
Laboratório de Materiais e Interfaces Moleculares, DQ-FFCLRP Universidade de São Paulo, Av Bandeirantes 3900 CEP 14040-901, Ribeirão Preto, S.P., Brazil. E-mail: greg@usp.br; Web: http://www.lmim.org Fax: +55 16 36024861; Tel: +55 16 36024860
First published on 5th June 2014
Abstract
Cucurbit[6]uril (CB[6]) and its complex with VO2+ (CB[6]VO) were intercalated into lamellar vanadium pentoxide in several proportions, generating a series of hybrid pillarised intercalates in the form of xerogel films. These different guests dramatically affect Li+ insertion/expulsion from the composites during redox processes. Our results show that CB[6] has little effect or may even impair charge compensation by Li+, while CB[6]VO exerts the opposite effect, enhancing this process when compared to pure vanadium pentoxide. This is clear evidence that CB[6] binds these ions retaining them in the bulk structure, and when the oculi are blocked by VO2+ ions, the macrocycle acts as a non-coordinating pillar in the structure favoring ion traffic, and charge compensation processes become easier. Specific charge capacities for pure vanadium pentoxide, CB[6] and CB[6]VO intercalates correspond to 158, 168 and 230 mA h g−1 respectively.
1. Introduction
The size, weight, chemical inertness and price of Li+ ions makes them the ideal electrolytes for several electric/electronic devices such as primary and secondary batteries, and electrochromic windows as well. Lithium batteries are maybe the best alternative for creating light-weighted, high-throughput accumulator devices and thousands of different cathode/anode/electrolyte materials combinations using these ions have been studied during the last decades, always aiming for performance improvement.1–19 Cathode materials for lithium batteries have to overcome several issues, such as high price, low charge density and memory effect to cite a few, in order to be eligible for commercial applications. A very useful and common candidate for cathodes in such batteries is vanadium pentoxide (V2O5·nH2O), which can be prepared as a lamellar solid by drying its gels known as vanadium pentoxide xerogels (or VXG). The main advantage of VXGs is their good electrical conductivity, along with the ease of preparation and low cost. VXG conductivity may be explained by the existence of V(V/IV) oxidation states in the structure, which undergo electron hopping upon polarization like many other mixed valence compounds. The global redox state of the oxide may be changed chemically or electrochemically, and in the last case, cations are needed to maintain electroneutrality during reduction. These cations are released again when the V(IV) centers are oxidized (eqn (1)). Small cations enter and leave the oxide according to the global charge of the matrix through the interlamellar gap but they occupy specific sites in the oxide structure.| V(V)2O5 + e− + Li+ ↔ Li+⊂V(IV)2O5 | (1) |
VXG matrices display two distinct Li+ intercalation sites, involving different labilities. Li+ ions are frequently retained irreversibly in the oxide structure during oxidation due to structural stress or rearrangements. This phenomenon is evident after electrochemical conditioning of VXG, when the chemical reversibility of lithium insertion/expulsion is drastically reduced. The process may also be observed during spectroelectrochemical measurements and, in practice, that means that VXG storage capacity in Li+ batteries diminishes too.2,20 The lamellar domains may vary in extension, since turbostratic order is frequently affected and reduced by intercalation/expulsion of several kinds of guest species. The lack of long-range turbostratic coherence may lead to oxides containing almost amorphous domains connecting lamellar ones and affecting considerably its electrochemical characteristics. Foreign chemical species may help Li+ traffic through the interlamellar gaps during charge/discharge processes by creating clearer paths for fast charge compensation or maintaining a more rigid structure, avoiding rearrangements that would lead to other phases than the lamellar one.21–27 A more rigid structure may also reduce Li+ entrapment by sterical barriers, enhancing charge/discharge cyclability in a lithium battery. This principle was already demonstrated by Wang and coworkers28–30 in α-Fe2O3 and Co3O4 multi-shelled hollow microsphere anodes. Pillaring guest species may do so, but they are generally too large, and they reduce 001 interlamellar electron hopping efficiency, thus reducing the global conductivity of the matrix. Cucurbit[6]uril (CB[6]) is a toroidal hollow macrocycle made of 6 glycoluril units held together by methylene bridges. Its hydrophobic cavity is delimited by two identical portals, made of 6 oxygens each. These oxygen atoms act as Lewis bases for hard Pearson acids as well as hydrogen bond acceptors towards several inclusion guest species, ammonium salts and metallic cations in general.31,32 During its synthesis, many homologues are formed, ranging from CB[5] up to CB[10] (CB[9] was not isolated), which have the same structure except for the number of glycoluril units in the macrocycles. In spite of being the most abundant species, it is quite difficult to work with CB[6] due to solubility issues.
Recently, our group proved that it is possible to intercalate and remove cucurbit[6 or 7]uril molecules from the interlamellar gap of lamellar double hydroxides (LDH).33 In these hydroxides, cucurbit[6]uril acts as a pillar, maintaining its portals parallel to the lamellae of the matrix, supporting its structure, expanding the gap, and avoiding its expansion or contraction, favoring the circulation of small chemical species.
This time we intercalated CB[6] in VXG matrices to verify whether a similar pillar effect took place, and to assess whether this would help the Li+ flux inside this oxide during the redox cycles or not. Another similar species, its vanadyl complex,34 was also intercalated in VXG in order to estimate the influence of the portals in this process, since in this case they would not be available for Li+ complexation (see Fig. 1).
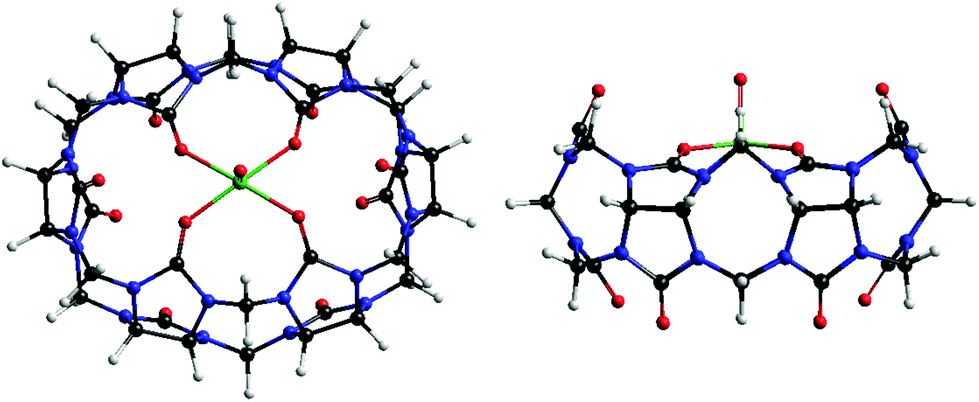 | ||
| Fig. 1 Molecular structure of [VO(CB[6])]2+, O in red, C in black, N in blue, V in green and H in white. | ||
2. Experimental section
V2O5 xerogels were prepared by sol–gel process according to the procedure described elsewhere.35,36 500 cm3 of a 0.1 mol dm−3 NH4VO3 solution were percolated through 50 mL of Dowex-2x ion-exchange resin. The eluted solution turned into a gel after 7 days at R.T. Cucurbit[6]uril (CB[6]) was prepared and purified in our lab according to the procedure described by Day and coworkers.37 CB[6]/vanadyl complex [VO(CB[6])]2+ (CB[6]VO) was synthesized in our lab, as we reported in a previous paper.34 Several CB[6] and CB[6]VO amounts (1, 5, 7, and 10 mol% (single vanadium, not V2O5) for CB[6] and 1 mol% for CB[6]VO for solubility/stability reasons) were mixed with 30-days-old V2O5 gels (10 cm3) under ultrasound for 1 hour followed by magnetic stirring for 24 hours. The gel mixtures were dried at R.T. leaving homogeneous orange xerogels. X-ray powder diffraction patterns (XRD) were recorded at R.T. on a Siemens 5005 diffractometer using Cu Kα radiation, (λ = 1.54 Å), from 5° < 2θ < 70° scanning at 0.02° s−1. Scanning electron microscopy (SEM) images were taken on a Zeiss model EVO 50 scanning electron microscope after sputtering gold over the samples. Fourier transform infrared (FTIR) spectra were obtained in KBr pellets on an ABB BOMEN MB-100 spectrophotometer. Thermogravimetric (TG) curves were recorded on a TG/DSC SDT2960 equipment, in synthetic air atmosphere. Atomic force microscopy images (AFM) were obtained on a Shimadzu SPM 9600 microscope. Electrochemical experiments were carried out on a μ Autolab III potentiostat using a conventional three electrode cell (electrolyte: 0.1 mol dm−3 LiClO4 in acetonitrile; counter electrode: 8 cm2 Pt sheet; ref electrode: Ag/AgNO3/acetonitrile, 0.503 V vs. SHE. Working electrodes: 1 cm2 F2-doped thin oxide glass electrodes (FTO) R < 20 Ω modified with the xerogels by dip coating). V2O5 mass films was estimated by UV-vis spectrophotometry after digestion of the samples and complexation in hydrogen peroxide 0.003 mol dm−3 and H2SO4 0.2 mol dm−3.14,38 All experiments were repeated at least 3 times.3. Results
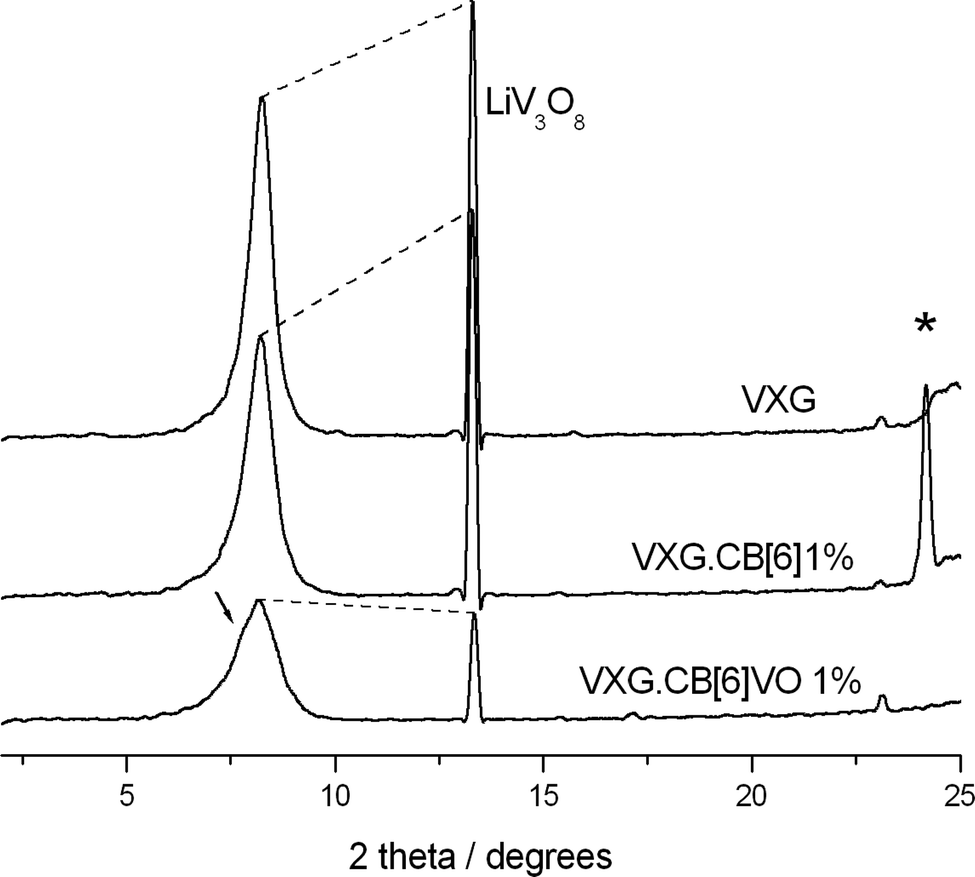
XRD patterns reveal that the lamellar structure of VXG is preserved for all the samples but the turbostratic order decreases with increasing guest species content, as one can observe comparing peak intensities and widths in Fig. 2. VXG may be regarded as a mesomorphous material, in which lamellar domains are interconnected by an amorphous V2O5 phase. The long-range order may vary from one xerogel to another, (turbostratic order) and it usually decreases upon intercalation of guest chemical species in the interlamellar gap and around the lamellar crystallites, as mentioned before. The basal plane distances increase from 11.2 Å for pure VXG, which is typical from this kind of film,39,40 to 15.5 Å when CB[6] is intercalated. These values are compatible with the insertion of a large uncharged guest species, which is held by water molecules in the structure, just as in the case of HDL intercalates.33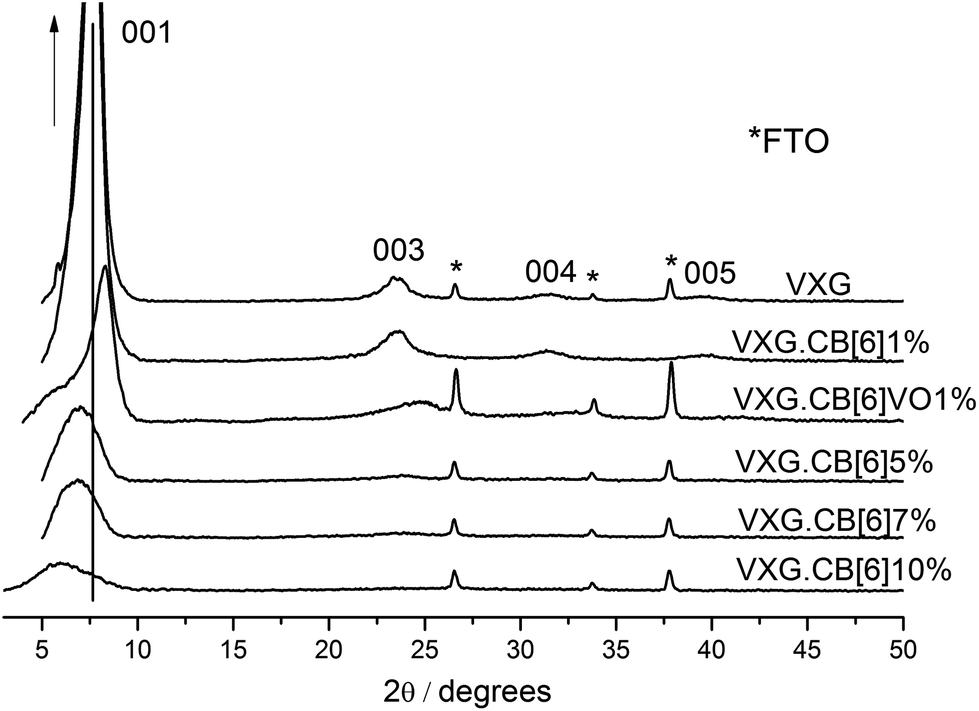 | ||
| Fig. 2 XRD patterns (λ Cu Kα = 1.54 Å) of pure VXG and CB[6] (1, 5, 7 and 10%) and CB[6]VO1% intercalates. | ||
Another important feature is the peak splitting of the d(001) diffraction signal. It is split in two after intercalation for VXG.CB[6]VO1% and VXG.CB[6]10%: one corresponding to the expanded phase around 15.5 Å and a second one, which remains almost unchanged around 11.4 Å (see Fig. 2). These distances may be explained in terms of the staging process, or the coexistence of two distinct lamellar phases.
The vibrational spectra† of the intercalates show all the characteristic bands of V2O5 and CB[6] or CB[6]VO. V–O–V stretch mode is visible at 520 cm−1, as is the band at 765 cm−1, associated to VO5 pyramid bonds stretching, and also at 1010 cm−1 which is assigned to the V![[double bond, length as m-dash]](https://www.rsc.org/images/entities/char_e001.gif) O stretching mode.14,41 Six typical CB[6] bands are also visible at 1730 cm−1 (ν CO), 1639 cm−1 (ν C–N), 1442 cm−1 (ν C–N), 1417 cm−1, 1376 cm−1 and 1322 cm−1 (unassigned).42 When comparing the spectra of the CB[6] and CB[6]VO intercalates, one will observe a considerable broadening of the VO stretching band (980 cm−1) and a slight shift of the CO band to higher wavenumbers.34 Considering these data, together with the XRD information, we can confirm the presence of the macrocycles in the oxides in the form of intercalates.
O stretching mode.14,41 Six typical CB[6] bands are also visible at 1730 cm−1 (ν CO), 1639 cm−1 (ν C–N), 1442 cm−1 (ν C–N), 1417 cm−1, 1376 cm−1 and 1322 cm−1 (unassigned).42 When comparing the spectra of the CB[6] and CB[6]VO intercalates, one will observe a considerable broadening of the VO stretching band (980 cm−1) and a slight shift of the CO band to higher wavenumbers.34 Considering these data, together with the XRD information, we can confirm the presence of the macrocycles in the oxides in the form of intercalates.
The thermogravimetric curve† for pure V2O5 shows three weight losses; the first between 20 °C and 115 °C, assigned to interlamellar water loss; the second until 280 °C, which corresponds to intralamellar water loss; and the third, up to 350 °C, associated to vanadium pentoxide dehydration, when new water molecules are formed as a thermal decomposition product.43 The thermal behavior of intercalated CB[6] and CB[6]VO is very similar to pure CB[6]. The organic phase decomposes around 300 °C and the weight losses are proportional to the quantity of CB[6] in the xerogels.44 Using these data we could calculate the intercalates formulae which range from CB[6]0.02⊂V2O5·2H2O to CB[6]0.18⊂V2O5·4H2O and CB[6]VO0.0222+⊂V2O5·2.2H2O for the CB[6]VO intercalate.
SEM images† of the 3 films over FTO electrodes, one of pure VXG (0.08 mg), a second of VXG.CB[6]1% (0.076 mg) and a third, made of VXG.CB[6]VO1% (0.056 mg), reveal foliated morphologies for all of them and their thicknesses correspond to 400, 450 and 115 nm respectively. Considering the guest species represent only 1% of this, one can assume this mass is mainly V2O5·nH2O. In terms of μm per gram of vanadium pentoxide, this represents 5, 5.9 and 2.0 μm g−1 respectively. Rugosity also increases in the same order, as it was measured with AFM.† The rugosity parameter, Rz, was found to be 144.950 nm for VXG, 158.459 nm for VXG.CB[6]1%, and 194.476 nm for VXG.CB[6]VO1%.
During voltammetry (see Fig. 3), VXG and VXG.CB[6]1% behaved in a similar way, once the electrochemical conditioning process (reported previously3) is clearly visible. The oxidation and reduction waves are gradually reduced and broadened until stabilization, after 40 voltammetric cycles. The peak separation also increases after this process, indicating increasing overpotentials. These features are consequences of the matrix swelling and the saturation of Li+ irreversible coordination sites. This is very common for most VXG modified electrodes and may be explained by structural stress induced by Li+ ions insertion in the matrix. During electrochemical cycles, Li+ ions will also enter the amorphous regions of the xerogel which traps them, forming crystalline LiV3O8.45 This phase will affect the electrochemical behavior of the intercalation matrix. An unexpected feature, however, is observed with VXG.CB[6]VO1%. During the first 40 voltammetric cycles, the oxidation and reduction processes become clearer and more intense, leading to a more defined voltammogram. It is exactly the opposite process: the matrix rearranges itself and the redox process becomes easier, reflecting a more efficient charge compensation process after successive reduction/oxidation cycles.
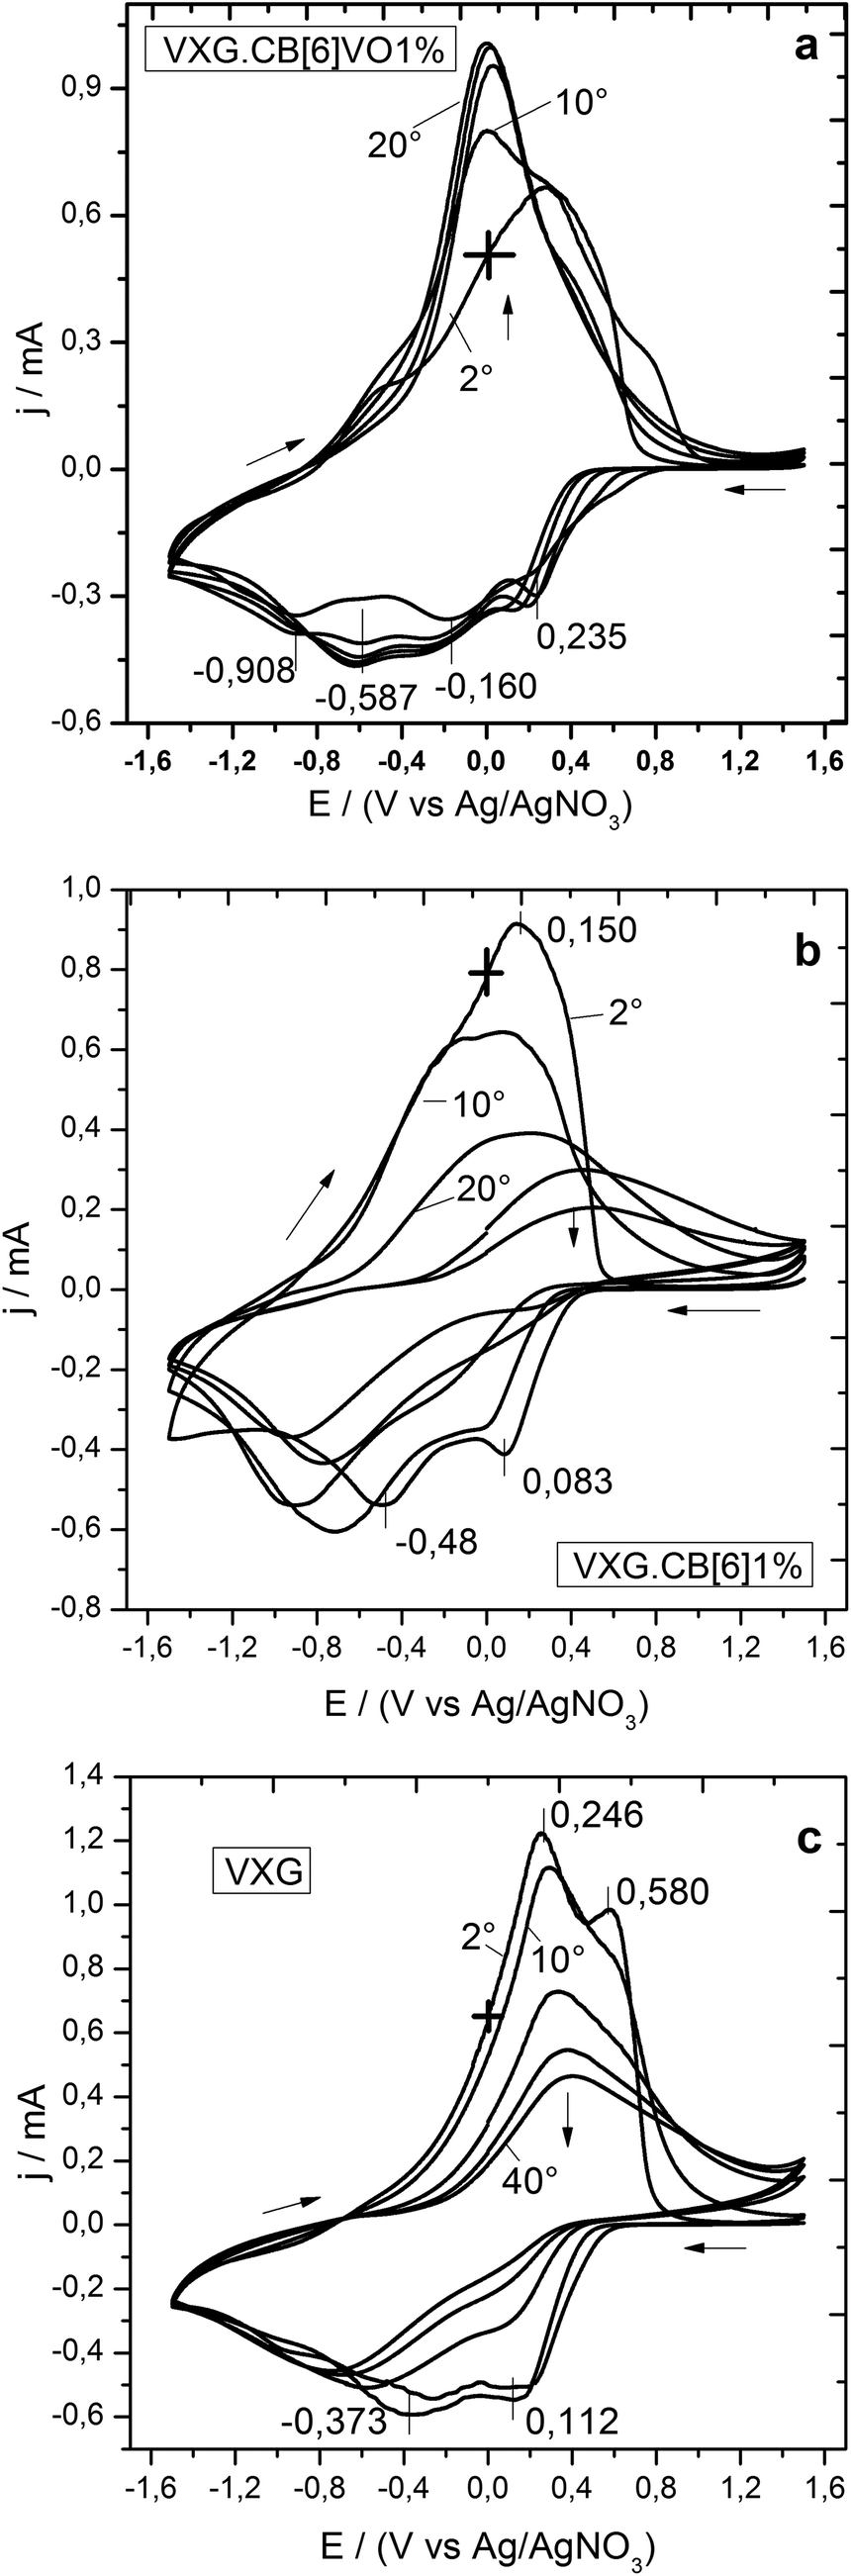 | ||
| Fig. 3 Voltammograms of VXG.CB[6]VO1%, VXG.CB[6]1%, and pure VXG (after 2, 10, 20, 30 and 40 cycles at 20 mV s−1). | ||
Integration of the anodic charge can be used to calculate the amount of Li+ ions leaving the oxide, and conversely, Li+ uptake can be measured by integrating the cathodic charge from chronopotentiometry. Fig. 4 shows the charges during the electrochemical cycles in three different ways. The first one reports the charge ratios of the nth cycle, compared to the first one (Qn/Q1). The second reports the anodic and cathodic charges during these cycles and the third plots the residues (Qanodic − Qcathodic). These calculations were realized for pure VXG and its intercalates with VXG.CB[6]1% and VXG.CB[6]VO1% and the results were normalized by the VXG mass for all the samples. Calculating the difference between anodic and cathodic charges during the cycles (Fig. 3b) one could measure the tendency of Li+ ions to be retained in the structure. If the residue is negative, some ions would remain trapped in the structure mainly in the amorphous regions of the solid, while a positive residue would show that extra positive charge is leaving the structure during the process.
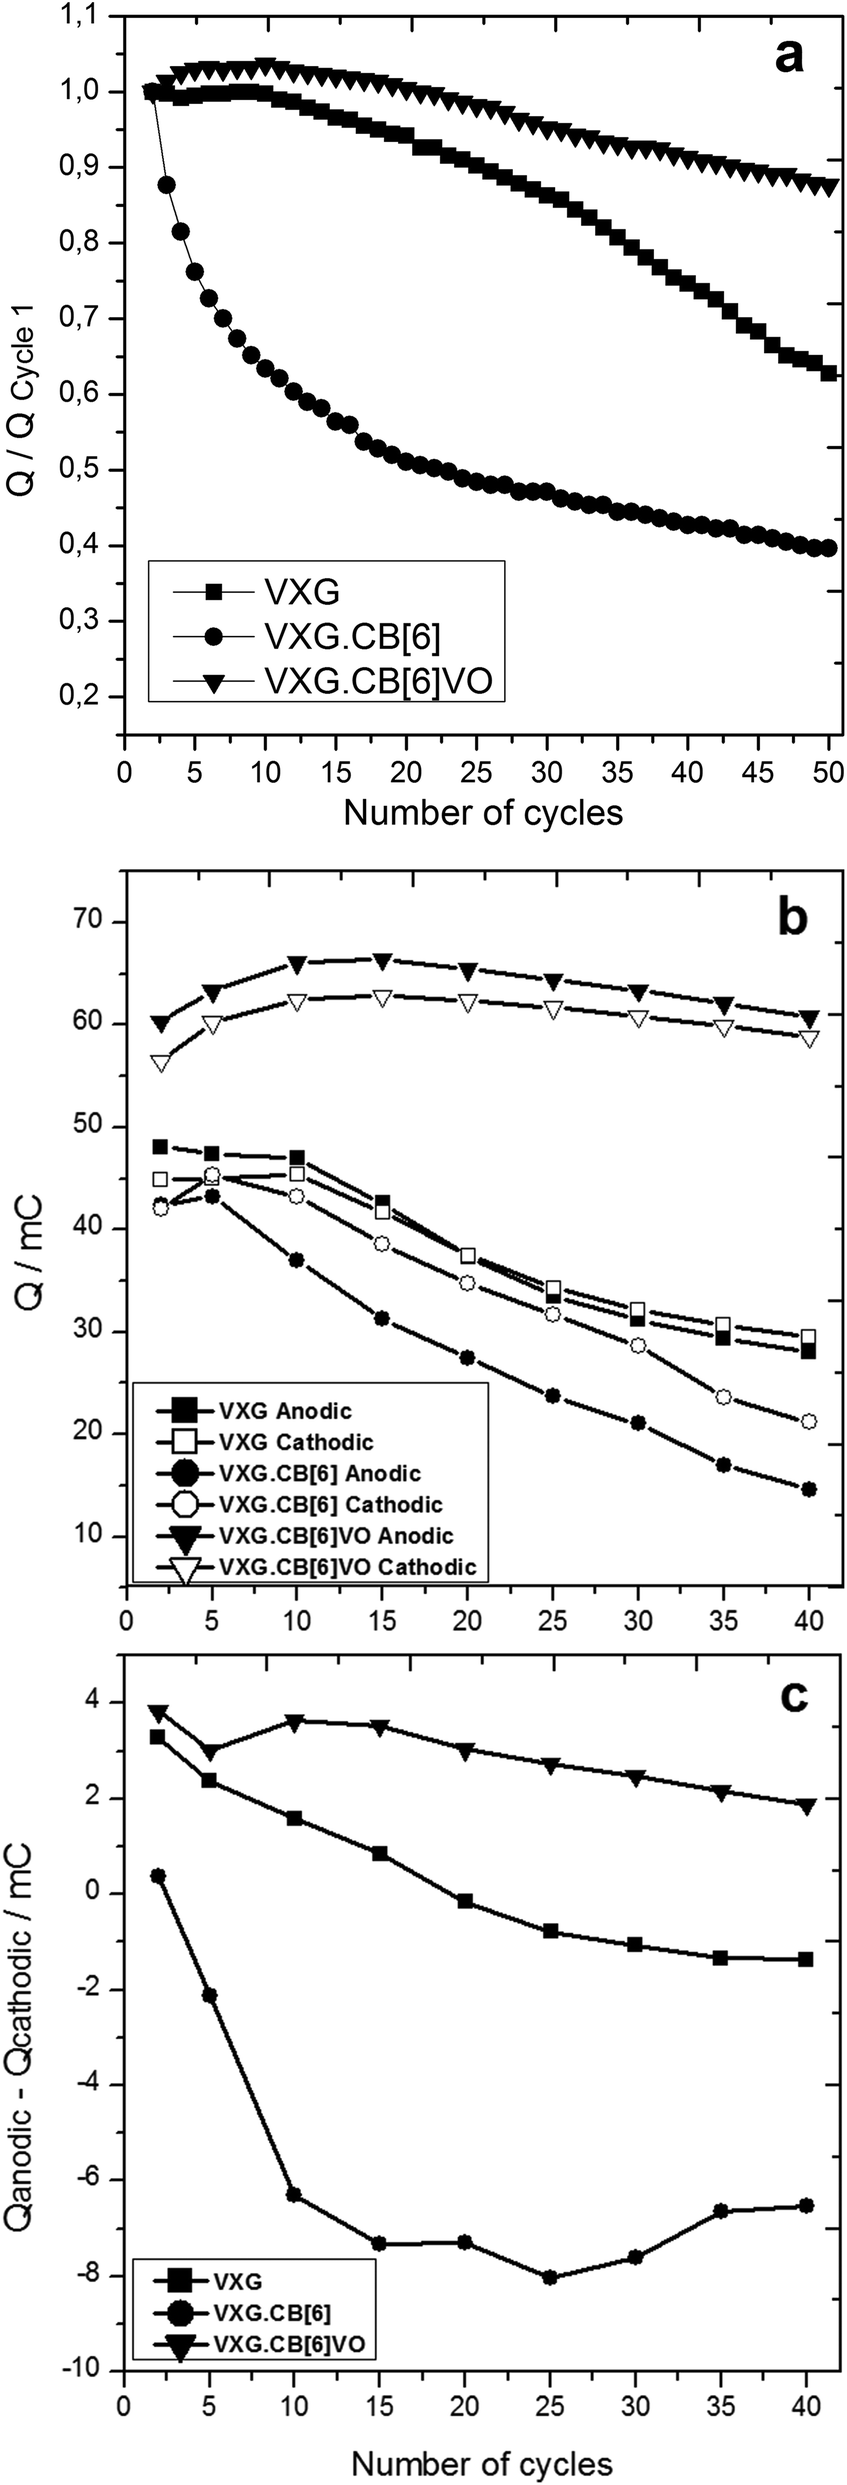 | ||
| Fig. 4 (a) Charge variation during the first 50 cycles compared to the first cycle (Qn/Q1), with i = 0.2 mA, (b) Anodic and cathodic charges for VXG, VXG.CB[6]1%, and VXG.CB[6]VO1% normalized by the oxide mass, obtained by integration of the voltammetric curves (from 1.5 to −1.5 V at 20 mV s−1; 40 cycles). (c) Anodic–cathodic charge differences (residues) for the same samples. | ||
Analysing the residues for the intercalates, it is clear that pure VXG displays practically no residue, lying close to zero. This situation changes after 40 cycles, and the residue becomes negative indicating cation retention in the structure. Comparing it with VXG.CB[6]1%, it is evident that Li+ ions are getting stuck in the oxide since the very beginning of the electrochemical cycle and this is why the cathodic/anodic charge drops down so fast. In the case of VXG.CB[6]VO1%, the situation is the opposite: the residue is positive, tending to 0 after longer periods meaning that other ions than Li+ (maybe protons or sulphate ions) may be involved in the charge/discharge process, at least during the initial cycles. Among these samples, VXG.CB[6]VO1% displayed the highest charges when compared to the others as one can see in Fig. 4 and 6. The presence of CB[6] alone in the intercalate impairs the charge/discharge process and this is very clear in Fig. 4 top, where one can see a very fast charge capacity drop even if the amounts of Li+ involved are comparable to pure VXG.
XRD measurements were repeated after 40 electrochemical cycles and we could observe that the lamellar phases are still present in the composites and a new phase appears too (Fig. 5). The peak at 2θ = 13.2 degrees corresponding to LiV3O8 (100) is present in all the samples, but in different proportions. The ratios between 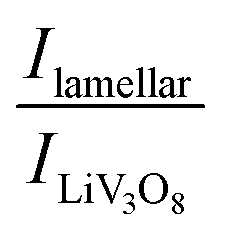 serve as a comparative measure of the relative proportion of both lamellar and LiV3O8 phases, corresponding to 0.66, 0.78 and 1.12 for VXG.CB[6]1%, VXG, and VXG.CB[6]VO1% respectively. An intense peak also appears at 2θ = 24.1 degrees for VXG.CB[6]1% which is probably the (003) peak of LiV3O8. Staged structure was maintained for VXG.CB[6]VO1% only. Lithium uptake and specific capacities were calculated more accurately from potentiometric measurements, for different cathodic currents during the first electrochemical cycles (cutoff points from +1.5 V to −1.5 V, Fig. 6). Here again, it is clear that lithium uptake efficiency and specific charge of VXG.CB[6]VO1% are much superior than for the other two intercalates. The amount of Li+ per V2O5 unit in VXG.CB[6]VO1% is almost 1.55, much higher than 1.08 for pure VXG and 1.15 for VXG.CB[6] at 0.05 mA.
 | ||
| Fig. 5 XRD patterns for the films after 40 electrochemical cycles, showing the presence of LiV3O8 phase, and a new one in the case of VXG.CB[6]1% (*). | ||
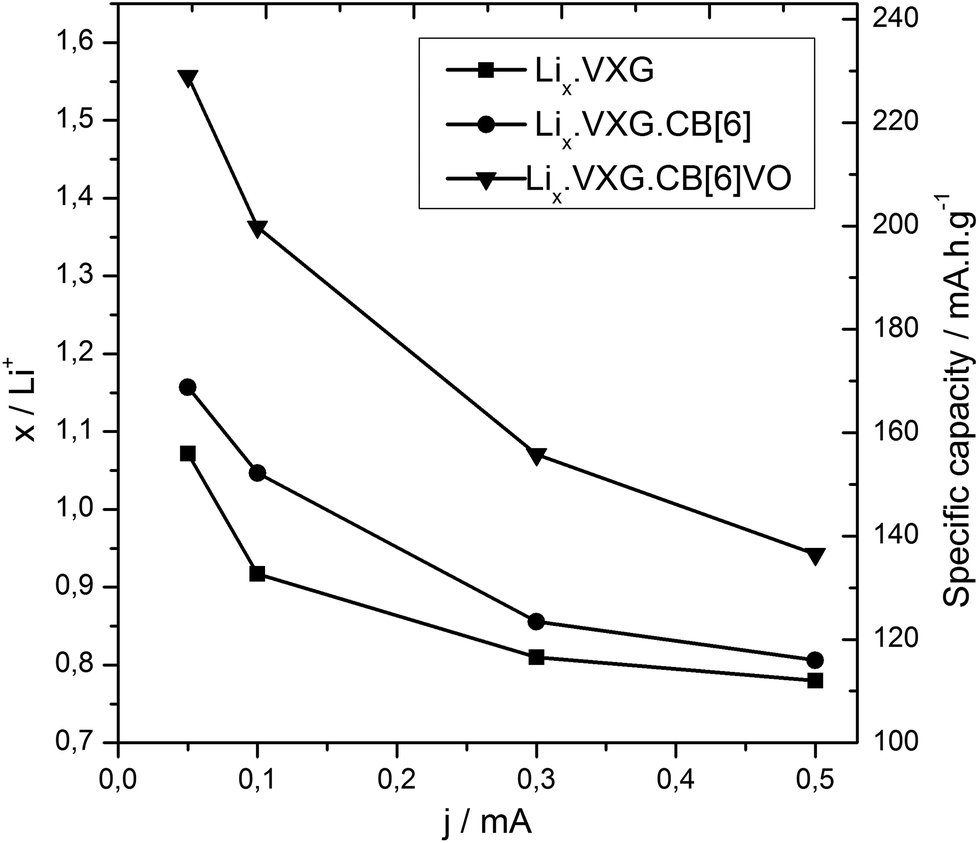 | ||
| Fig. 6 Lithium ion uptake (xLi) and specific capacity as a function of cathodic current density (discharge) from chronopotentiometry data (cutoff pot. +1.5 V to −1.5 V). | ||
The specific capacity of the VXG.CB[6]VO1% intercalate is around 230 mA h g−1, 45% more than pure VXG (158 mA h g−1), and VXG.CB[6] (168 mA h g−1). VXG.CB[6]VO1% intercalates are also more durable, maintaining 87% of their initial charge capacity after 50 cycles at 0.2 mA. With free CB[6] this charge capacity is around 40%, which is even lower than pure VXG (63%, see Fig. 4 top).
We have estimated Li+ diffusion coefficients into the intercalates using the Galvanostatic Intermittent Titration Technique (GITT) after 2 electrochemical cycles and after 20 cycles.46,47
Diffusion coefficients range from 10−15 to 10−11 according to GITT measurements for all intercalates. VXG and VXG.CB[6]1% start from values around 10−11 cm s−1 at the beginning of the electrochemical cycle, while the VXG.CB[6]VO1% diffusion coefficient is 2 orders of magnitude smaller, around 10−14 cm s−1 (Fig. 7 top). After 20 cycles this situation changes considerably: the VXG diffusion coefficient falls to 10−12 cm s−1 (one order of magnitude), VXG.CB[6]1% falls to 10−15–10−14 cm s−1 (2 to 3 orders of magnitude), while VXG.CB[6]VO1% increases slightly (10−13 cm s−1).
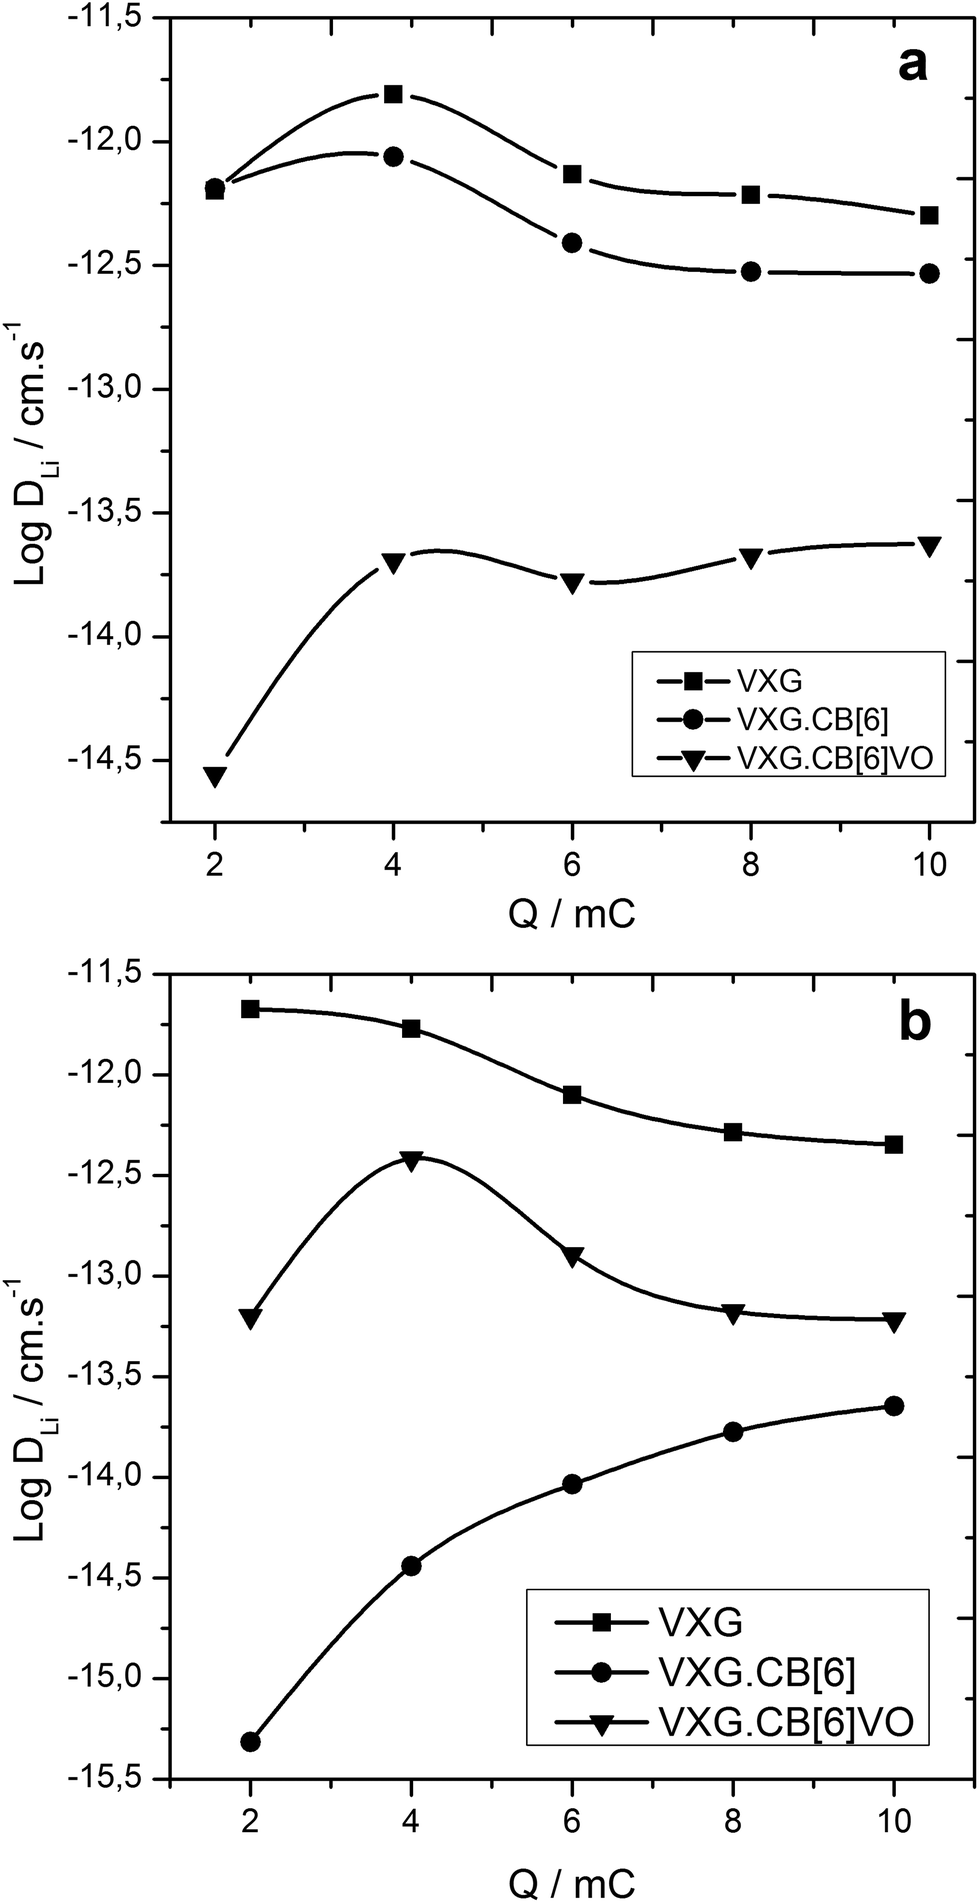 | ||
| Fig. 7 Log of Li+ diffusion coefficient as a function of the imposed charge for the intercalates. Top: after 2 cycles, bottom: after 20 cycles. | ||
To analyze the electrochemical steps associated with the lithium ion electro-insertion and to determine the rate constants and diffusion coefficient, we conducted electrochemical impedance spectroscopy measurements. Fig. 8 shows the Nyquist diagrams for the VXG, VXG.CB[6], and VXG.CB[6]VO films at −0.2 V.
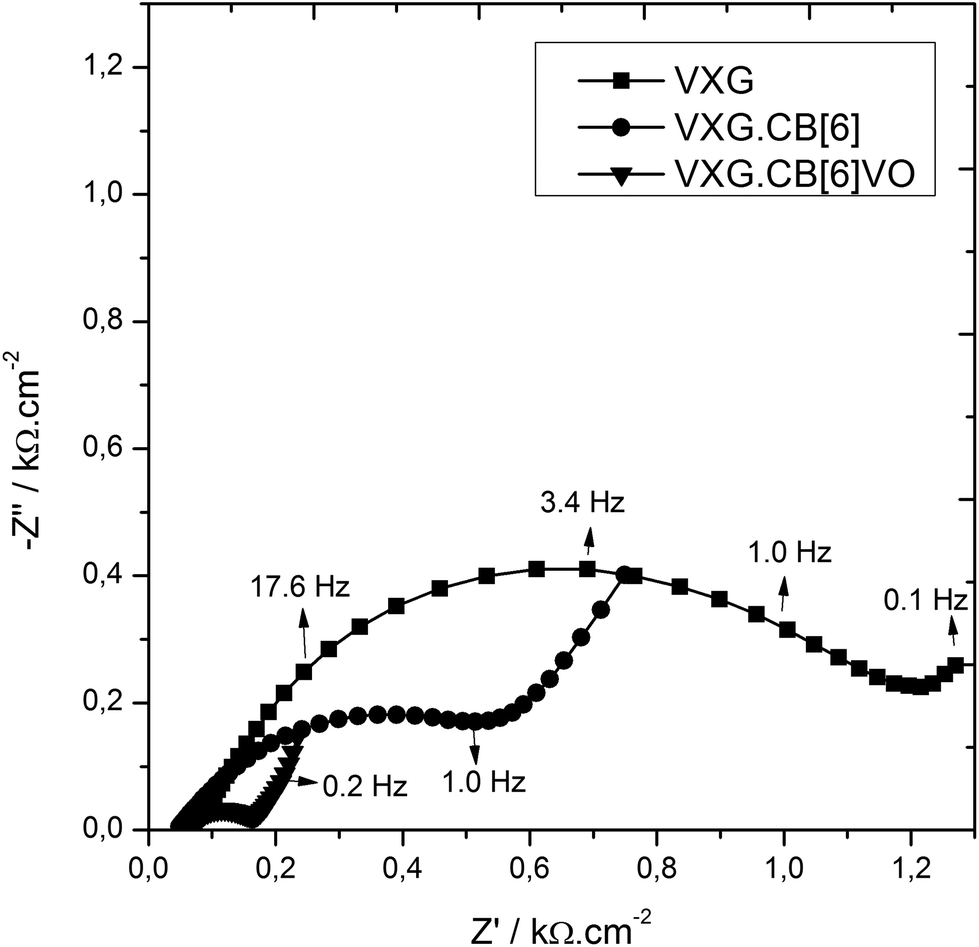 | ||
| Fig. 8 Nyquist diagrams for the VXG (squares), VXG.CB[6]1% (circles), and VXG.CB[6]VO1% (triangles) films at −0.2 V. | ||
The semicircle observed at high frequencies results from charge transfer at the electrode–electrolyte interface, associated to the Li+ electroinsertion in parallel with an electrical double layer capacitance. Considering that the electron mobility is higher than for Li+, there is an accumulation of lithium ions and electrons at this interface, which diffuse together to maintain the electroneutrality. This diffusion process is observed at low frequencies. On the basis of the electrochemical processes mentioned above, we propose the following electroreduction mechanism:
| Li+ + e−→(Li+,e−)i | (2) |
| (Li+,e−)i→(Li+,e−)s | (3) |
Eqn (2) and (3) indicate the lithium ion transfer at the electrolytic solution–electrode interface at V2O5 sites, which generates the (Li+,e−)i lithium ion–electron pair. Eqn (4) represents the semi-infinite diffusion process of these charge carriers, where the species (Li+,e−)s corresponds to the pair into the host matrix. According to Butler–Volmers equation, the oscillating component of the current density (ĩ) is expressed as48
 | (4) |
 | (5) |
![[V with combining macron]](https://www.rsc.org/images/entities/i_char_0056_0304.gif) is the interfacial potential, Ṽ is the potential perturbation,
is the interfacial potential, Ṽ is the potential perturbation, ![[c with combining tilde]](https://www.rsc.org/images/entities/i_char_0063_0303.gif) Li,0 is the lithium ion concentration in the steady-state at the interface (y = 0), Li,0 is the oscillating component of this concentration, and DLi is the lithium ion diffusion coefficient. The analytical solution of these equations is
Li,0 is the lithium ion concentration in the steady-state at the interface (y = 0), Li,0 is the oscillating component of this concentration, and DLi is the lithium ion diffusion coefficient. The analytical solution of these equations is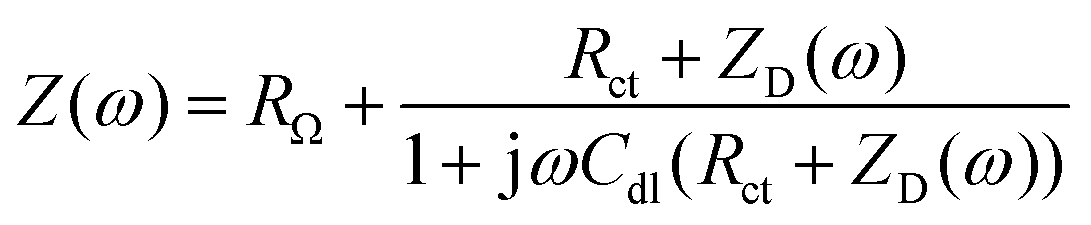 | (6) |
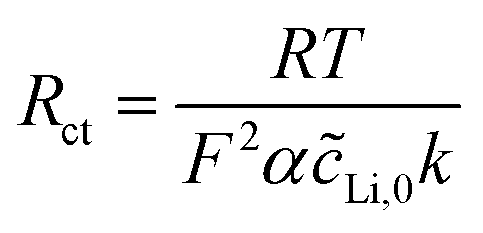 | (7) |
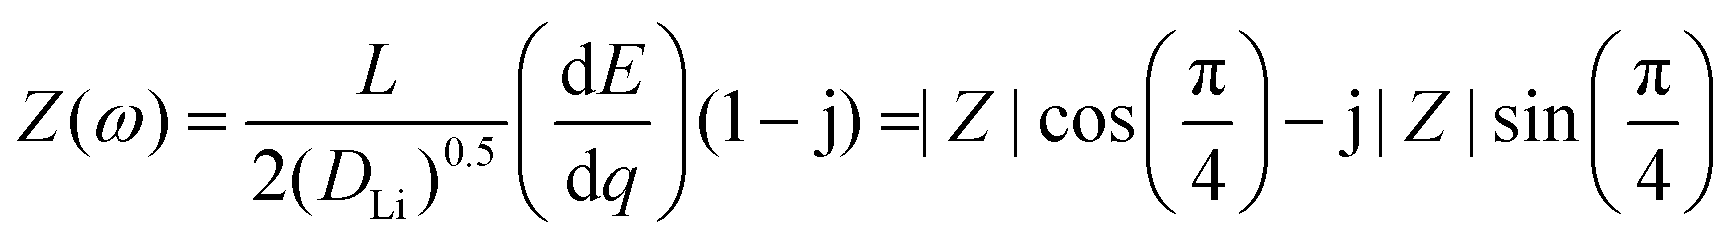 | (8) |
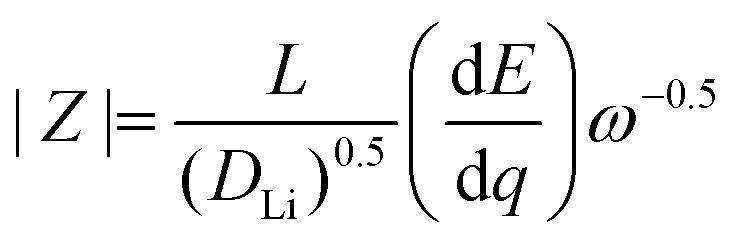 | (9) |
All these important differences in the electrochemical behavior of such intercalates may be explained by several reasons.
After several cycles, the charge capacity of such systems change in different ways and this is related to the formation of LiV3O8 since their charge capacity (after 40 cycles) is proportional to the amount of lamellar VXG. CB[6] is a hard Pearson base, and for this reason it forms complexes with alkali metal ions such as Li+. In spite of its vertical position inside the lamellae, the pillared structure will probably involve water at the portals linking the macrocycles to the oxide structure, as it does in lamellar double hydroxides.33 Once Li+ enters the structure, it is very probable that it will bind CB[6] portals, forming complexes, which are stabilized by the chelate effect.49 These complexes would irreversibly hold Li+ ions in the structure or favor the formation of LiV3O8 somehow. This is particularly visible when higher amounts of CB[6] are intercalated in VXG, causing the charge capacity to drop proportionally to the macrocycle content.† The second reason is intimately related to the first, once high Li+ amounts in the structure create a strong coulombic barrier for free cations,25 and LiV3O8 traps Li+ irreversibly.
When VO2+ is present at one of the portals, it blocks it, and impairs the coordination of a second cation by intramolecular electrostatic repulsion, thus maintaining the pillared structure without trapping Li+ ions. It is still hard to understand why this effect is so intense, even with just 1% of guest species in the intercalates, and it is evident that more than one process is occurring. CB[6]VO2+ however is a charged species and its presence leads to a much more compact oxide structure, as we could notice after calculating the film density. Such dense films would prevent solvent entrance in the oxide, especially at the electrode–electrolyte interface justifying low diffusion coefficients at the beginning of the electrochemical cycles. As the structure breathes during this process, lithium diffusion gets better, and its diffusion coefficient is enhanced, always preserving the lamellar structure of the oxide to the detriment of LiV3O8 formation.
4. Conclusions
We have demonstrated for the first time that it is possible to prepare CB[6]⊂V2O5·nH2O intercalates in several proportions, generating staged lamellar materials. It is also possible to intercalate CB[6]VO2+ in this oxide, but in smaller quantities due to solubility issues. The lamellar structure is maintained in all cases, and there is evidence that the two sorts of lamellar domains coexist in the same material at least for the intercalate with CB[6]VO2+.(CB[6]VO)2+⊂V2O5·nH2O generates much more compact xerogels than the other materials and the reasons for this remain unknown, but it does affect Li+ charge and discharge positively during electrochemical reduction/oxidation of the oxide matrix by impairing the formation of LiV3O8, and avoiding Li+ retention in the interlamellar gap. It enhances lithium ion uptake, specific charge, and composites stability, maintaining all the other characteristics of V2O5. CB[6] alone prevents Li+ flux in the matrix presumably by complexation and facilitates the formation of LiV3O8.
Acknowledgements
The authors thank NAPMI from Universidade de São Paulo (Núcleo de Apoio à Pesquisa-Materiais Inteligentes) and CAPES for financial support.References
- G. J. F. Demets, F. J. Anaissi, H. E. Toma and M. B. A. Fontes, Mater. Res. Bull., 2002, 37, 683–695 CrossRef CAS.
- G. J. F. Demets, F. J. Anaissi and H. E. Toma, Electrochim. Acta, 2000, 46, 547–554 CrossRef CAS.
- F. J. Anaissi, G. J. F. Demets, H. E. Toma and A. C. V. Coelho, J. Electroanal. Chem., 1999, 464, 48–53 CrossRef CAS.
- F. J. Anaissi, G. J. F. Demets and H. E. Toma, Electrochem. Commun., 1999, 1, 332–335 CrossRef CAS.
- F. J. Anaissi, G. J. F. Demets, E. B. Alvarez, M. J. Politi and H. E. Toma, Electrochim. Acta, 2001, 47, 441–450 CrossRef CAS.
- F. J. Anaissi, G. J. F. Demets, R. A. Timm and H. E. Toma, Mater. Sci. Eng., A, 2003, 347, 374–381 CrossRef.
- F. Huguenin, M. T. do Prado Gambardella, R. M. Torresi, S. I. C. de Torresi and D. A. Buttry, J. Electrochem. Soc., 2000, 147, 2437–2444 CrossRef CAS PubMed.
- F. Huguenin, R. M. Torresi and D. A. Buttry, J. Electrochem. Soc., 2002, 149, 546–553 CrossRef PubMed.
- F. Huguenin and R. M. Torresi, J. Braz. Chem. Soc., 2003, 14, 536–543 CrossRef CAS PubMed.
- F. Huguenin, D. S. dos Santos Jr., A. Bassi, F. C. Nart and J. O. N. Oliveira, Adv. Funct. Mater., 2004, 14, 985–991 CrossRef CAS.
- F. Huguenin, M. Ferreira, V. Zucolotto, F. C. Nart, R. M. Torresi, J. Osvaldo and N. Oliveira, Chem. Mater., 2004, 16, 2293–2299 CrossRef CAS.
- F. Huguenin and R. M. Torresi, Quim. Nova, 2004, 27, 393–398 CrossRef CAS PubMed.
- H. Varela, F. Huguenin, M. Malta and R. M. Torresi, Quim. Nova, 2002, 25, 287–299 CrossRef CAS PubMed.
- N. A. Galiote, M. N. L. Camargo, R. M. Lost, F. Crespilho and F. Huguenin, Langmuir, 2011, 27, 12209–12217 CrossRef CAS PubMed.
- J. Livage, Chem. Mater., 1991, 3, 578–593 CrossRef CAS.
- P. G. Bruce, B. Scrosati and J.-M. Tarascon, Angew. Chem., Int. Ed., 2008, 47, 2930–2946 CrossRef CAS PubMed.
- M. S. Whittingham, Chem. Rev., 2004, 104, 4271–4301 CrossRef CAS.
- N. A. Chernova, M. Roppolo, A. C. Dillon and M. S. Whittingham, J. Mater. Chem., 2009, 19, 2526–2552 RSC.
- J. M. Tarascon and M. Armand, Nature, 2001, 414, 359–367 CrossRef CAS PubMed.
- M. Hibino and T. Kudo, Hyomen, 1998, 36, 45–53 Search PubMed.
- H. P. Oliveira, Ph.D., Universidade de São Paulo, 1994.
- E. Meulenkamp, W. van Klinken and A. Schlatmann, Solid State Ionics, 1999, 126, 235–244 CrossRef CAS.
- Y. Sato, T. Asada, H. Tokugawa and K. Kobayakawa, J. Power Sources, 1997, 68, 674–679 CrossRef CAS.
- N. Kumagai, K. Tanno, T. Nakajima and N. Watanabe, Electrochim. Acta, 1983, 28, 17–22 CrossRef CAS.
- R. Baddour, J. Pereira-Ramos, R. Messina and J. Perichon, J. Electroanal. Chem., 1991, 314, 81–101 CrossRef CAS.
- S. Hub, A. Tranchant and R. Messina, Electrochim. Acta, 1988, 33, 997 CrossRef CAS.
- C. Cartier, A. Tranchant, M. Verdaguer, R. Messina and H. Dexpert, Electrochim. Acta, 1990, 35, 889 CrossRef CAS.
- S. Xu, C. M. Hessel, H. Ren, R. Yu, Q. Jin, M. Yang, H. Zhao and D. Wang, Energy Environ. Sci., 2014, 7, 632–637 CAS.
- J. Wang, N. Yang, H. Tang, Z. Dong, Q. Jin, M. Yang, D. Kisailus, H. Zhao, Z. Tang and D. Wang, Angew. Chem., Int. Ed., 2013, 52, 6417–6420 CrossRef CAS PubMed.
- X. Lai, J. E. Halpert and D. Wang, Energy Environ. Sci., 2012, 5, 5604–5618 CAS.
- G. J. F. Demets, Quim. Nova, 2007, 30, 1313–1322 CrossRef CAS PubMed.
- E. Masson, X. Ling, R. Joseph, L. Kyeremeh-Mensah and X. Lu, RSC Adv., 2012, 2, 1213–1247 RSC.
- L. F. S. da Silva, G. J. F. Demets, C. Taviot-Guého, F. Leroux and J. B. Valim, Chem. Mater., 2011, 23, 1350–1352 CrossRef.
- S. M. de Lima, J. A. Gómez, V. P. Barros, G. de S. Vertuan, M. das Dores Assis, C. F. de Oliveira Graeff and G. J. F. Demets, Polyhedron, 2010, 29, 3008–3013 CrossRef CAS PubMed.
- J. Lemerle, L. Nejem and J. Lefebvre, J. Inorg. Nucl. Chem., 1980, 42, 17–20 CrossRef CAS.
- N. Gharbi, C. Sanchez, J. Livage, J. Lemerle, L. Nejem and J. Lefebvre, Inorg. Chem., 1982, 21, 2758–2765 CrossRef CAS.
- A. Day, A. P. Arnold, R. J. Blanch and B. Snushall, J. Org. Chem., 2001, 66, 8094–8100 CrossRef CAS PubMed.
- A. M. Almuaibed and A. Townsheud, Fresenius Z. Anal. Chem., 1989, 335, 905–909 CrossRef CAS.
- Y. J. Liu, J. L. Schindler, D. C. DeGroot, C. R. Kannerwurf, W. Hirpo and M. G. Kanatzidis, Chem. Mater., 1996, 8, 525–534 CrossRef CAS.
- J.-J. Legendre, P. Aldebert, N. Baffier and J. Livage, J. Colloid Interface Sci., 1982, 94, 84–89 CrossRef.
- L. Abello, E. Husson, Y. Repelin and G. Lucazeau, J. Solid State Chem., 1985, 56, 379–389 CrossRef CAS.
- G. J. F. Demets, B. V. S. Schneider, H. D. Correia, R. R. Gonçalves, T. M. Nobre and M. E. D. Zaniquelli, J. Nanosci. Nanotechnol., 2008, 8, 432–435 CrossRef CAS PubMed.
- E. Potiron, A. L. G. L. Salle, A. Verbaere, Y. Piffard and D. Guyomard, Electrochim. Acta, 1999, 45, 197–214 CrossRef CAS.
- P. Germain, J. Létoffé, M. Merlin and H.-J. Buschmann, Thermochim. Acta, 1998, 315, 87–92 CrossRef CAS.
- D. Sun, G. Jin, H. Wang, X. Huang, Y. Ren, J. Jiang, H. He and Y. Tang, J. Mater. Chem. A, 2014, 2, 8009–8016 CAS.
- A. R. Rezende, M. A. Bizeto, V. R. L. Constantino and F. Huguenin, J. Phys. Chem. C, 2009, 113, 10868–10876 CAS.
- W. Weppner and R. A. Huggins, J. Electrochem. Soc., 1977, 124, 1569–1578 CrossRef CAS PubMed.
- M. Orazem and B. Tribollet, Electrochemical Impedance Spectroscopy, John Wiley and Sons, 2008 Search PubMed.
- F. Pichierri, J. Chem. Soc., Dalton Trans., 2013, 42, 6083–6091 RSC.
Footnote |
| † Electronic supplementary information (ESI) available: FTIR and TGA analyses, AFM and SEM images, electrochemical data for the 5, 7 and 10% intercalates. See DOI: 10.1039/c4qi00069b |
| This journal is © the Partner Organisations 2014 |