 Open Access Article
Creative Commons Attribution 3.0 Unported Licence
Surface modification of silicone via colloidal deposition of amphiphilic block copolymers†
Ghislaine
Robert-Nicoud
a,
Roberto
Donno
a,
Christopher J.
Cadman
b,
Morgan R.
Alexander
c and
Nicola
Tirelli
*ad
aInstitute of Inflammation and Repair/School of Medicine, University of Manchester, Oxford Road, Manchester, M13 9PT, UK. E-mail: nicola.tirelli@manchester.ac.uk; Fax: +44 (0)161 275 23 96; Tel: +44 (0)161 275 24 80
bSchool of Pharmacy, University of Manchester, Oxford Road, Manchester, M13 9PT, UK
cSchool of Pharmacy, University of Nottingham, University Park, Nottingham, NG7 2RD, UK
dSchool of Materials, University of Manchester, Oxford Road, Manchester, M13 9PT, UK
First published on 7th August 2014
Abstract
We report here on a method to functionalize silicone surfaces, which is based on the deposition of silicone-containing amphiphilic block copolymers from a colloidal water–ethanol dispersion. Using cross-linked silicones (Sylgard 184) as substrates, copolymers composed of two poly(glycerol monomethacrylate) (PGMMA) terminal blocks and a central poly(dimethylsiloxane) (PDMS) block can be effectively deposited when the PDMS content is ≥46 wt%. (≥65 mol%); the deposition provides smooth and stable surfaces, which significantly affected the protein adsorption behaviour of the substrate, suggesting a possible application in biomaterial coating. In air, the block copolymer surface films underwent a reorganization, which differs from the classical hydrophobic recovery of silicones and may be related to a disordered folding of lamellar structures. This led to a predominant surface coverage by thin, possibly monomolecular layers, which displayed a non-restructuring polar surface. However, as a consequence of the reorganization also larger aggregates were produced, albeit in relatively small numbers; these aggregates underwent a progressive hydrophobization (in this case a hydrophobic recovery) and probably dominated the contact angle behaviour of the material. In summary, the colloidal deposition of amphiphilic silicone-based block copolymers successfully modifies the surface properties of silicone substrates; however, attention must paid to reorganization phenomena in order to maximize the stability of the coating.
Introduction
Silicone (poly(dimethylsiloxane), PDMS) artefacts are often employed for biomedical use in the form of medical devices1 such as intraocular lenses,2 urinary catheters3 and breast implants,4 but also microfluidic constructs;5 in their application they are often in contact with biological fluids, and the ensuing surface adsorption of proteins may lead to undesired outcomes, which in vivo can take the form of foreign body capsular reactions or of phenomena of platelet adhesion/activation.6,7 Another disadvantage of PDMS surfaces is the possibility of bacterial attachment, leading to the formation of biofilms, which are among the first promoters of chronic infections.3,8 Not surprisingly, much research aims to modify the surface behavior of silicones to improve their biomedical performance; for example, the fight against biofilms has led to the development of materials inherently resistant to bacterial attachment.9,10 Alternatively, the biomaterial can be modified only at its surface, without altering its bulk properties. For example, protein-repellent and biocompatible groups have been introduced on PDMS surfaces with a number of macromolecular structures, which include poly(ethylene glycol) (PEG),11–17 poly(2-methacryloyloxyethyl phosphorylcholine),18–20 poly(3-sulfopropyl methacrylate),21 poly(N-vinylpyrrolidone)22 and poly(2-hydroxyethyl methacrylate).23 Here, we have focused on a different hydrophilic structure that provides the advantageous combination of abundance of groups for chemical functionalization and the potential of a “stealth” behaviour: poly(2,3-dihydroxypropyl methacrylate), more commonly referred to as poly(glycerol monomethacrylate) (PGMMA), which features two vicinal alcohols on each repeating unit. While this diol group provides ease of functionalization, for example with pharmacologically active compounds,24 PGMMA-based hydrogels25–30 and surface layers28 have been shown to be non-toxic, protein-repellent, and non-cell-adhesive.As for the functionalization, we have discarded the covalent attachment, either in a “grafted to”11,17 or in a “grafted from” (surface initiated polymerization)12,14,16,18,20–23 approach; as a common point, they would have required the introduction of reactive (polar) groups on the PDMS surface, whose reproducibility is typically marred by phenomena of hydrophobic recovery,31,32 with the migration of the polar groups into the PDMS bulk. Physical methods offer milder and less laborious conditions; some of them involve components that migrate to the surface or to the bulk depending on the exposure of the material to water or air, e.g. amphiphilic PDMS block copolymers,15,19 or Pluronic F127 dissolved in the PDMS bulk.33 Using a similar concept, i.e. the minimization of PDMS surface energy through a phase-segregated hydrophilic layer, amphiphilic polymers may be deposited only on the surface, thus avoiding the long-range morphological changes of a swelling–deswelling process.13,20 A well-known example of the latter approach is the adsorption of pluronic polymers from micellar dispersions, which has been applied to a variety of hydrophobic surfaces34,35 and, in particular, has been shown to increase the surface lubricity of silicone in a water environment.36
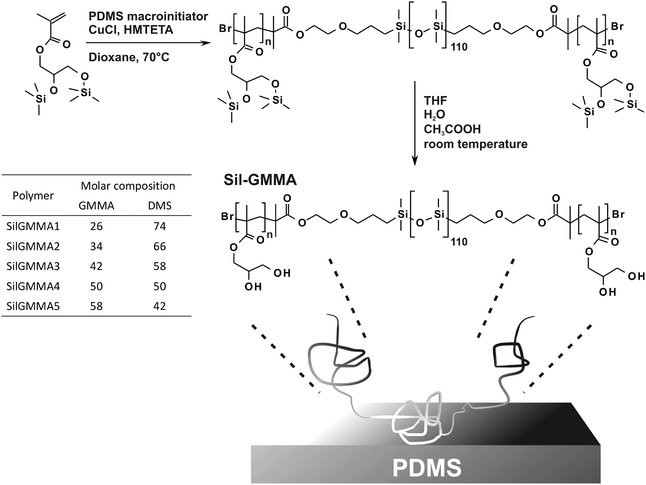
Here, we have followed the same general approach, employing ABA amphiphilic triblock copolymers; in order to increase the stability of the surface anchorage we have used PDMS as the central hydrophobic block, while using PGMMA for the terminal blocks. These polymers are hereafter referred to as Sil-GMMAs (Scheme 1) and were produced via ATRP of protected GMMA initiated by a bifunctional PDMS macroinitiator37 to yield hydrophilic blocks of different lengths: their size, by influencing the exposure of the hydrophobic block and the curvature of the hydrophobe/water interface, should arguably be a major determinant of the physisorption efficiency.
Experimental section
Materials
A silicone elastomer kit (Sylgard 184, Dow Corning) was purchased from Elsworth Adhesives Ltd (Glasgow, UK). Bovine plasma fibrinogen Type I-S (BPF), bovine serum albumin (BSA), copper(I) chloride, dimethyl sulfoxide (DMSO), fluorescamine, hexamethyltriethylenetetramine (HMTETA), and sodium dodecyl sulphate (SDS) were purchased from Sigma-Aldrich (Gillingham, UK). Phosphate buffer saline (PBS) was bought from Oxoid (Basingstoke, UK). Acetic acid, dioxane, ethanol, hexane, methanol and tetrahydrofuran were purchased from Fisher Scientific (Loughborough, UK). Deionized water, ethanol and hexane were passed through a 0.22 μm filter before use. Bis-trimethylsilyl GMMA and 2-bromoisobutyrylethoxypropyl terminated PDMS were prepared according to a previously reported procedure.37Physico-chemical characterization
![[thin space (1/6-em)]](https://www.rsc.org/images/entities/char_2009.gif) :
:![[thin space (1/6-em)]](https://www.rsc.org/images/entities/char_2009.gif) 30%). The binding energies were charge corrected to the C 1s binding energy of PDMS CH3 groups, using 284.5 eV as the energy associated with double methyl-substituted silicon atoms.38
30%). The binding energies were charge corrected to the C 1s binding energy of PDMS CH3 groups, using 284.5 eV as the energy associated with double methyl-substituted silicon atoms.38
(A) Imaging. Tapping mode parameters: scan frequency = 1 Hz (25.70 μm s−1), gain = 10, setpoint values 550 mV–650 mV, resonance frequency 313–344 kHz in air and 150–175 kHz in deionized water. Three different 10 μm × 10 μm regions of each sample (unmodified and coated S10, S20) were imaged. The original images (without any operations of flattening or filtering) were analyzed with Igor-pro (Asylum Research AFM software, Version 101010 + 1202, Wavemetrics, Portland, OR) in order to calculate the root mean square (RMS) roughness. All height images displaying both flat areas and aggregates were segmented to analyze separately the two regions. The segmentation was obtained by applying a threshold of 10 nm on the different height images (see ESI, Fig. 5SI†).
(B) Nanoindentation. Measurements on mica surfaces were used to calibrate the deflection sensitivity of the cantilever, which is necessary to convert force-displacement measurements into force-indentation dependences. The spring constant of the cantilevers was calculated with the thermal method39 and ranged between 36.2 N m−1 and 43.7 N m−1. The deflection sensitivity ranged between 65 nm V−1 and 75 nm V−1. Three different 10 μm × 10 μm regions were investigated for each sample obtaining force maps for each region with a spatial resolution of 0.25 μm2 (20 × 20 curves on an area of 100 μm2). All force curves were acquired with a loading/unloading rate equal to 6 μm s−1 (frequency = 1 Hz) and the maximum force applied on the surface of each samples was 500 nN.
Assuming a Hookean behaviour for the silicon cantilever, force-displacement data were converted to force-indentation plots. The same software was used to fit all the force curves in order to calculate Young's modulus; the power law exponent (β) of the data ranged between 1.80 and 2.00, suggesting the use of a Hertz-cone model (punch model: β = 1, Hertz-sphere model: β = 1.5, Hertz-cone model: β = 2; 0.5 ≥ β ≥ 2.5 means that the Hertz model cannot be used to fit the data due to excessive adhesion forces), which is described by the following equation:40,41
where Es, νs and Et, νt are Young's moduli and Poisson's ratios for the sample and the tip, respectively. Et = 150 GPa, νt = 0.17, α = 18° and νs = 0.5.43
The adhesion forces between the AFM tip and the sample surface were determined both in loading (indentation) and unloading (retraction) force curves. The contact point was identified as the minimum of the loading curve. Upon retraction, the tip maintains the contact with the surface until the cantilever force overcomes the adhesion force: at this point the force reaches a minimum and then rapidly decreases to 0 (the tip is pulled out of contact with the surface). The difference between the minimum (negative) force and the force felt at a large distance from the surface is the adhesion force.
Preparative procedures
![[thin space (1/6-em)]](https://www.rsc.org/images/entities/char_2009.gif) :
:![[thin space (1/6-em)]](https://www.rsc.org/images/entities/char_2009.gif) 1, 10
1, 10![[thin space (1/6-em)]](https://www.rsc.org/images/entities/char_2009.gif) :
:![[thin space (1/6-em)]](https://www.rsc.org/images/entities/char_2009.gif) 1, 20
1, 20![[thin space (1/6-em)]](https://www.rsc.org/images/entities/char_2009.gif) :
:![[thin space (1/6-em)]](https://www.rsc.org/images/entities/char_2009.gif) 1 and 50
1 and 50![[thin space (1/6-em)]](https://www.rsc.org/images/entities/char_2009.gif) :
:![[thin space (1/6-em)]](https://www.rsc.org/images/entities/char_2009.gif) 1 corresponding to the substrates S5, S10, S20 and S50 respectively), degassed under reduced pressure for 30 min and transferred into TCPS Petri dishes. The PDMS films were cured at room temperature for 2 days and disks with a diameter of 6 mm (samples for the texture analyzer) or 9 mm (substrates for adsorption experiments) and a thickness of approximately 3 mm were cut using cork borers. The substrates were washed with hexane to remove any unreacted oligomers and dried under reduced pressure.
1 corresponding to the substrates S5, S10, S20 and S50 respectively), degassed under reduced pressure for 30 min and transferred into TCPS Petri dishes. The PDMS films were cured at room temperature for 2 days and disks with a diameter of 6 mm (samples for the texture analyzer) or 9 mm (substrates for adsorption experiments) and a thickness of approximately 3 mm were cut using cork borers. The substrates were washed with hexane to remove any unreacted oligomers and dried under reduced pressure.
Results and discussion
Characterization of the uncoated substrates
We have produced silicone substrates using the popular two-component formulation Sylgard 184; this is composed of a base (mostly vinylated PDMS and vinylated or trimethylsilylated silica) and a cross-linker (silane-containing PDMS + vinylated PDMS and vinylated or trimethylsilylated silica + tetramethyl tetravinyl cyclotetrasiloxane),44 which we have used at weight ratios between 10![[thin space (1/6-em)]](https://www.rsc.org/images/entities/char_2009.gif) :
:![[thin space (1/6-em)]](https://www.rsc.org/images/entities/char_2009.gif) 1 (S10) and 50
1 (S10) and 50![[thin space (1/6-em)]](https://www.rsc.org/images/entities/char_2009.gif) :
:![[thin space (1/6-em)]](https://www.rsc.org/images/entities/char_2009.gif) 1 (S50). Please note that cross-link density influence both mechanical and surface properties (Table 1).
1 (S50). Please note that cross-link density influence both mechanical and surface properties (Table 1).
| Samplea | Young's modulus (MPa) | Contact angle (°) | Adhesion forced (nN) | Roughness (nm) | |||
|---|---|---|---|---|---|---|---|
| Compressionb | Nanoindentationc (air/water) | Advancing | Receding | Loading | |||
| (air/water) | Unloading | ||||||
a In brackets the base![[thin space (1/6-em)]](https://www.rsc.org/images/entities/char_2009.gif) : :![[thin space (1/6-em)]](https://www.rsc.org/images/entities/char_2009.gif) X-linker weight ratio.
b Measured in air on cylindrical samples on an area of approx. 28 mm2.
c Measured both in air and in water with AFM in nanoindentation mode.
d Measured both in air and in water as the maximum negative force recorded in the indentation (loading) and in the retraction (unloading) curves. No loading adhesion forces were observed in water. The adhesion force in loading is often referred to as the van der Waals component of the total adhesion. See also ESI, Fig. 1SI.
e The negligible adhesion in loading is due to the presence of a film of water that shields the tip from the substrate surface.
f S50 could not be analyzed via nanoindentation (tip rapidly covered by debris). X-linker weight ratio.
b Measured in air on cylindrical samples on an area of approx. 28 mm2.
c Measured both in air and in water with AFM in nanoindentation mode.
d Measured both in air and in water as the maximum negative force recorded in the indentation (loading) and in the retraction (unloading) curves. No loading adhesion forces were observed in water. The adhesion force in loading is often referred to as the van der Waals component of the total adhesion. See also ESI, Fig. 1SI.
e The negligible adhesion in loading is due to the presence of a film of water that shields the tip from the substrate surface.
f S50 could not be analyzed via nanoindentation (tip rapidly covered by debris).
|
|||||||
S10 (10![[thin space (1/6-em)]](https://www.rsc.org/images/entities/char_2009.gif) : :![[thin space (1/6-em)]](https://www.rsc.org/images/entities/char_2009.gif) 1) 1) |
2.90 ± 0.05 | 2.11 ± 0.02 (a) | 105 ± 1 | 103 ± 1 | 7.6 ± 0.6 | 14.7 ± 1.2 (a) | 0.54 ± 0.10 |
| 2.05 ± 0.03 (w) | <0.1e | 102 ± 5 (w) | |||||
S20 (20![[thin space (1/6-em)]](https://www.rsc.org/images/entities/char_2009.gif) : :![[thin space (1/6-em)]](https://www.rsc.org/images/entities/char_2009.gif) 1) 1) |
0.76 ± 0.05 | 1.14 ± 0.04 (a) | 112 ± 2 | 108 ± 4 | 11.2 ± 0.8 | 34.7 ± 2.3 (a) | 0.49 ± 0.11 |
| 1.08 ± 0.04 (w) | <0.1e | 115 ± 7 (w) | |||||
S50 (50![[thin space (1/6-em)]](https://www.rsc.org/images/entities/char_2009.gif) : :![[thin space (1/6-em)]](https://www.rsc.org/images/entities/char_2009.gif) 1) 1) |
0.095 ± 0.016 | —f | 115 ± 2 | 111 ± 2 | — | —f | — |
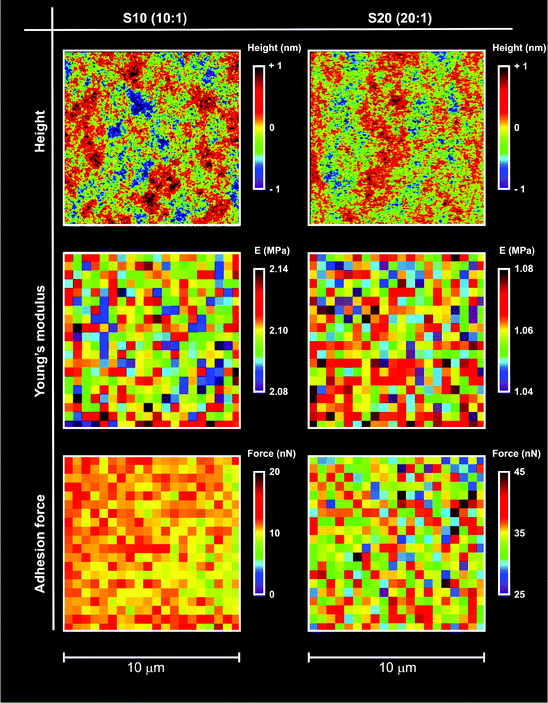 | ||
| Fig. 1 Typical height, modulus and adhesion maps for S10 and S20 samples in air; the maps were obtained using AFM in tapping mode (top), or nanoindentation (middle and bottom). The nanoindentation maps report the Young's modulus (middle) calculated using a Hertzian model and the adhesion force (bottom) calculated from retraction curves (see for example ESI, Fig. 1SI† right). In both cases, the maps showed the PDMS surfaces to be very homogeneous at least at the resolution used (500 nm: 20 points on a 10 μm scale). It is noted that, although characterized by similarly smooth surfaces, the two materials drastically differed in modulus and polarity (lower modulus and higher adhesion recorded for S20). | ||
![[thin space (1/6-em)]](https://www.rsc.org/images/entities/char_2009.gif) :
:![[thin space (1/6-em)]](https://www.rsc.org/images/entities/char_2009.gif) 1 ratio gave E = 2.74 ± 0.10 MPa; lower cross-link densities, i.e. >50
1 ratio gave E = 2.74 ± 0.10 MPa; lower cross-link densities, i.e. >50![[thin space (1/6-em)]](https://www.rsc.org/images/entities/char_2009.gif) :
:![[thin space (1/6-em)]](https://www.rsc.org/images/entities/char_2009.gif) 1 ratios, provided materials with a predominantly viscous behaviour. Exposure to water did not significantly affect the modulus, as it would be expected for a strongly hydrophobic and thus non-swellable material (Table 1, data in air (a) and in water (w)).
1 ratios, provided materials with a predominantly viscous behaviour. Exposure to water did not significantly affect the modulus, as it would be expected for a strongly hydrophobic and thus non-swellable material (Table 1, data in air (a) and in water (w)).
Surface modification via colloidal deposition
We have employed ethanol–water dispersions: ethanol has already been used to deposit block copolymers on silicone20 and we hypothesized that its combination with water would allow at the same time for a thermodynamic driving force (the high surface energy of silicone in water being reduced by coating) and for kinetically favourable conditions (increased solubility of polymers in the medium leading to accelerated deposition). It is worth mentioning that deposition from pure water did not appear to have much success.Always with the aim to accelerate the deposition, we have considered the time dependence of the size of Sil-GMMA aggregates as an indication of their dynamics; using 9![[thin space (1/6-em)]](https://www.rsc.org/images/entities/char_2009.gif) :
:![[thin space (1/6-em)]](https://www.rsc.org/images/entities/char_2009.gif) 1 and 1
1 and 1![[thin space (1/6-em)]](https://www.rsc.org/images/entities/char_2009.gif) :
:![[thin space (1/6-em)]](https://www.rsc.org/images/entities/char_2009.gif) 1 water–ethanol (see ESI, Fig. 2SI†), the aggregate size increased with increasing PDMS content, as it happens also in water, while in the first mixture the aggregates were rather stable for up to 4 weeks, in 1
1 water–ethanol (see ESI, Fig. 2SI†), the aggregate size increased with increasing PDMS content, as it happens also in water, while in the first mixture the aggregates were rather stable for up to 4 weeks, in 1![[thin space (1/6-em)]](https://www.rsc.org/images/entities/char_2009.gif) :
:![[thin space (1/6-em)]](https://www.rsc.org/images/entities/char_2009.gif) 1 ethanol–water they showed quite a marked evolution (decrease with time), which led us to select the latter solvent composition as the most “dynamic” and to use it for all deposition experiments.
1 ethanol–water they showed quite a marked evolution (decrease with time), which led us to select the latter solvent composition as the most “dynamic” and to use it for all deposition experiments.
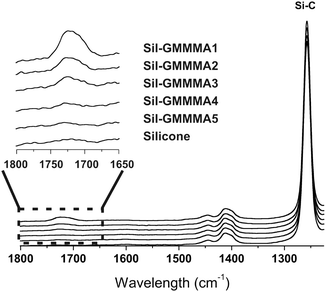
![[double bond, length as m-dash]](https://www.rsc.org/images/entities/char_e001.gif) O stretching peak was used as a semi-quantitative indication of the amount of GMMA-containing material deposited on the surface. For the polymers with the highest PGMMA content, the peak could be barely seen and therefore Sil-GMMA4 and 5 were not further used.
O stretching peak was used as a semi-quantitative indication of the amount of GMMA-containing material deposited on the surface. For the polymers with the highest PGMMA content, the peak could be barely seen and therefore Sil-GMMA4 and 5 were not further used.
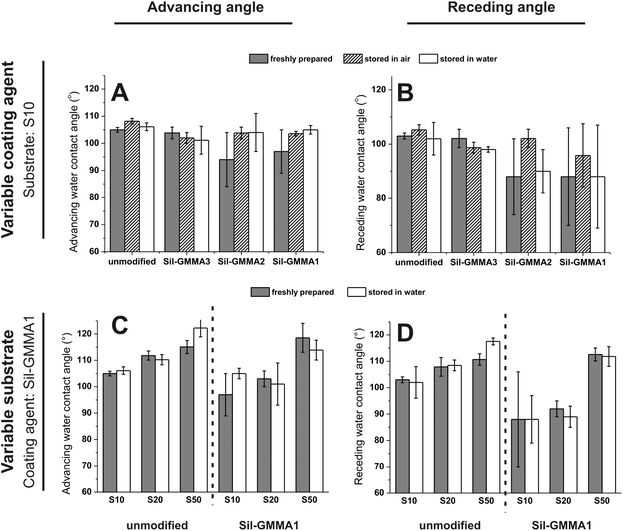
Sil-GMMA3 (Fig. 3A and B) and S50 (Fig. 3C and D) were discarded, respectively, as a coating agent and as a substrate, because the corresponding coating processes did not lead to any appreciably difference of the contact angles, suggesting negligible and/or unstable deposition: this is hardly surprising for Sil-GMMA3, which forms more stable and higher curvature aggregates in water and therefore is possibly more prone to desorption. In contrast, the insignificant effects on S50 may be related to the ease of migration of the polymers from the surface to the bulk, due to the low cross-link density of the material. Please note that further experiments were therefore conducted with Sil-GMMA1 and 2, i.e. employing S10 and S20 as the substrates; the identity of the polymer (Fig. 3A and B) and that of the substrate (Fig. 3C and D) did not appear to have a major effect. It is also noticeable that (A) the adsorption of Sil-GMMA1 and 2 lowered more the receding than the advancing contact angles, (B) lower contact angles were recorded upon storage in water or immediately after preparation whereas both advancing and receding angles were indistinguishable from those of the unmodified substrates upon prolonged storage in air (Fig. 3A and B). These two phenomena would hint at re-organization phenomena occurring on these coated surfaces when in air; it is also noteworthy that the lowest contact angles showed large errors, suggesting the presence of heterogeneities.
| Sample | Ca | Oa | Sia | Bra | |||||
|---|---|---|---|---|---|---|---|---|---|
| a t.o.a. = 10° (left) and 90° (right). Considering that 95% of the observed photoelectron signal derives from a layer thickness 3λ sin(t.o.a.), with C 1s electron mean free path (λ) = 2.9 nm (value obtained for AlKα X-ray photoemitted electrons47), 10° and 90° should correspond, respectively, to 1.5 and 8.7 nm. | |||||||||
| PDMS | Theoretical composition | 50 | 25 | 25 | — | ||||
| Sil-GMMA1 | 57 | 31 | 12 | 0.2 | |||||
| Sil-GMMA2 | 59 | 32 | 9 | 0.2 | |||||
| S10 (unmodified) | Stored in air | 47 | 47 | 30 | 26 | 23 | 26 | 0 | 0 |
| Sil-GMMA1 | 48 | 49 | 30 | 25 | 21 | 26 | 0.02 | 0 | |
| Sil-GMMA2 | 49 | 50 | 30 | 24 | 21 | 27 | 0 | 0 | |
| S10 (unmodified) | Stored in water | 49 | 49 | 30 | 24 | 21 | 27 | 0 | 0 |
| Sil-GMMA1 | 50 | 49 | 30 | 24 | 19 | 26 | 0.06 | 0 | |
| Sil-GMMA2 | 50 | 48 | 30 | 24 | 20 | 28 | 0 | 0 | |
Due to the large (≥66 wt%) PDMS content of the block copolymers the surface composition of the coated samples is expected to undergo only moderate changes, with some increase in the carbon content and decrease in the silicon one; indeed only rather small differences were recorded (Table 2), with the silicon content appearing slightly reduced at t.o.a. = 10°. In a further analysis, high resolution C 1s spectra clearly showed the presence of carbonyl groups (peak at 289.1 eV, shift of 3.8 eV relative to saturated hydrocarbon)48 (Fig. 4B, compared to Fig. 4A), which was accompanied by an increase in the C–O signal.
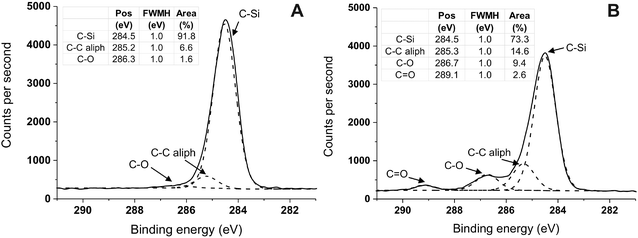 | ||
Fig. 4 XPS C 1s high-resolution spectra (t.o.a. 10°) of silicone substrate (S10) unmodified (A) and modified with Sil-GMMA1 (B) after storage in water for 14 days. (A) The presence of saturated C–C bonds and of trances of C–O bonds is due to the cross-linkers and silanizing agents used in the Sylgard 184 formulation. (B) The increased amount of C–O bonds and the presence of C![[double bond, length as m-dash]](https://www.rsc.org/images/entities/char_e001.gif) O groups are ascribed to the ester and alcohol groups of PGMMA chains. Spectra have been charge corrected to position the C 1s at 284.5 eV, which is the binding energy for the binary arrangement ((CH3)2SiO2/2) of PDMS.38 It is noted that both in (A) and in (B) the binding energy for aliphatic C–C is higher than its most usual value (285.0 eV); although a precise explanation for this shift is difficult to find, such a higher binding energy is not unheard of, and has been associated with aliphatic groups present e.g. in peptide-coated silicon,49 as well as in diamond-like carbon50 or in graphene oxide51 or nanotubes52 derivatives. O groups are ascribed to the ester and alcohol groups of PGMMA chains. Spectra have been charge corrected to position the C 1s at 284.5 eV, which is the binding energy for the binary arrangement ((CH3)2SiO2/2) of PDMS.38 It is noted that both in (A) and in (B) the binding energy for aliphatic C–C is higher than its most usual value (285.0 eV); although a precise explanation for this shift is difficult to find, such a higher binding energy is not unheard of, and has been associated with aliphatic groups present e.g. in peptide-coated silicon,49 as well as in diamond-like carbon50 or in graphene oxide51 or nanotubes52 derivatives. | ||
Br atoms were recorded for Sil-GMMA1 at a t.o.a. of 10° (see ESI, Fig. 4SI†), while they were absent at t.o.a. = 90° on coated samples. XPS therefore confirmed the presence of small amounts of Sil-GMMA1 and 2 and only in the upper surface layers. Storage in water affected in an equal fashion both uncoated and coated substrates, indicating that their upper layers may be slightly less rich in silicone, which would possibly support some hydrophobic recovery; however, the effect on both uncoated and coated samples was rather marginal.
We examined in more detail the kinetics of the drying process.
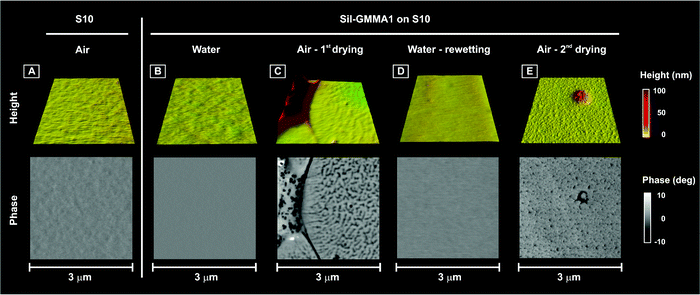
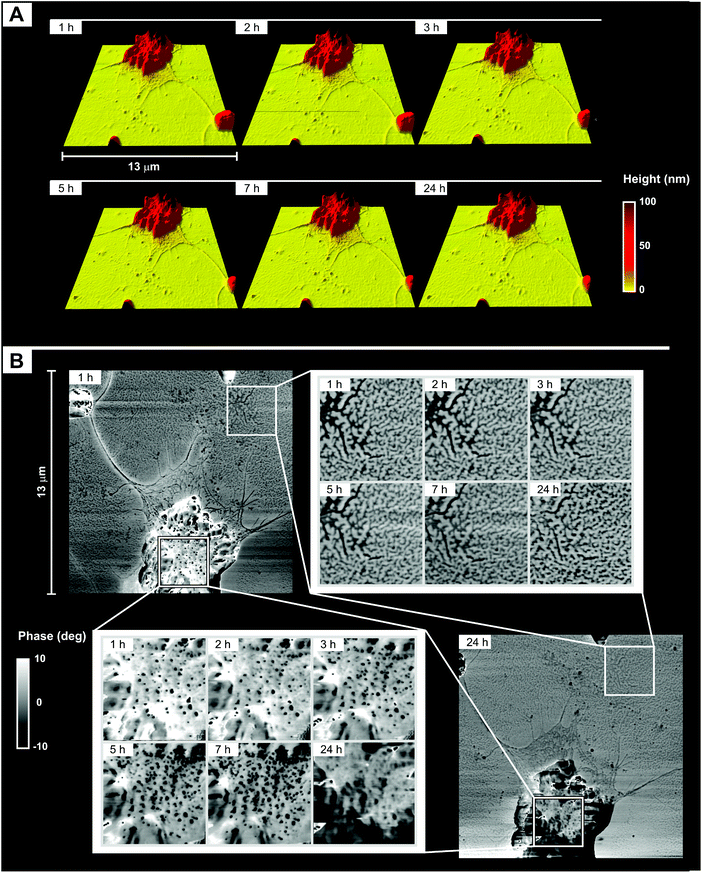
(A) Morphology. Both flat areas and aggregates maintained their overall roughness and morphology (see ESI, Fig. 5SI;† see also Fig. 7A), but a significant surface reorganization was apparent in the phase images of the latter; in particular, the component characterized by a lower phase (most likely PDMS) appeared to gradually increase its surface presence (Fig. 7B). Since in the same time frame the phase structure of the flat areas did not change appreciably, it seems therefore reasonable to ascribe the wetting/hydrophobic recovery suggested by contact angle measurements to the dynamics of the surface aggregates.
(B) Young's modulus and adhesion force. In air, the average stiffness of the coated surfaces was rather similar to that of the pristine silicone substrate (compare top row Fig. 8A with Fig. 1, middle left) and was substantially unaffected by the drying process. Measurements performed selectively on aggregates showed them to be markedly stiffer than the flat areas (Fig. 8B and C), and the latter to have a modulus virtually identical to that of the uncoated silicone. The latter point suggests therefore Sil-GMMA1 to form there a very thin layer in these areas; considering that they cover the vast majority of the surfaces, this confirms the XPS indications. In terms of adhesion of the coated surfaces to the AFM tip (Fig. 8D and E), the sample behavior was again dominated by the flat areas, which are more polar than both the substrates (3–4 times larger adhesion force) and the aggregates. It is noteworthy that the flat areas adhesion showed a small but measurable decrease with time, which may lead to a decrease in contrast in phase images (Fig. 7B); we are inclined to ascribe the two phenomena to the slow evaporation of water from PGMMA blocks.
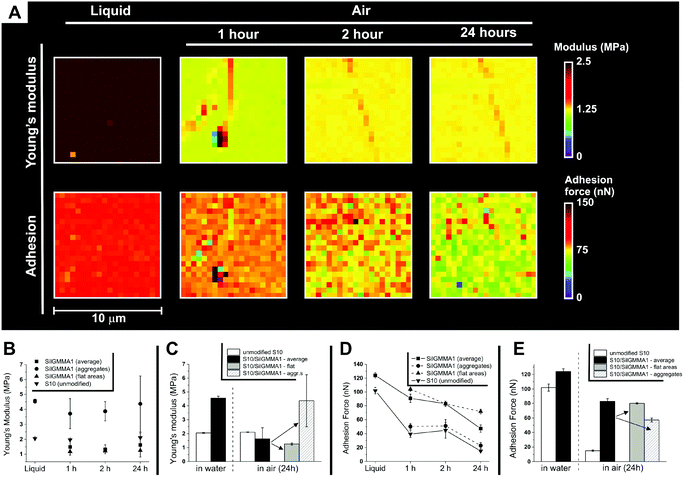 | ||
| Fig. 8 (A) Typical Young's modulus (above) and adhesion force maps (below) of S10 coated with Sil-GMMA1; the same area was imaged under water and 1, 2 and 24 h after its removal. For the segmentation process used to distinguish flat areas from aggregates, see ESI, Fig. 7SI.† Please note that the Young's modulus of the coated material under water appears stiffer than in air; this effect was not recorded on the uncoated substrates (Table 1) and likely stems from the choice of the Hertz model to fit nanoindentation data: this model does not consider the substrate surface energy; thus it makes it impossible to quantitatively compare the modulus of a hydrophilic surface in air and under water. (B) Young's modulus averaged over 10 μm × 10 μm areas (n = 3) for unmodified and coated S10, in deionized water (liquid) or in air as a function of the drying time. (C) Data from (B), clearer comparison of water/24 h in air. (D) Adhesion force measured as described in (B). (E) Data from (D), clearer comparison of water/24 h in air. For a similar comparison of 1 h and 5 h drying, see ESI, Fig. 8SI.† | ||
It seems therefore reasonable to assume the flat areas to be composed of a thin (mono)layer of Sil-GMMA1 that (a) does not markedly affect the mechanical properties of the substrate, but (b) does alter its surface energy by displaying GMMA blocks, and (c) does not undergo a major reorganization during drying, i.e. does not show a hydrophobic recovery.
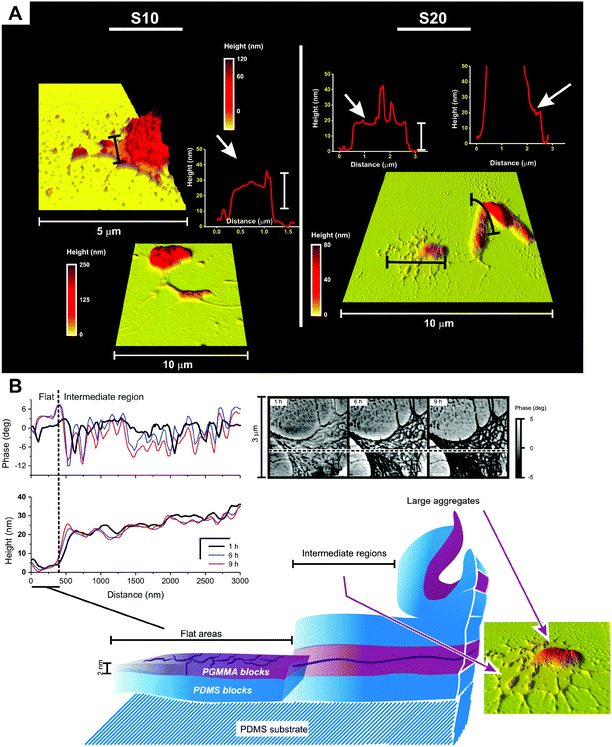
The aggregates appear to be irregular assemblies of the block copolymers, and they undergo significant restructuring during drying; since they are highly unlikely to derive from the colloidal precursors (they are not recorded under water), they are likely produced during drying. An additional feature would seem to support this hypothesis: most aggregates appeared to be surrounded by ≈20 nm-thick layers (Fig. 9A), whose shape seems to recall dewetting/contraction phenomena. During drying, these intermediate regions underwent a surface reorganization similar to that of large aggregates, i.e. with small variations in the profile but very significant time dependency of the phase (Fig. 9B). Unfortunately, the limited lateral resolution of nanoindentation measurements did not allow us to measure the adhesion force selectively in these regions to highlight any difference in surface polarity from the aggregates.
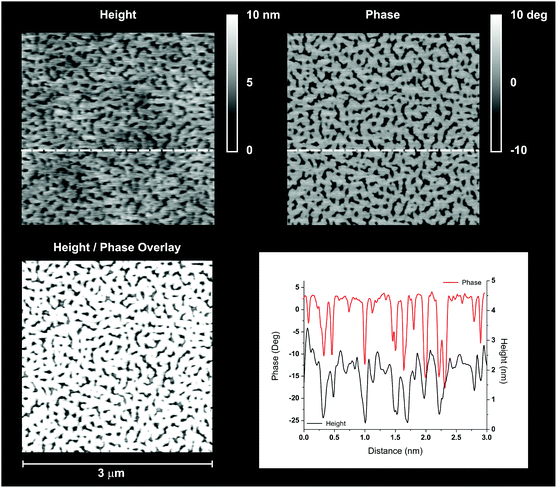
We propose here a speculative explanation. If we assume the height of GMMA domains to be around 2–2.5 nm (as suggested by the scans in Fig. 6), we could estimate that the 70 wt% silicone content would lead to an overall thickness of 7–10 nm for a surface-adsorbed Sil-GMMA1 monolayer; the intermediate regions could be then interpreted as double or oligo-layers, possibly originating from a multilamellar organization of the polymers within the colloids. Indeed, while in water dispersion Sil-GMMA1 forms elongated structures resembling worm-like micelles, in water–ethanol lower-curvature e.g. lamellar structures are probably more favoured, due to the reduced solvation of GMMA units.
It could be further hypothesized that while under water all surface is likely covered by multilayer, GMMA-displaying structures, a long-range contraction and re-organisation would occur during drying, eventually yielding aggregates and leaving mostly PDMS-displaying intermediate regions as partial remnants.
Protein adsorption
The adsorption of (plasma) proteins to the surfaces of synthetic materials is widely recognized as one of the most important causes of cell (platelet, leukocyte) adhesion and ultimately foreign body reaction. Surface heterogeneities, electrostatic or other polar interactions can affect protein adsorption,53,54 but on PDMS it is generally accepted that this is mainly driven by hydrophobic effects, i.e. the entropy-driven release of ordered water from silicone surfaces. Therefore, the higher surface polarity of Sil-GMMA-coated surfaces may have a significant influence on the amount and quality of adsorbed proteins.For this study we have employed bovine serum albumin (BSA) and bovine plasma fibrinogen (BPF), which are used as models for the corresponding human proteins; in humans, albumin is the most abundant plasma protein, with a concentration of about 30–50 mg mL−1 (fibrinogen = 1–3 mg mL−1) and is one of the first proteins to adsorb on the surface of implanted biomaterials;55–57 its deposition is often considered to act as a sort of passivation, since it does not specifically encourage platelet or leukocyte adhesion. In contrast, the adsorption of fibrinogen is well known to trigger undesired reactions.6,7
Adsorption experiments were performed on S10 freshly coated with Sil-GMMA1-3; since the samples have not been dried, we assume that at least in the case of Sil-GMMA1 the substrates presented a GMMA-rich surface, possibly in a multilayer morphology (= no aggregates).
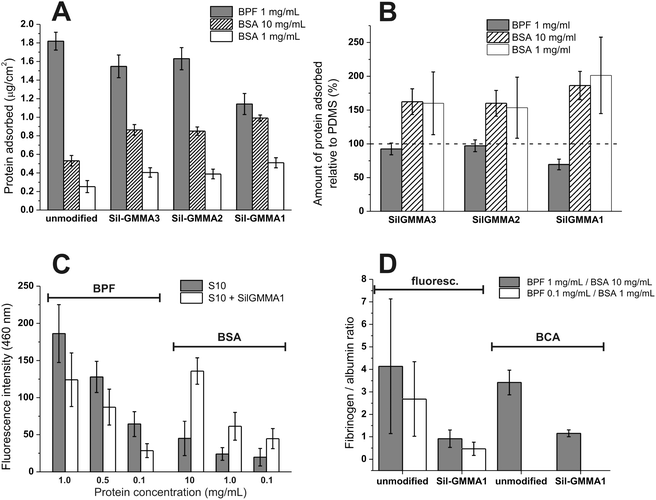
The amount of adsorbed protein was first evaluated via the bicinchoninic acid (BCA) assay after desorption with sodium dodecyl sulfate (Fig. 10A and B). Due to the unselective nature of the test, we have separately investigated BSA and BPF, which were used at concentrations similar to those in plasma (resp. 10 and 1 mg mL−1, using 1 mg mL−1 BSA as a control). The presence of Sil-GMMA2 and 3 did not appreciably modify the adsorption of BPF, but increased that of BSA; on the other hand, Sil-GMMA1 affected both, with a ≈30% decrease in BPF and a ≈100% increase in BSA. This effect is not new: using polyurethane-PGMMA hydrogels Mequanint et al. observed higher albumin and lower fibrinogen adsorption with increasing PGMMA content,27 thus showing PGMMA to have preferential interactions with albumin.
We have then used fluorescamine to detect the presence of primary amino groups directly on Sil-GMMA1-coated vs. unmodified S10, without desorption (Fig. 10C). Upon reaction with amines, fluorescamine exhibits maximum emission at 460 nm when excited at 390 nm;58 since we have analysed only one type of protein at a time, the fluorescence intensity at 460 nm is directly proportional to the amount of protein adsorbed; due to the higher sensitivity of the method, it also allowed us to extend the study to more diluted protein solutions. Confirming the results of the BCA assays, at all concentrations we have recorded an increase in BSA and a decrease in BPF adsorption.
Fig. 10D graphically summarizes the comparison of the relative affinity of Sil-GMMA1-coated and unmodified S10 for the two proteins, at a fibrinogen/albumin ratio similar to that in blood (1![[thin space (1/6-em)]](https://www.rsc.org/images/entities/char_2009.gif) :
:![[thin space (1/6-em)]](https://www.rsc.org/images/entities/char_2009.gif) 10); please note that these data refer to individual adsorption experiments and not to competitive binding. Both analytical techniques showed a clear switch from a BPF-philic to a BSA-philic character upon surface coating, which can be promising for decreasing cell attachment and the likelihood of foreign body reaction in vivo.
10); please note that these data refer to individual adsorption experiments and not to competitive binding. Both analytical techniques showed a clear switch from a BPF-philic to a BSA-philic character upon surface coating, which can be promising for decreasing cell attachment and the likelihood of foreign body reaction in vivo.
There are, however, a few caveats. First, adsorbed albumin can be replaced by other proteins having higher affinity for hydrophobic surfaces, like fibrinogen. Obviously, the extent of this effect depends on the nature of the surface.59 Therefore studies investigating competitive proteins adsorption or albumin replacement by fibrinogen will be undertaken. Second, protein adsorption may not provide an univocal understanding of the biological performance, since the degree of the biological activity of adsorbed proteins depends on their molecular spreading (degree of unfolding) and/or variations in the orientation or accessibility of the cell binding domains,6,7,57,60 but also on the composition of the adsorbed layer: for example, there is evidence that co-adsorbed albumin influences the “surface biological activity” of fibrinogen.61
Conclusions
We have demonstrated that the physisorption of PDMS-based macroamphiphiles containing hydrophilic PGMMA blocks (Sil-GMMAs) provides measurable and likely beneficial effects, as long as polymers with high PDMS content are employed. For example, when in a water environment the surface-deposited polymers have a significant effect on protein adsorption, changing the surface character from preferentially fibrinogen-adsorbing (in perspective more cell-adhesive) to preferentially albumin-adsorbing (less cell-adhesive). This switch can be very beneficial for the modulation of cell adhesion and activation.However, the situation becomes complicated in air; the PDMS surface was shown to be predominantly covered by a non-restructuring and thin layer, which showed the characteristics of a phase-segregated monolayer. Although in less conspicuous amounts, other morphologies (aggregates) are also produced in the early stages of drying, and they may derive from the re-organization of multilamellar structures generated in the deposition process. Differently from the monolayers, they undergo significant reorganization (hydrophobic recovery) under air and despite their rather low amount we are inclined to ascribe to them a dominant role in the macroscopic contact angle behaviour.
In the perspective of a stable surface functionalization, the presence of the latter structures should be minimized, which likely means to achieve control over the number of layers deposited; this could be possibly achieved by optimizing the concentration of Sil-GMMA1 during the colloidal adsorption, and/or on the morphology of the colloids themselves, e.g. via sonication or extrusion.
Acknowledgements
Dr Christopher Cadman and Dr Roberto Donno gratefully acknowledge EPSRC for PhD studentships, the latter in the framework of the EPSRC-funded North West Nanoscience Doctoral Training Centre (NoWNano DTC). Finally, the authors wish to also acknowledge the support from the EPSRC grant EP/F019750/1 (A coordinated open-access centre for comprehensive materials analysis) to perform XPS measurements.References
- K. J. Quinn and J. M. Courtney, Br. Polym. J., 1988, 20, 25–32 CrossRef CAS PubMed.
- X. J. Hao, J. L. Jeffery, J. S. Wilkie, G. F. Meijs, A. B. Clayton, J. D. Watling, A. Ho, V. Fernandez, C. Acosta, H. Yamamoto, M. G. M. Aly, J. M. Parel and T. C. Hughes, Biomaterials, 2010, 31, 8153–8163 CrossRef CAS PubMed.
- E. L. Lawrence and I. G. Turner, Med. Eng. Phys., 2005, 27, 443–453 CrossRef CAS PubMed.
- D. Wolfram, W. Dolores, C. Rainer, R. Christian, H. Niederegger, N. Harald, H. Piza, P. Hildegunde, G. Wick and W. Georg, J. Autoimmun., 2004, 23, 81–91 CrossRef CAS PubMed.
- J. C. McDonald and G. M. Whitesides, Acc. Chem. Res., 2002, 35, 491–499 CrossRef CAS PubMed.
- W. J. Hu, J. W. Eaton and L. P. Tang, Blood, 2001, 98, 1231–1238 CrossRef CAS PubMed.
- B. Sivaraman and R. A. Latour, Biomaterials, 2010, 31, 832–839 CrossRef CAS PubMed.
- A. I. Lopez, A. Kumar, M. R. Planas, Y. Li, T. V. Nguyen and C. Cai, Biomaterials, 2011, 32, 4336–4346 CrossRef CAS PubMed.
- A. L. Hook, C. Y. Chang, J. Yang, S. Atkinson, R. Langer, D. G. Anderson, M. C. Davies, P. Williams and M. R. Alexander, Adv. Mater., 2013, 25, 2542–2547 CrossRef CAS PubMed.
- A. L. Hook, C. Y. Chang, J. Yang, J. Luckett, A. Cockayne, S. Atkinson, Y. Mei, R. Bayston, D. J. Irvine, R. Langer, D. G. Anderson, P. Williams, M. C. Davies and M. R. Alexander, Nat. Biotechnol., 2012, 30, 868–899 CrossRef CAS PubMed.
- H. Chen, Z. Zhang, Y. Chen, M. A. Brook and H. Sheardown, Biomaterials, 2005, 26, 2391–2399 CrossRef CAS PubMed.
- S. Tugulu and H. A. Klok, Macromol. Symp., 2009, 279, 103–109 CrossRef CAS PubMed.
- M. H. Wu, Surf. Interface Anal., 2009, 41, 11–16 CrossRef CAS PubMed.
- Z. Y. Zhang, J. C. Wang, Q. Tu, N. Nie, J. Sha, W. M. Liu, R. Liu, Y. R. Zhang and J. Y. Wang, Colloids Surf., B, 2011, 88, 85–92 CrossRef CAS PubMed.
- K. Yu and Y. C. Han, Soft Matter, 2006, 2, 705–709 RSC.
- M. Li, K. G. Neoh, L. Q. Xu, R. Wang, E. T. Kang, T. Lau, D. P. Olszyna and E. Chiong, Langmuir, 2012, 28, 16408–16422 CrossRef CAS PubMed.
- T. Rambarran, F. Gonzaga and M. A. Brook, Macromolecules, 2012, 45, 2276–2285 CrossRef CAS.
- J. J. Wang and F. Liu, J. Mater. Sci. Mater. Med., 2011, 22, 2651–2657 CrossRef CAS PubMed.
- J. H. Seo, R. Matsuno, T. Konno, M. Takai and K. Ishihara, Biomaterials, 2008, 29, 1367–1376 CrossRef CAS PubMed.
- J.-H. Seo, T. Shibayama, M. Takai and K. Ishihara, Soft Matter, 2011, 7, 2968–2976 RSC.
- F. Wan, X. W. Pei, B. Yu, Q. Ye, F. Zhou and Q. J. Xue, ACS Appl. Mater. Interfaces, 2012, 4, 4557–4565 CAS.
- Z. Q. Wu, W. F. Tong, W. W. Jiang, X. L. Liu, Y. W. Wang and H. Chen, Colloids Surf., B, 2012, 96, 37–43 CrossRef CAS PubMed.
- F. Abbasi and H. Mirzadeh, J. Polym. Sci., Part B: Polym. Phys., 2003, 41, 2145–2156 CrossRef CAS PubMed.
- C. Giacomelli, V. Schmidt and R. Borsali, Macromolecules, 2007, 40, 2148–2157 CrossRef CAS.
- R. Haigh, S. Rimmer and N. J. Fullwood, Biomaterials, 2000, 21, 735–739 CrossRef CAS.
- C. Johnson, L. Perlin, P. Wyman, B. Zhao, N. J. Fullwood, S. MacNeil and S. Rimmer, in Polymer Networks: Synthesis, Properties, Theory and Applications, Wiley-VCH Verlag Gmbh, Weinheim, 2010, vol. 291–292, pp. 314–325 Search PubMed.
- K. Mequanint, A. Patel and D. Bezuidenhout, Biomacromolecules, 2006, 7, 883–891 CrossRef CAS PubMed.
- E. Patrucco, S. Ouasti, C. D. Vo, P. De Leonardis, A. Pollicino, S. P. Armes, M. Scandola and N. Tirelli, Biomacromolecules, 2009, 10, 3130–3140 CrossRef CAS PubMed.
- S. Rimmer, C. Johnson, B. Zhao, J. Collier, L. Gilmore, S. Sabnis, P. Wyman, C. Sammon, N. J. Fullwood and S. MacNeil, Biomaterials, 2007, 28, 5319–5331 CrossRef CAS PubMed.
- C. Wang, B. Yu, B. Knudsen, J. Harmon, F. Moussy and Y. Moussy, Biomacromolecules, 2008, 9, 561–567 CrossRef CAS PubMed.
- E. P. Everaert, H. C. VanderMei and H. J. Busscher, J. Adhes. Sci. Technol., 1996, 10, 351–359 CrossRef CAS PubMed.
- H. Hillborg and U. W. Gedde, Polymer, 1998, 39, 1991–1998 CrossRef CAS.
- Z. G. Wu and K. Hjort, Lab Chip, 2009, 9, 1500–1503 RSC.
- J. A. Neff, P. A. Tresco and K. D. Caldwell, Biomaterials, 1999, 20, 2377–2393 CrossRef CAS.
- C. FreijLarsson, T. Nylander, P. Jannasch and B. Wesslen, Biomaterials, 1996, 17, 2199–2207 CrossRef CAS.
- S. Lee, R. Iten, M. Muller and N. D. Spencer, Macromolecules, 2004, 37, 8349–8356 CrossRef CAS.
- G. Robert-Nicoud, R. Evans, C. D. Vo, C. Cadman and N. Tirelli, Polym. Chem., 2013, 4, 3458–3470 RSC.
- L. A. O'Hare, A. Hynes and M. R. Alexander, Surf. Interface Anal., 2007, 39, 926–936 CrossRef PubMed.
- J. L. Hutter and J. Bechhoefer, Rev. Sci. Instrum., 1993, 64, 1868–1873 CrossRef CAS PubMed.
- J. W. Harding and I. N. Sneddon, Proc. Camb. Philos. Soc., 1945, 41, 16–26 CrossRef.
- I. N. Sneddon, Int. J. Eng. Sci., 1965, 3, 47–57 CrossRef.
- C. A. Clifford and M. P. Seah, Appl. Surf. Sci., 2005, 252, 1915–1933 CrossRef CAS PubMed.
- N. Galler, H. Ditlbacher, A. Hohenau, A. Leitner, F. R. Aussenegg and J. R. Krenn, Appl. Phys. B: Lasers Opt., 2011, 104, 931–934 CrossRef CAS.
- D. J. Campbell, J. A. Olson, C. E. Calderon, P. W. Doolan, E. A. Mengelt, A. B. Ellis and G. C. Lisensky, J. Chem. Educ., 1999, 76, 1205–1211 CrossRef CAS.
- H. Hillborg, N. Tomczak, A. Olah, H. Schonherr and G. J. Vancso, Langmuir, 2004, 20, 785–794 CrossRef CAS.
- A. Olah, H. Hillborg and G. J. Vancso, Appl. Surf. Sci., 2005, 239, 410–423 CrossRef CAS PubMed.
- R. F. Roberts, D. L. Allara, C. A. Pryde, D. N. E. Buchanan and N. D. Hobbins, Surf. Interface Anal., 1980, 2, 5–10 CrossRef CAS PubMed.
- G. Beamson and D. Briggs, The XPS of Polymers Database, Surface Spectra Ltd, 2000 Search PubMed.
- S. S. Sam, J.-N. J. N. Chazalviel, A. C. A. C. Gouget-Laemmel, F. F. Ozanam, A. A. Etcheberry and N.-e. N. Gabouze, Nanoscale Res. Lett., 2011, 6, 412 CrossRef PubMed.
- P. Merel, M. Tabbal, M. Chaker, S. Moisa and J. Margot, Appl. Surf. Sci., 1998, 136, 105–110 CrossRef CAS.
- R. Rozada, J. I. Paredes, S. Villar-Rodil, A. Martinez-Alonso and J. M. D. Tascon, Nano Res., 2013, 6, 216–233 CrossRef CAS PubMed.
- H.-L. Hsu, I. J. Teng, Y.-C. Chen, W.-L. Hsu, Y.-T. Lee, S.-J. Yen, H.-C. Su, S.-R. Yeh, H. Chen and T.-R. Yew, Adv. Mater., 2010, 22, 2177–2181 CrossRef CAS PubMed.
- J. D. Andrade and V. Hlady, Adv. Polym. Sci., 1986, 79, 1–63 CrossRef CAS.
- D. L. Elbert and J. A. Hubbell, Annu. Rev. Mater. Sci., 1996, 26, 365–394 CrossRef CAS.
- I. C. Goncalves, M. C. L. Martins, J. N. Barbosa, P. Oliveira, M. A. Barbosa and B. D. Ratner, J. Mater. Sci. Mater. Med., 2011, 22, 2053–2063 CrossRef CAS PubMed.
- K. Kottkemarchant, J. M. Anderson, Y. Umemura and R. E. Marchant, Biomaterials, 1989, 10, 147–155 CrossRef CAS.
- B. Sivaraman and R. A. Latour, Biomaterials, 2010, 31, 1036–1044 CrossRef CAS PubMed.
- S. Udenfrie, S. Stein, P. Bohlen and W. Dairman, Science, 1972, 178, 871–872 Search PubMed.
- S. J. Geelhood, T. A. Horbett, W. K. Ward, M. D. Wood and M. J. Quinn, J. Biomed. Mater. Res., Part B, 2007, 81B, 251–260 CrossRef CAS PubMed.
- M. E. Soderquist and A. G. Walton, J. Colloid Interface Sci., 1980, 75, 386–397 CrossRef CAS.
- J. A. Chinn, S. E. Posso, T. A. Horbett and B. D. Ratner, J. Biomed. Mater. Res., 1992, 26, 757–778 CrossRef CAS PubMed.
Footnote |
| † Electronic supplementary information (ESI) available. See DOI: 10.1039/c4py00941j |
| This journal is © The Royal Society of Chemistry 2014 |

