Synthesis and volume phase transition of concanavalin A-based glucose-responsive nanogels†
Ting
Ye
,
Suting
Yan
,
Yumei
Hu
,
Li
Ding
and
Weitai
Wu
*
State Key Laboratory for Physical Chemistry of Solid Surfaces, The Key Laboratory for Chemical Biology of Fujian Province, and Department of Chemistry, College of Chemistry and Chemical Engineering, Xiamen University, Xiamen 361005, Fujian, China. E-mail: wuwtxmu@xmu.edu.cn; Fax: +86 592 2185862; Tel: +86 592 2185862
First published on 7th August 2013
Abstract
Glucose-responsive polymer nanogels that can undergo a reversible and rapid volume phase transition in response to the fluctuation in blood glucose concentration have the potential to regulate the delivery of insulin mimicking pancreatic activity. We report here such a glucose-responsive polymer nanogel, which is made of concanavalin A (ConA) interpenetrated in a chemically crosslinked network of poly(N-isopropylacrylamide) (poly(NIPAM)). The introduction of ConA, a plant lectin protein, into the poly(NIPAM) network makes the newly developed semi-interpenetrating-structured nanogels responsive to glucose over a glucose concentration range of 0–20 mM at a physiological pH of 7.4. While the nanogels can swell and become stable shortly (<1 s) after adding glucose over a concentration range of 50.0 μM to 20.0 mM, the changes in the average hydrodynamic radius and the size distribution of the nanogels can be fully reversible within the experimental error even after ten cycles of adding/removing glucose. The association rate constant is determined to be ca. 1.8 mM−1 s−1, and the dissociation rate constant is ca. 7.5 s−1, indicating a fast reversible time response to the glucose concentration change of the nanogels. Moreover, in vitro insulin release can be modulated in a pulsatile profile in response to glucose concentrations.
Introduction
Polymer gels with a three-dimensional crosslinked network structure are attractive as carriers due to their unique physical properties common to living tissues, including a soft and rubbery consistency, and low interfacial tension with water or biological fluids.1–13 Of particular interest are those stimuli-responsive “smart polymer gels” that can undergo a reversible and rapid volume phase transition in response to external stimuli, such as temperature, pH, light, and even electrical or magnetic field.14–20 If a stimuli-responsive gel is sensitive to the fluctuation in the concentration of a specific biomolecule, it can mimic biofeedback systems, thus providing both a functional and structural basis for self-regulated materials and systems for prospective biomedical applications.21–25Polymer gels with glucose-responsive features are becoming more and more important for treatment of diseases such as diabetes mellitus that are associated with the disruptions in the homeostasis of glucose concentrations in blood.22–25 Diabetes mellitus is not an infectious disease, but its rapidly increasing worldwide prevalence has been recognized as a pandemic, and thus diabetes mellitus poses a serious global health threat much like epidemics of truly infectious diseases.26 Despite the necessity for the continuous and accurate glucose control in the administration of type 1 diabetic patients and advanced type 2 diabetic patients, the current palliative treatment requires frequent self-monitoring of glucose concentrations and subsequent self-injection of insulin to achieve normoglycemia, also known as open-loop insulin delivery.26 Although the benefits are already apparent from the use of such self-administration, it not only impinges on the quality of life of the patient but also fails to precisely control the dose of insulin. It is reported that only approximately 20% of insulin reaches the liver (which is the primary site of action according to normal physiology) following the insulin injection.27 The lack of tight control of glucose concentrations accounts for many chronic complications of diabetes such as limb amputation, blindness, and kidney failure. Excess insulin in the body can lead to hypoglycemia, insulin resistance, and other unwanted side effects, resulting in risks of unconsciousness, brain damage, or death.28,29 In addition, there are challenges to accurate monitoring of daily fluctuations in glucose concentration in order to adjust the dose and dosing time of insulin. In this respect, earlier studies have been focused on developing closed-loop insulin delivery systems by using glucose-responsive bulky gels, which can integrate both a glucose-recognition moiety (e.g., glucose oxidase, lectins, and phenylboronic acids (PBA)) and an insulin storage/release matrix within one material.22–25,30–33 While the incorporation of a glucose-recognition moiety into the polymer gels can readily enable the polymer gels to demonstrate a volume phase transition in response to a glucose concentration change in the surrounding medium, the resulting changes in the mesh size of the polymer gels can modulate the release of insulin molecules that are physically imbibed in the gels. However, those bulky polymer gels as carriers need a long time to reach swelling/collapsing equilibrium.
Theoretically, the characteristic time period that describes the volume change of the polymer gels is approximately proportional to the square of the characteristic length of the gels.34 Thus, as an effective method among others to address the slow-time-response issue of the examples based on bulky polymer gels, our group and other groups have actively explored the feasibility of downsizing the glucose-responsive bulky gels into submicron and even nanogels since 2006.35–53 Most of those glucose-responsive micro-/nanogels use PBA as the glucose-recognition moiety. PBA covalently binds cis-diols to form thermodynamically more favorable 5-membered ring cyclic esters.54 While second scale swelling processes have indeed been determined for an individual PBA-based micro-/nanogel at an increasing glucose concentration, it usually takes a long time for the PBA-based micro-/nanogel to reach the deswelling equilibrium under the decreasing glucose concentration conditions, making it still difficult to deliver the demanded amount of insulin in response to a change in blood glucose concentration (in particular, a sharp increase in blood glucose concentration after a meal).54 Clearly, in order to use the glucose-responsive polymer gels as carriers in a living body ultimately, it is crucial to exploit new micro-/nanogels of reversible and rapid trigger modes as close to physiological conditions as possible.
In this work, we aim to develop a new class of glucose-responsive nanogels that can undergo a reversible and rapid volume phase transition in response to the disruptions in the homeostasis of glucose concentration. As schematically depicted in Scheme 1, this newly developed nanogel (denoted as ConA@poly(NIPAM)) is comprised of concanavalin A (ConA), as the glucose recognition moiety,30,54 which is interpenetrated in a chemically crosslinked network of poly(N-isopropylacrylamide) (poly(NIPAM)). ConA is a plant lectin protein that is extracted from Jack beans.55 The ConA tetramer consists of two dimers and has four binding sites for non-reducing D-glucose, D-mannose, and polysaccharides, among which the reactivity of D-glucose and D-mannose with ConA is stronger than that of other compounds with ConA. Such a specific structure of ConA is capable of inducing affinity gelation of polysaccharides or other polymers that contain glucose/mannose moieties, whereas free glucose can seize the specific binding sites of the ConA–polymer complex, leading to the dissociation of the complex and thus forming glucose-responsive systems. This responsive principle has been employed in the design of ConA-based glucose-responsive polymer gels for insulin delivery, ever since the first example reported in 1979.22–25,30 Herein, we show an alternative principle that the glucose-induced conformational change of the ConA interpenetrated in the polymer network can be used to trigger a volume phase transition of the presented ConA@poly(NIPAM) nanogel particle. More importantly, unlike the ConA–polymer complex gels reported previously that would suffer from poor stability because the unbound ConA tends to irreversibly aggregate,54 the presented nanogels possess good stability, setting a stage for a reversibly and rapidly glucose-responsive volume change. In addition, we show that these nanogels can modulate the in vitro delivery of pre-loaded insulin as a function of medium glucose concentration.
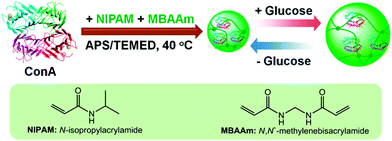 | ||
| Scheme 1 Schematic illustration of the synthesis of the glucose-responsive nanogels based on ConA, and the chemical structures of the key components. | ||
Experimental
Materials
The lyophilized human recombinant insulin (C257H338N65O77S6, 5807.69 daltons) was purchased from Tonghua Dongbao Pharmaceutical Co., and other chemicals were purchased from Aldrich. N-Isopropylacrylamide (NIPAM) was recrystallized from a hexane–acetone (1![[thin space (1/6-em)]](https://www.rsc.org/images/entities/char_2009.gif) :
:![[thin space (1/6-em)]](https://www.rsc.org/images/entities/char_2009.gif) 1 volume ratio) mixture and dried in a vacuum. Concanavalin A (ConA), N,N′-methylenebisacrylamide (MBAAm), sodium dodecyl sulfate (SDS), ammonium persulfate (APS), N,N,N′,N′-tetramethylenediamine (TEMED), dextran (Mr ∼ 6000), dextran (Mr ∼ 40
1 volume ratio) mixture and dried in a vacuum. Concanavalin A (ConA), N,N′-methylenebisacrylamide (MBAAm), sodium dodecyl sulfate (SDS), ammonium persulfate (APS), N,N,N′,N′-tetramethylenediamine (TEMED), dextran (Mr ∼ 6000), dextran (Mr ∼ 40![[thin space (1/6-em)]](https://www.rsc.org/images/entities/char_2009.gif) 000), dextran (Mr ∼ 100
000), dextran (Mr ∼ 100![[thin space (1/6-em)]](https://www.rsc.org/images/entities/char_2009.gif) 000), ribonuclease B (RNase B) from bovine pancreas (13
000), ribonuclease B (RNase B) from bovine pancreas (13![[thin space (1/6-em)]](https://www.rsc.org/images/entities/char_2009.gif) 700 daltons), D(+)-glucose, D(+)-mannose, D(−)-fructose, D(+)-galactose, and insulin were used as received without further purification. The water used in all experiments was of Millipore Milli-Q grade.
700 daltons), D(+)-glucose, D(+)-mannose, D(−)-fructose, D(+)-galactose, and insulin were used as received without further purification. The water used in all experiments was of Millipore Milli-Q grade.
Synthesis of the ConA@poly(NIPAM) nanogels
The ConA@poly(NIPAM) nanogels were prepared by free radical precipitation copolymerization of NIPAM and MBAAm using APS/TEMED as an initiating system in the presence of ConA. A mixture of NIPAM (1.200 g), ConA (0.036 g), MBAAm (0.075 g), SDS (0.050 g), and water (95 mL) was poured into a 250 mL three-neck round-bottom flask equipped with a stirrer, a nitrogen gas inlet, and a condenser. The mixture was heated to 40.0 °C under a N2 purge. After 30 min, APS (5 mL, 1.491 M) and TEMED (10 mL, 0.2 wt%) were added one by one at 10 min intervals to initiate the polymerization. The reaction was allowed to proceed for 5 h. The product was purified by centrifugation (Thermo Electron Co. SORVALL® RC-6 PLUS superspeed centrifuge; the same below), decantation, and then washed with water. The resulting ConA@poly(NIPAM) nanogels were further purified by 3 days of dialysis (Spectra/Por® molecular porous membrane tubing, cutoff 12![[thin space (1/6-em)]](https://www.rsc.org/images/entities/char_2009.gif) 000–14
000–14![[thin space (1/6-em)]](https://www.rsc.org/images/entities/char_2009.gif) 000 daltons; the same below) against very frequently changed water at room temperature (∼22 °C).
000 daltons; the same below) against very frequently changed water at room temperature (∼22 °C).
Dynamic laser light scattering (DLS) measurements
DLS was performed on a 90Plus multi angle particle sizing analyzer equipped with a BI-9000AT digital autocorrelator (Brookhaven Instruments, Inc.) to measure the average hydrodynamic radius 〈Rh〉 and the size distribution. A He–Ne laser (35 mW, 659 nm) was used as the light source. All nanogel dispersions were passed through Millipore Millex-HV filters with a pore size of 0.80 μm to remove dust before DLS measurements. In DLS, the Laplace inversion (here the CONTIN method was used) of each measured intensity–intensity time correlation function in a dilute dispersion can lead to a line-width distribution G(Γ). For a purely diffusive relaxation, Γ is related to the translational diffusion coefficient D by (Γ/q2)C→0,q→0 = D, so that G(Γ) can be converted to a translational diffusion coefficient distribution and 〈Rh〉 distribution by using the Stokes–Einstein equation, 〈Rh〉 = (kBT/6πη)/D, where kB, T, and η are the Boltzmann constant, the absolute temperature, and the solvent viscosity, respectively.56 All DLS measurements were made at a scattering angle θ = 90°.Response kinetics measurements
The response kinetics measurements were conducted on a Bio-Logic SFM300/S stopped-flow instrument equipped with a MOS-250 spectrometer, a temperature controller, and three 10 mL step-motor-driven syringes which can be operated independently to carry out single- or double-mixing. For light scattering detection at a scattering angle θ = 90° and at 37.0 °C, both the excitation and emission wavelengths were adjusted to 335 nm with 10 nm slits. Using either FC-08 or FC-15 flow cells, typical dead times are 1.1 ms and 2.6 ms, respectively. Both the nanogel dispersions and the glucose solutions were passed through Millipore Millex-HV filters with a pore size of 0.80 μm to remove dust before the response kinetics measurements. The final concentrations of the nanogels (50.0 μg mL−1) and glucose (50.0 μM to 20.0 mM) were controlled by varying the mixing ratio of the nanogel dispersion to the glucose solutions. Data collection commenced 3.0 ms after activating the pneumatic drive mechanism of the stopped flow apparatus. Each kinetic curve reported here represents an average of at least five consecutive mixing trials.Adsorption experiments
Adsorption of dextran and RNase B on the ConA@poly(NIPAM) nanogels was carried out by mixing dextran and RNase B in a phosphate buffer solution (PBS) (5.0 mM, pH 7.4) (V = 5.0 mL) at a given concentration (C0 = 44.0 g L−1) to a mass (mnanogels = 50.0 mg) of the nanogels in tubes at 37.0 °C. After being maintained for 24 h to reach equilibrium, the mixture was centrifuged (25 °C, 10![[thin space (1/6-em)]](https://www.rsc.org/images/entities/char_2009.gif) 000 rpm, and 30 min) and washed with water twice. The dextran/RNase B–nanogel complexes were collected and redispersed in PBS (5.0 mL) for analyzing the effect of adsorption of dextran/RNase B on the nanogels (as well as DLS tests; see above). Moreover, the dextran/RNase B concentration in the supernatant, CE, was determined using UV-vis absorption, based on the linear calibration curve (R2 > 0.99) measured using the solutions with known concentrations under the same conditions, for the calculation of surface density d of the protein:
000 rpm, and 30 min) and washed with water twice. The dextran/RNase B–nanogel complexes were collected and redispersed in PBS (5.0 mL) for analyzing the effect of adsorption of dextran/RNase B on the nanogels (as well as DLS tests; see above). Moreover, the dextran/RNase B concentration in the supernatant, CE, was determined using UV-vis absorption, based on the linear calibration curve (R2 > 0.99) measured using the solutions with known concentrations under the same conditions, for the calculation of surface density d of the protein: | (1) |
In vitro insulin uploading and release experiments
Insulin was loaded to the ConA@poly(NIPAM) nanogels by the complexation method. A fresh solution of insulin (1.0 mg mL−1) was prepared in PBS (5.0 mM, pH 5.1). The pH value of the nanogels (5.0 mL, [Glu] = 6.0 mM) was adjusted to 5.1 by using dilute HCl solution. This dispersion was stirred in an ice water bath for 30 min; insulin solution (1.0 mL) was then added dropwise to the vial. The immediate clouding revealed the hydrogen bonding complexation of insulin molecules with the nanogels. After stirring for 3 days, the suspension was centrifuged (6000 rpm, 30 min, and 37 °C). To remove free drug, the precipitate was redispersed in PBS (5.0 mL, pH 7.4) and further purified by repeated centrifugation and washing at 37 °C. Finally, the precipitate was re-dispersed in PBS (1.0 mL, pH 7.4) for the in vitro release test immediately (see below). All the upper clear solutions were collected, and the total insulin content was measured using a Coomassie Plus (Bradford) protein assay by UV-vis absorption spectrometry at 595 nm. The amount of loaded insulin in nanogels was calculated from the decrease in drug concentration. The loading content is expressed as the mass of loaded drug per unit weight of dried nanogels.The in vitro release of insulin from the nanogels was evaluated by the dialysis method. A dialysis bag filled with 1.0 mL of a purified insulin-loaded nanogel dispersion was immersed in PBS (50.0 mL, pH 7.4) at 37.0 °C and at various glucose concentrations. The released insulin outside of the dialysis bag was sampled at defined time intervals and measured using a Coomassie Plus (Bradford) protein assay by UV-vis absorption spectrometry at 595 nm. The cumulative release is expressed as the total percentage of drug released through the dialysis membrane over time. The release experiments were also performed to show the evolution of the release kinetics in response to glucose concentration changes.
To evaluate the nanogels' ability to adapt to cyclical changes in glucose concentrations, the nanogel sample was first incubated in PBS (50.0 mL, pH 7.4) containing 6.0 mM glucose for 30 min at 37.0 °C. At that point, the dialysis bag containing the sample was taken out. The dialysis bag containing the sample was washed twice with PBS and then incubated in fresh PBS (50.0 mL, pH 7.4) containing 15.0 mM glucose for another 30 min. This cycle was repeated numerous times. Similarly, the insulin concentration was determined using the Coomassie Plus protein assay.
In vitro cytotoxicity
The cytotoxicity tests were carried out by following the method reported previously by our group.39 Cos-7 cells were plated in Dulbecco's modified Eagle medium (DMEM) with 10% fetal calf serum (FCS) at 1.0 × 10⁴ cells per well in two 96-well plates and allowed to grow overnight at 37 °C in a 5% CO2 incubator. The following day, the media were aspirated from the wells and the cells were treated with various concentrations of nanogels suspended in growing media, using three wells per concentration. The percentage of DMEM and FCS was kept constant in each well. The plate was assayed 24 hours after nanogel addition. To estimate the amount of cell death, the wells were washed twice with phosphate-buffered saline, followed by the addition of 120.0 μL of 16.7% CellTiter 96® Aqueous One Solution to cell culture media in each well and further incubation at 37 °C in 5% CO2. After 4 hours, three portions of the solution obtained from each well were transferred to three respective wells of a 96-well plate. Absorbance was measured at 490 nm using a plate reader. The percentage of live cells was calculated relative to wells under similar media conditions to the experimental wells but without any nanogels. The tests on the cytotoxicity of free ConA were also performed following the same method, but by simply replacing nanogels with free ConA.Other characterizations
FTIR spectra were recorded at 37.0 °C using a Thermo Electron Corporation Nicolet 380 Fourier transform infrared spectrometer. TEM images were taken on a JEOL JEM-2100 transmission electron microscope at an accelerating voltage of 200 kV. The pH values were measured on a EUTECH PH 700 instruments.Results and discussion
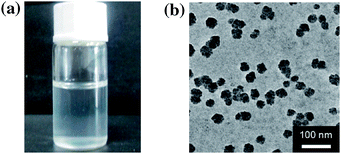
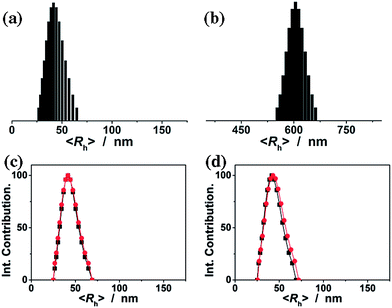
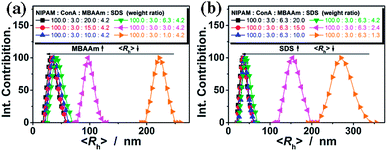
The ConA@poly(NIPAM) nanogels were prepared by direct polymerization of the NIPAM monomers and the crosslinker MBAAm initiated by APS/TEMED (as a redox initiator system, where the TEMED catalyses the decomposition of the persulfate ion to give sulfate free radicals which initiate the polymerization of monomers) in the ConA aqueous solution in the presence of the surfactant SDS at 40.0 °C. The preparation of nearly monodisperse poly(NIPAM) nanogels, which has a lower critical solution temperature around ∼32 °C in water,14 has been well-established from the precipitation polymerization in water.38–44 NIPAM can complex with ConA through the hydrogen bonding between the amide groups of NIPAM and the amino groups of ConA (see below).57 The polymerization and cross-linking of the NIPAM monomers that are complexed with ConA can result in narrowly distributed gel particles with a chemically cross-linked poly(NIPAM) network interpenetrated by ConA. At the end of polymerization, a light-white colour was observed in the dispersion (Fig. 1a). The TEM image shown in Fig. 1b displays a typically spherical shape of the obtained ConA@poly(NIPAM) nanogels.Fig. 2a shows the DLS size distribution of the ConA@poly(NIPAM) nanogels. A narrow size distribution range from 26 to 65 nm is observed and the average hydrodynamic radius (〈Rh〉) is determined to be 46 nm. The nanogels can be well reproducible from batch to batch, with a high yield of ≥92%. Meanwhile, a nanogel (serving as a control) without chemical cross-linkage was also prepared following the procedures for the synthesis of the presented ConA@poly(NIPAM) nanogels, except that MBAAm was not added. From Fig. 2b, it can be seen that the 〈Rh〉 of uncrosslinked nanogels (605 nm) is much larger than that of the ConA@poly(NIPAM) nanogels, suggesting that the cross-linking reaction further solidifies and stabilizes the ConA@poly(NIPAM) nanogels; this is also supported by the fact that after dialysis against water, the opalescent solution was retained for the ConA@poly(NIPAM) nanogels, while the solution became completely colorless for uncrosslinked nanogels. The size of the cross-linked nanogels is tunable. An increase in the feeding amount of the crosslinker MBAAm (Fig. 3a), or the surfactant SDS (Fig. 3b), in the synthesis can significantly reduce the 〈Rh〉 of the nanogels. All the cross-linked nanogels showed good stability, with the size distribution being nearly the same before and after dialysis (Fig. 2c; also see below), or even before and after 2 months of storage at room temperature (Fig. 2d). The good stability of the chemically cross-linked nanogels is a key parameter in the following characterization of the responsive volume phase transition, as well as their potential use in regulating the diffusion and releasing of the trapped drug molecules.
FTIR spectroscopy was used to confirm the structure of the purified ConA@poly(NIPAM) nanogels. In FTIR spectra (Fig. 4a, and S1 in the ESI; also see Fig. S2 in the ESI† for FTIR spectra of ConA and NIPAM), the characteristic bands of the carbonyl stretching vibration (amide I) at 1658 cm−1 and N–H bending vibration (amide II) at 1547 cm−1, as well as two typical bands of C–H vibrations of –CH(CH3)2 at 1385 cm−1 and 1367 cm−1, of NIPAM units were recorded. After interpenetration by ConA, the nanogels display additional characteristic amide I bands of ConA at 1650 cm−1 and 1634 cm−1, which are consistent with the bands for a β-structure of ConA.55 FTIR analysis also confirmed the strong hydrogen bonding between the amide groups of NIPAM and the amino groups of ConA with a blue-shift of the N–H stretching vibration band at 3407 cm−1, in comparison with those of pure ConA (3385 cm−1) and NIPAM (3303 cm−1).
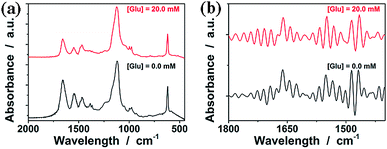 | ||
| Fig. 4 (a) FTIR spectra of the ConA@poly(NIPAM) nanogels in the absence (0.0 mM) and presence (20.0 mM) of glucose, and (b) the same spectra after resolution enhancement by deconvolution. | ||
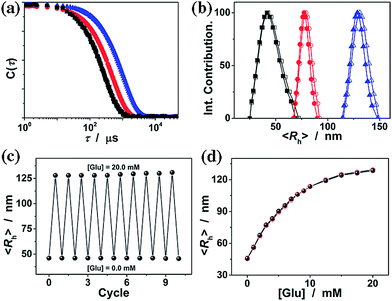
It is known that ConA can bind glucose with the D-arabino configuration at carbons 3, 4 and 5 and unmodified hydroxyl groups at carbons 3, 4 and 6.55Fig. 4a compares the FTIR spectra of the ConA@poly(NIPAM) nanogels in the absence (with the glucose concentration [Glu] = 0.0 mM) and the presence ([Glu] = 20.0 mM) of glucose. Upon adding glucose, one can observe a decrease in the width of the amide I bands of ConA, and an apparent displacement of the whole bands toward lower wavenumbers. Details of these changes are clearly revealed by the deconvolution spectra in Fig. 4b, which shows that there is no change in the position of the amide I band of NIPAM units at 1658 cm−1; however, the major amide I band of ConA at 1650 cm−1 shifts to 1642 cm−1, as well as the red-shift of 1634 cm−1 to 1624 cm−1. The spectral changes were also confirmed by the derivation spectra of enhanced resolution (Fig. S3 in the ESI†). Similar phenomena on the red-shift of the amide I band have been found on the apo-ConA upon demetallization.58 It is reported that the small spectral changes in the amide I band cannot represent major changes in the secondary structure, however, they are sufficient to suggest a general “loosening” of the tightly packed structure with some rearrangement of the hydrogen bonding.58,59 The small spectral change in our cases may thus imply a volume change of the involved ConA@poly(NIPAM) nanogels. We then examined the effect of the concentration of glucose on the ConA@poly(NIPAM) nanogels by using DLS, which is a powerful tool to in situ study volume phase transition behaviour of polymer gel particles in solutions. Fig. 5a shows the DLS intensity autocorrelation functions (C(τ)) for the ConA@poly(NIPAM) nanogels dispersed in solutions with different glucose concentrations of [Glu] = 0.0, 3.0, and 20.0 mM. In the absence of glucose ([Glu] = 0.0 mM), the diffusion coefficient (D) was 1.9 × 10⁻⁷ cm2 s−1, corresponding to a 〈Rh〉 of 46 nm (Fig. 5b); interestingly, increasing the [Glu] to 3.0 mM and 20.0 mM decreased D to 1.0 × 10⁻⁷ cm2 s−1 and 5.2 × 10⁻⁸ cm2 s−1, respectively, indicating an increase in the 〈Rh〉 to 77 nm and 128 nm correspondingly. The increased 〈Rh〉 at the higher [Glu] verified the swelling of the nanogels upon adding glucose. The swelling ratio, in terms of 〈Rh〉20.0 mM/〈Rh〉0.0 mM, is determined to be 2.8. Since the complexes between ConA and glucose molecules appear to involve charge–dipole and hydrogen-bond interactions, these non-covalent complexing manners should make the association/dissociation fully reversible.55 As glucose is removed from the bathing medium by dialysis against very frequently changed water, the breakage of the ConA–glucose non-covalent bond complexes occurs, leading to a full recovery of the 〈Rh〉 (99–102% of the original basal value) within the experimental error even after ten cycles of adding and removing glucose (Fig. 5b and c). A detailed study further indicates that the swelling/shrinking processes of the nanogels upon adding/removing glucose can elegantly occur over a clinically relevant range (0–20 mM) at a physiological pH of 7.4 (Fig. 5d). The reversibility of the glucose-responsive volume phase transition is clearly demonstrated by the perfect match of the adding and removing glucose curves, as well as the repeatable size distribution during adding/removing glucose cycles. Therefore, these results can not only provide direct proof for the glucose-responsive volume change of the ConA@poly(NIPAM) nanogels, but also foreshadow a novel class of glucose-responsive nanogels.
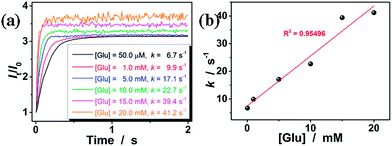
To estimate the response time of the glucose-responsive volume phase transition that is potentially achievable, we have monitored the response kinetics based on the scattered light intensity (I) change of the ConA@poly(NIPAM) nanogel dispersions after adding different concentrations of glucose. As shown in Fig. 6a, upon adding glucose, the relative scattered light intensity (It/I0, where It is the scattered light intensity at a certain time t, and I0 at t = 3.0 ms after mixing) of the nanogel dispersions increased immediately and then leveled off gradually. The It/I0 became stable shortly (<1 s) after the addition of glucose over a glucose concentration range 50.0 μM to 20.0 mM. The higher the glucose concentration, the faster the kinetics of the glucose-response. For example, when [Glu] = 20.0 mM, the It/I0 can become stable within 0.2 s. Assuming the glucose-responsive volume phase transition of the nanogels and the corresponding scattering light variation follow the first order kinetics,60 the apparent rate constants (k) can be derived from the fitting of the time dependent It/I0 (Fig. S4 in the ESI†). The k was thus determined to be ca. 41.2 s−1 at [Glu] = 20.0 mM. The linear fitting of the k–[Glu] plot (Fig. 6b) results in the association rate constant k1 of ca. 1.8 mM−1 s−1 (obtained from the slope of the linear plot) and the dissociation rate constant k2 of ca. 7.5 s−1 (obtained from the intercept), indicating a fast reversible time response to the glucose concentration change of the nanogels. In this important feature lies the great potential of the nanogels for continuous glucose monitoring related applications.
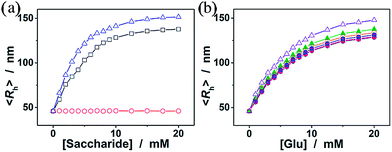
We now turn our attention to the potential response of the ConA@poly(NIPAM) nanogels to some other monosaccharides, such as fructose, mannose, and galactose, which are naturally occurring typical stereoisomers of glucose. As shown in Fig. 7a, the nanogels gave a neglectable change in the overall response to galactose, due to the fact that the Con A chains show no affinity towards the galactose molecule because of the destruction of 4-OH.55 In contrast, the swelling process of the nanogels upon adding fructose or mannose can elegantly occur over the investigated concentration window (0–20 mM), due to the high affinity of the ConA to the D-arabino configuration of these monosaccharides.46 The swelling ratio, 〈Rh〉20.0 mM/〈Rh〉0.0 mM, was found to be 3.0 and 3.3 for the addition of fructose and mannose, respectively, demonstrating a much higher sensitivity of the nanogels to mannose over fructose, and over glucose. It is thus probable that fructose and mannose would be the primary interferences if the nanogels were used as glucose-responsive materials in bio-systems. Fig. 7b shows the impact of a range of fructose and mannose concentrations (50.0 μM to 1.0 mM) on the glucose-responsive volume phase transition of the nanogels. The competitive binding of fructose or mannose to the ConA in the nanogels reduces the glucose binding degree, thus decreases the sensitivity of the nanogels in response to glucose. The deviations become more pronounced at the higher fructose or mannose concentrations. However, since the physiological level of fructose and mannose in the blood of all mammals is ≤0.1 mM,61 the data in Fig. 7b indicate that the nanogels serving as glucose-responsive materials should be free from significant interferences of fructose and mannose, as there was <2% variation in the glucose-responsive volume change in the presence of 0.1 mM fructose or mannose.
Besides monosaccharides, we also checked the binding of the ConA@poly(NIPAM) nanogels to dextran (Mr ∼ 6000), dextran (Mr ∼ 40![[thin space (1/6-em)]](https://www.rsc.org/images/entities/char_2009.gif) 000), dextran (Mr ∼ 100
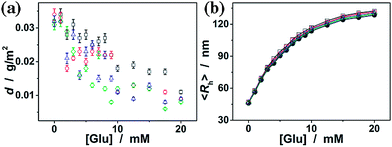
000), dextran (Mr ∼ 100![[thin space (1/6-em)]](https://www.rsc.org/images/entities/char_2009.gif) 000), and RNase B, since those polysaccharides/glycoproteins also contain glycosyl or mannosyl residues of the D-arabino configuration. Fig. 8a shows that dextran and RNase B can indeed adsorb onto the nanogels, whereas only a low adsorption level was recorded (with the surface density d < 0.04 g m−2). Dextran and RNase B are relatively large molecules. It is possible that they would only bind the ConA located at the light penetration depth of the nanogels, and the initial binding of dextran or RNase B would subsequently hinder the accessibility of ConA to more dextran or RNase B molecules. Thus it is unlikely that those polysaccharides/glycoproteins will interfere significantly with the glucose-response of the nanogels. The low level adsorption of dextran and RNase B to the nanogels only caused a slightly larger glucose-responsive swelling degree (Fig. 8b; <103% of the 〈Rh〉 values of the nanogels in the absence of any dextran or RNase B).
000), and RNase B, since those polysaccharides/glycoproteins also contain glycosyl or mannosyl residues of the D-arabino configuration. Fig. 8a shows that dextran and RNase B can indeed adsorb onto the nanogels, whereas only a low adsorption level was recorded (with the surface density d < 0.04 g m−2). Dextran and RNase B are relatively large molecules. It is possible that they would only bind the ConA located at the light penetration depth of the nanogels, and the initial binding of dextran or RNase B would subsequently hinder the accessibility of ConA to more dextran or RNase B molecules. Thus it is unlikely that those polysaccharides/glycoproteins will interfere significantly with the glucose-response of the nanogels. The low level adsorption of dextran and RNase B to the nanogels only caused a slightly larger glucose-responsive swelling degree (Fig. 8b; <103% of the 〈Rh〉 values of the nanogels in the absence of any dextran or RNase B).
Having demonstrated the reversible and rapid glucose-response of the ConA@poly(NIPAM) nanogels with minimal interferences from common non-glucose constituents, we finally tested the insulin loading and release performance with those nanogels as carriers in view of their potential biomedical applications. Giving that the ConA@poly(NIPAM) nanogels might only have a low level adsorption of insulin if insulin was loaded to the nanogels by the same adsorption method as that of dextran/RNase B, two arrangements have been made to the uploading procedures of insulin so as to enhance the drug loading capability. Firstly, insulin was loaded to the permeable mesh of the nanogel particle by co-incubation at a low temperature of ∼4 °C (rendering a swollen status of the nanogels; see Fig. S5 in the ESI†) for a prolonged time of 3 days.39 Secondly, the pH value (pH = 5.1) of the co-incubation medium was adjusted to around the isoelectric point (pH = 5.0–5.3)16 of insulin, so as to enhance the hydrogen bonding between the amide groups of poly(NIPAM) and the carboxylate groups of insulin,31,39 whilst decreasing the electrostatic repulsion either among the deprotonated carboxylate groups (at pH > pI) or the protonated amine groups (at pH < pI) of insulin. Moreover, at pH ≈ pI, the insulin molecule adopts a relatively compact structure,25 which should also favour the diffusion of the insulin molecule into the expanded mesh of the nanogel particle. After the co-incubation, the insulin-loaded nanogels were purified at 37 °C (rendering a collapsed status of the nanogels; see Fig. 5d and S5 in the ESI†) and pH = 7.4 (reducing the hydrogen bonding between the amide groups of poly(NIPAM) and the carboxylate groups of insulin), to ensure the encapsulation of the insulin molecule within the nanogel particle mainly via a physical restriction effect of the polymer network. The yield of insulin loaded into the nanogels was determined to be ca. 39.8 wt% (expressed as the mass of loaded drug per unit weight of dried nanogels), i.e., ca. 10.3 IU mg−1 nanogels. Considering the approximate concentration of the nanogel dispersions, this insulin loading capability is equivalent to ca. 403.8 IU L−1. It should be noted that the insulin-loaded nanogels can be concentrated and adjusted to an appropriate concentration to cover an even higher dose.
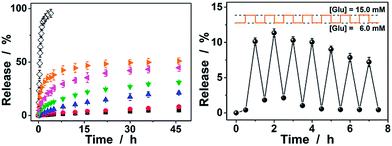
Since the diffusion of the physically encapsulated molecules through a gel network is dependent on the changes in mesh size caused by the volume phase transition of the gel,25,62 the ConA@poly(NIPAM) nanogels should be effective in bringing about a controlled release. Fig. 9a shows the in vitro insulin releasing profiles from the preloaded nanogels measured by the dialysis method in pH = 7.4 PBS at 37.0 °C. A blank release experiment of free insulin (5807.69 daltons) solution with an equivalent amount of drug to that encapsulated in the nanogels was also performed, showing that the dialysis membrane (cutoff 12![[thin space (1/6-em)]](https://www.rsc.org/images/entities/char_2009.gif) 000–14
000–14![[thin space (1/6-em)]](https://www.rsc.org/images/entities/char_2009.gif) 000 daltons) played a negligible role in the release kinetics. Accumulated insulin release studies were performed and limited insulin release from the nanogels was observed within 2 days of incubation at a normal glucose concentration (6.0 mM) and glucose-free PBS. In contrast, faster insulin release was achieved from the nanogels under the hyperglycemic environments (≥7.0 mM), and the release can be regulated by varying the glucose concentration in the releasing medium. The time scales for insulin delivery are compatible with the patient's needs, since the nanogels could deliver insulin in less than 30 min, and the sustained release over 2 days may also meet the basal needs.26 Furthermore, the insulin release profile of nanogels presented a pulsatile pattern when the glucose concentration was cyclically varied between a normal (6.0 mM) and a hyperglycemic concentration (15.0 mM) every 30 min for several repetitions (Fig. 9b). The nanogels responded to the changes in glucose concentration, and a maximum ca. 10-fold increase in the insulin release rate was obtained when the glucose concentration was switched to the hyperglycemic concentration. Collectively, these results point to the volume phase transition of the nanogels and the subsequent insulin release is a glucose-responsive process. Although the current results are obtained from in vitro studies, their characteristics for self-regulated insulin delivery could be extremely important in the treatment of diseases.
000 daltons) played a negligible role in the release kinetics. Accumulated insulin release studies were performed and limited insulin release from the nanogels was observed within 2 days of incubation at a normal glucose concentration (6.0 mM) and glucose-free PBS. In contrast, faster insulin release was achieved from the nanogels under the hyperglycemic environments (≥7.0 mM), and the release can be regulated by varying the glucose concentration in the releasing medium. The time scales for insulin delivery are compatible with the patient's needs, since the nanogels could deliver insulin in less than 30 min, and the sustained release over 2 days may also meet the basal needs.26 Furthermore, the insulin release profile of nanogels presented a pulsatile pattern when the glucose concentration was cyclically varied between a normal (6.0 mM) and a hyperglycemic concentration (15.0 mM) every 30 min for several repetitions (Fig. 9b). The nanogels responded to the changes in glucose concentration, and a maximum ca. 10-fold increase in the insulin release rate was obtained when the glucose concentration was switched to the hyperglycemic concentration. Collectively, these results point to the volume phase transition of the nanogels and the subsequent insulin release is a glucose-responsive process. Although the current results are obtained from in vitro studies, their characteristics for self-regulated insulin delivery could be extremely important in the treatment of diseases.
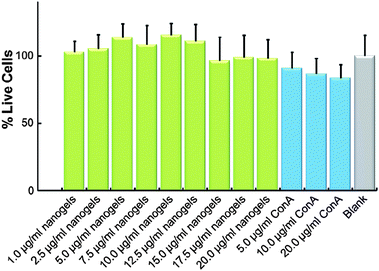
For future biomedical applications, the nanogels as carriers should be non- or low-cytotoxic. Assuming a required delivery of 24 IU per day, the therapeutic amount of our ConA@poly(NIPAM) nanogels need only be 4.8–16.0 mg after taking account of the release amount. A typical adult has a blood volume between 4.7 and 5.0 L, with females generally having a smaller blood volume than males.61 That is, the concentration of the nanogels used in the blood stream could be less than 3.4 μg mL−1. As shown in Fig. 10, the ConA@poly(NIPAM) nanogels showed non- or low-cytotoxicity to Cos-7 cells after incubation for 24 h at concentrations of up to 20.0 μg mL−1. Considering the possibility of degradation of the polymer gels during the long circulation, the potential cytotoxicity of free ConA was also addressed. Once again, free ConA exhibited low cytotoxicity at all the studied concentrations.
Conclusion
A novel class of glucose-responsive nanogels with ConA interpenetrated in a chemically crosslinked poly(NIPAM) network can be successfully synthesized from the precipitation polymerization of NIPAM monomers in ConA aqueous solution at a low temperature of 40.0 °C. The increase in the feeding amount of the crosslinker MBAAm, or the surfactant SDS, in the synthesis can significantly reduce the 〈Rh〉 of the nanogels. All those nanogels showed good stability. The newly developed semi-interpenetrating-structured nanogels can undergo a reversible and rapid volume phase transition in response to the disruptions in the homeostasis of glucose concentration at physiological pH and temperature. While the nanogels can swell and become stable shortly (<1 s) after adding glucose over a glucose concentration range of 50.0 μM to 20.0 mM, the changes in the 〈Rh〉 and the size distribution of the nanogels can be fully reversible within the experimental error even after ten cycles of adding/removing glucose. The association rate constant is determined to be ca. 1.8 mM−1 s−1, and the dissociation rate constant is ca. 7.5 s−1, indicating a fast reversible time response to the glucose concentration change of the nanogels. While the porous network structure of the nanogels can provide high insulin loading capacity, the reversible and rapid volume change of the nanogels as a function of media glucose concentration can regulate the drug release and thereby can enable a self-regulated strategy for insulin delivery. Such a novel class of glucose-responsive nanogels may find important biomedical applications.Acknowledgements
This work is supported by the NSFC (21274118, 91227120, and 20923004), FRFCU (2012121016), NFFTBS (J1210014), and NCETFJ.Notes and references
- J. P. Gong, Y. Katsuyama, T. Kurokawa and Y. Osada, Adv. Mater., 2003, 15, 1155 CrossRef CAS.
- B. V. Slaughter, S. S. Khurshid, O. Z. Fisher, A. Khademhosseini and N. A. Peppas, Adv. Mater., 2009, 21, 3307 CrossRef CAS PubMed.
- D. Roy, J. N. Cambre and B. S. Sumerlin, Prog. Polym. Sci., 2010, 35, 278 CrossRef CAS PubMed.
- Q. G. Wang, J. L. Mynar, M. Yoshida, E. Lee, M. Lee, K. Okuro, K. Kinbara and T. Aida, Nature, 2010, 463, 339 CrossRef CAS PubMed.
- J.-Y. Sun, X. H. Zhao, W. R. K. Illeperuma, O. Chaudhuri, K. H. Oh, D. J. Mooney, J. J. Vlassak and Z. G. Suo, Nature, 2012, 489, 133 CrossRef CAS PubMed.
- X. Yan, D. Xu, X. Chi, J. Chen, S. Dong, X. Ding, Y. Yu and F. H. Huang, Adv. Mater., 2012, 24, 362 CrossRef CAS PubMed.
- S. Dong, B. Zheng, D. Xu, X. Yan, M. Zhang and F. H. Huang, Adv. Mater., 2012, 24, 3191 CrossRef CAS PubMed.
- M. Zhang, D. Xu, X. Yan, J. Chen, S. Dong, B. Zheng and F. H. Huang, Angew. Chem., Int. Ed., 2012, 51, 7011 CrossRef CAS PubMed.
- B. Zheng, F. Wang, S. Dong and F. H. Huang, Chem. Soc. Rev., 2012, 41, 1621 RSC.
- X. Yan, F. Wang, B. Zheng and F. H. Huang, Chem. Soc. Rev., 2012, 41, 6042 RSC.
- X. Ji, Y. Yao, J. Li, X. Yan and F. H. Huang, J. Am. Chem. Soc., 2013, 135, 74 CrossRef CAS PubMed.
- X. Yan, D. Xu, J. Chen, M. Zhang, B. Hu, Y. Yu and F. H. Huang, Polym. Chem., 2013, 4, 3312 RSC.
- G. Yu, X. Yan, C. Han and F. H. Huang, Chem. Soc. Rev., 2013, 42, 6697 RSC.
- C. Wu and S. Q. Zhou, Macromolecules, 1997, 30, 574 CrossRef CAS.
- R. Pelton, Adv. Colloid Interface Sci., 2000, 85, 1 CrossRef CAS.
- C. M. Nolan, M. J. Serpe and L. A. Lyon, Biomacromolecules, 2004, 5, 1940 CrossRef CAS PubMed.
- S. Chaterji, I. K. Kwon and K. Park, Prog. Polym. Sci., 2007, 32, 1083 CrossRef CAS PubMed.
- B. H. Tan and K. C. Tam, Adv. Colloid Interface Sci., 2008, 136, 25 CrossRef CAS PubMed.
- M. A. C. Stuart, W. T. S. Huck, J. Genzer, M. Müller, C. Ober, M. Stamm, G. B. Sukhorukov, I. Szleifer, V. V. Tsukruk, M. Urban, F. Winnik, S. Zauscher, I. Luzinov and S. Minko, Nat. Mater., 2010, 9, 101 CrossRef PubMed.
- A. Döring, W. Birnbaum and D. Kuckling, Chem. Soc. Rev., 2013, 42, 7391 RSC.
- R. A. Siegel, Y. D. Gu, M. Lei, A. Baldi, E. E. Nuxoll and B. Ziaie, J. Controlled Release, 2010, 141, 303 CrossRef CAS PubMed.
- V. Ravaine, C. Ancla and B. Catargi, J. Controlled Release, 2008, 132, 2 CrossRef CAS PubMed.
- K. M. Bratlie, R. L. York, M. A. Invernale, R. Langer and D. G. Anderson, Adv. Healthcare Mater., 2012, 1, 267 CrossRef CAS PubMed.
- Z. Gu, A. A. Aimetti, Q. Wang, T. T. Dang, Y. Zhang, O. Veiseh, H. Cheng, R. Langer and D. G. Anderson, ACS Nano, 2013, 7, 4194 CrossRef CAS PubMed.
- W. T. Wu and S. Q. Zhou, Macromol. Biosci., 2013 DOI:10.1002/mabi.201300120.
- American Diabetes Association, Diabetes Care, 2013, 36, S11 CrossRef PubMed.
- C. Damge, C. Pinto and P. Maincent, Expert Opin. Drug Delivery, 2008, 5, 45 CrossRef CAS PubMed.
- G. Boden, P. Cheung and C. Homko, Diabetes, 2003, 52(1), 133 CrossRef CAS.
- M. C. Villeneuve, R. E. Ostlund Jr and J. P. Baillargeon, Metabolism, 2009, 58(1), 62 CrossRef CAS PubMed.
- E. Kokufata, Y.-Q. Zhang and T. Tanaka, Nature, 1991, 351, 302 CrossRef CAS.
- D. Shiino, Y. Murata, K. Kataoka, Y. Koyama, M. Yokoyama, T. Okano and Y. Sakurais, Biomaterials, 1994, 15, 121 CrossRef CAS.
- K. Kataoka, H. Miyazaki, M. Bunya, T. Okano and Y. Sakurai, J. Am. Chem. Soc., 1998, 120, 12694 CrossRef CAS.
- A. Matsumoto, T. Ishii, J. Nishida, H. Matsumoto, K. Kataoka and Y. Miyahara, Angew. Chem., Int. Ed., 2012, 51, 2124 CrossRef CAS PubMed.
- T. Tanaka and D. J. Fillmore, J. Chem. Phys., 1979, 70, 1214 CrossRef CAS.
- Y. J. Zhang, Y. Guan and S. Q. Zhou, Biomacromolecules, 2006, 7, 3196 CrossRef CAS PubMed.
- V. Lapeyre, I. Gosse, S. Chevreux and V. Ravaine, Biomacromolecules, 2006, 7, 3356 CrossRef CAS PubMed.
- Y. J. Zhang, Y. Guan and S. Q. Zhou, Biomacromolecules, 2007, 8, 3842 CrossRef CAS PubMed.
- W. T. Wu, T. Zhou, J. Shen and S. Q. Zhou, Chem. Commun., 2009, 4390 RSC.
- W. T. Wu, N. Mitra, E. C. Y. Yan and S. Q. Zhou, ACS Nano, 2010, 4, 4831 CrossRef CAS PubMed.
- W. T. Wu, T. Zhou, M. Aiello and S. Q. Zhou, Biosens. Bioelectron., 2010, 25, 2603 CrossRef CAS PubMed.
- Y. M. Hu, X. M. Jiang, L. Y. Zhang, J. Fan and W. T. Wu, Biosens. Bioelectron., 2013, 48, 94 CrossRef CAS PubMed.
- W. T. Wu, S. M. Chen, Y. M. Hu and S. Q. Zhou, J. Diabetes Sci. Technol., 2012, 6(4), 892 Search PubMed.
- W. T. Wu, J. Shen, Y. X. Li, H. B. Zhu, P. Banerjee and S. Q. Zhou, Biomaterials, 2012, 33, 7115 CrossRef CAS PubMed.
- J. Fan, X. M. Jiang, Y. M. Hu, Y. Si, L. Ding and W. T. Wu, Biomater. Sci., 2013, 1, 421 RSC.
- T. Hoare and R. Pelton, Macromolecules, 2007, 40, 670 CrossRef CAS.
- T. Hoare and R. Pelton, Biomacromolecules, 2008, 9, 733 CrossRef CAS PubMed.
- V. Lapeyre, C. Ancla, B. Catargi and V. Ravaine, J. Colloid Interface Sci., 2008, 327, 316 CrossRef CAS PubMed.
- Z. Wu, S. Zhang, X. Zhang, S. Shu, T. Chu and D. Yu, J. Pharm. Sci., 2011, 100, 2278 CrossRef CAS PubMed.
- L. Sun, X. Zhang, C. Zheng, Z. Wu, X. Xia and C. Li, RSC Adv., 2012, 2, 9904 RSC.
- Z. Wu, X. Zhang, H. Guo, C. Li and D. Yu, J. Mater. Chem., 2012, 22, 22788 RSC.
- H. Kim, Y. J. Kang, E. S. Jeong, S. Kang and K. T. Kim, ACS Macro Lett., 2012, 1, 1194 CrossRef CAS.
- H. Kim, Y. J. Kang, S. Kang and K. T. Kim, J. Am. Chem. Soc., 2012, 134, 4030 CrossRef CAS PubMed.
- G. Liu, R. Ma, J. Ren, Z. Li, H. Zhang, Z. Zhang, Y. An and L. Shi, Soft Matter, 2013, 9, 1636 RSC.
- M.-S. Steiner, A. Duerkop and O. S. Wolfbeis, Chem. Soc. Rev., 2011, 40, 4805 RSC.
- H. Lis and N. Sharon, Chem. Rev., 1998, 98, 637 CrossRef CAS PubMed.
- B. Chu, Laser Light Scattering, Academic Press, New York, 2nd edn, 1991 Search PubMed.
- S. J. Grabowski, Chem. Rev., 2011, 111, 2597 CrossRef CAS PubMed.
- J. L. R. Arrondo, N. M. Young and H. H. Mantsch, Biochim. Biophys. Acta, 1988, 952, 261 CrossRef CAS.
- A. Dong, P. Huang and W. S. Caughey, Biochemistry, 1990, 29, 3303 CrossRef CAS.
- P. Thordarson, Chem. Soc. Rev., 2011, 40, 1305 RSC.
- C. A. Burtis and E. R. Ashwood, Tietz Textbook of Clinical Chemistry, Saunders, W.B., Philadelphia, PA, 3rd edn, 1999 Search PubMed.
- A. M. Lowman, T. D. Dziubla, P. Bures and N. A. Peppas, Adv. Chem. Eng., 2004, 29, 75 CrossRef CAS.
Footnote |
| † Electronic supplementary information (ESI) available: FTIR and DLS data. See DOI: 10.1039/c3py00778b |
| This journal is © The Royal Society of Chemistry 2014 |

