Fabrication of dense two-dimensional assemblies over vast areas comprising gold(core)–silver(shell) nanoparticles and their surface-enhanced Raman scattering properties†
Kosuke
Sugawa
*a,
Yoshimasa
Tanoue
a,
Takuji
Ube
b,
Sayaka
Yanagida
b,
Takahiro
Yamamuro
a,
Yasuyuki
Kusaka
c,
Hirobumi
Ushijima
c and
Tsuyoshi
Akiyama
*d
aCollege of Science and Technology, Nihon University, 1-8-14 Kanda Surugadai, Chiyoda-ku, Tokyo 101-8308, Japan. E-mail: sugawa.kosuke@nihon-u.ac.jp
bDepartment of Material Science and Technology, Tokyo University of Science, 6-3-1 Niijuku, Katsushika-ku, Tokyo 125-8585, Japan
cFlexible Electronics Research Center, National Institute of Advanced Industrial Science and Technology (AIST), Higashi 1-1-1, Tsukuba, Ibaraki 305-8565, Japan
dDepartment of Materials Science, School of Engineering, The University of Shiga Prefecture, 2500 Hassaka-cho, Hikone-City, Shiga 522-8533, Japan. E-mail: akiyama.t@mat.usp.ac.jp
First published on 31st October 2013
Abstract
Fabrication of dense two-dimensional assemblies consisting of gold(core)–silver(shell) nanoparticles and the resulting peculiar surface-enhanced Raman scattering (SERS) activity are reported. The assemblies were prepared via assembly at air–toluene interfaces by drop-casting toluene solutions containing the nanoparticles protected with octadecylamine molecules onto glass plates. This simple process, which does not require special apparatus or significant fabrication time, leads to uniform assemblies over vast areas (∼34 cm2). In the SERS measurements, the high spatial reproducibility of the SERS signals from p-aminothiophenol adsorbed on the assemblies over vast areas demonstrates that this method is useful for the quantitative investigation of SERS mechanisms. Under 532 nm laser excitation, the difference in the enhancement factors of the SERS signals at the a1 mode between assemblies consisting of gold, silver, and core–shell nanoparticles can be explained by the degree of overlap of the excitation wavelength with their plasmon coupling modes. In contrast, under 785 nm excitation, even though the plasmon band of the core–shell nanoparticle assemblies does not significantly overlap with the excitation wavelength as compared with that of gold nanoparticle assemblies, the enhancement factor from the core–shell nanoparticle assemblies was stronger than those from the gold nanoparticle assemblies. Therefore, we have demonstrated that the gold(core)–silver(shell) nanoparticle assemblies are excellent SERS active materials, which have strong electromagnetic mechanism (EM) as well as chemical mechanism (CM) effects due to the silver shells.
Introduction
Since the first discovery of surface-enhanced Raman scattering (SERS), which dramatically enhances the Raman signals from molecules immobilized on metal electrodes, in the 1970s,1 SERS has shown promise for applications such as ultrasensitive sensor tips2 and single molecule spectroscopy.3–6 Although the precise mechanism has been a matter of considerable debate, it is accepted that two mechanisms contribute: CM and EM effects.5–7 The CM is based on charge transfer induced by mixing of the metal orbitals with the orbitals of a molecule, while the EM is based on the interaction of the local electric field generated by localized surface plasmon resonance (SPR) on metal nanoparticles and nanostructures with the transition moment of the adsorbed molecules. Because both mechanisms usually coexist in the SERS spectra, uniform metal nanostructures that have reproducible SERS spectral patterns are needed for the quantitative investigation of these mechanisms. In addition, in order to develop useful SERS-active metal nanostructures, the reproducibility of the SERS signals (i.e., site-by-site variations in the signal intensity) along with high sensitivity become important.8–15 Therefore, methods for fabricating metal nanostructures with macroscopic and microscopic morphological uniformity are required for both fundamental and applied science.Some studies have focused on dense two-dimensional (2D) assemblies comprising plasmonic metal nanoparticles to fulfill the above demands.8–12 It has been suggested that dense assemblies can provide the required large electric fields, known as the “hot spots,”16–18 in the interstitial region due to plasmon coupling between adjacent nanoparticles.10,11,19,20 Also, it is expected that elaborate 2D assemblies improve reproducibility because of their morphological uniformity. Meanwhile, fabrication of 2D nanoparticle assemblies has been achieved by various bottom-up approaches such as liquid–liquid interface-mediated assembly,20,21 capillarity-assisted assembly,8 the Langmuir–Blodgett method,22,23 the seed-growth method,24 utilization of electrostatic interactions,25 and so on; however, the development of simpler methods that require less time and do not need special apparatus is desired. Previously, we demonstrated that the evaporation of toluene droplets containing gold and silver nanoparticles protected with alkylamine molecules forms high-quality 2D nanoparticle assemblies on glass plates via assembly at the air–toluene interface; these assemblies showed appreciable SERS activity.26 Although the formation mechanism has not been fully elucidated, both the evaporation kinetics and the amount of excess protective agents have been proposed to be key factors.27 So far, gold and silver nanoparticles have been mainly used for the fabrication of 2D assemblies. In order to increase the SERS activity of the assemblies, we believe that it is necessary to improve the intrinsic optical functions of the metal nanoparticles that comprise the assemblies.
In this study, we fabricated 2D assemblies comprising gold(core)–silver(shell) nanoparticles (Au/AgNPs) and evaluated their SERS activity, as compared with those of assemblies of gold and silver nanoparticles. Although it is known that gold nanoparticles show a lower enhancement factor than silver nanoparticles, they are easier to synthesize with a high degree of size homogeneity. Therefore, the gold(core)–silver(shell) nanoparticles synthesized by depositing silver on as-synthesized gold nanoparticles are expected to have Ag-like optical properties with higher homogeneity than silver nanoparticles.28,29 Furthermore, although it has not yet been fully elucidated, it has been reported that the electronic interactions between gold-cores and silver-shells have the potential to provide novel optical properties that further enhance the SERS activity.30–32 It is expected that uniform 2D assemblies of Au/AgNPs assist in the quantitative investigation of these effects.
Experimental
Reagents and chemicals
Milli-Q-grade water was used for all aqueous solutions. Hydrogen tetrachloroaurate(III) tetrahydrate (HAuCl4·4H2O; Nacalai Tesque), silver nitrate (AgNO3; Wako Pure Chemicals), octadecylamine (ODA; Tokyo Chemical Industry), sodium tetrahydroborate (NaBH4; Wako), trisodium citrate dihydrate (Kanto Chemical), disodium citrate sesquihydrate (Tokyo Chemical Industry), ascorbic acid (Wako Pure Chemicals), sodium hydroxide (NaOH, Kanto Chemical), and p-aminothiophenol (PATP; Tokyo Chemical Industry) were used as received without further purification. Deionized water (resistivity: 18.2 MΩ cm) was obtained from a Millipore water purification system.Preparation of gold, silver, and gold(core)–silver(shell) nanoparticle assemblies
The preparation of assemblies consisting of gold nanoparticles (AuNPs), silver nanoparticles (AgNPs), and Au/AgNPs is described in Fig. 1. Firstly, colloidal aqueous solutions of AuNPs,33 AgNPs,34 and Au/AgNPs35 were synthesized using modified versions of previously reported procedures. In brief, an aqueous solution of HAuCl4·4H2O (0.01 wt%, 100 mL) was refluxed for 30 min. Next, an aqueous solution of disodium citrate (1 wt%, 12 mL) was injected into the solution, and the mixture was refluxed for 60 min to produce an aqueous solution of citrate-capped AuNPs. For the synthesis of citrate-capped AgNPs, an aqueous solution of AgNO3 (1 mM, 100 mL) was added to an equivalent volume of aqueous solution containing NaBH4 (0.2 mM) and trisodium citrate (5 mM) under cooling in an ice bath. To synthesize Au/AgNPs, the as-prepared gold colloidal aqueous solution (18 mL) and ascorbic acid (0.1 M, 2.4 mL) were placed in a 50 mL vial and stirred vigorously. Next, an aqueous solution of AgNO3 (1 mM, 6 mL) was added dropwise to the solution at 15 s intervals. After the synthesis, the pH of the solution was adjusted to 5 using an aqueous solution of NaOH (0.05 M). | ||
| Fig. 1 Preparation of metal nanoparticle assemblies. | ||
Next, colloidal toluene solutions of the metal nanoparticles were prepared by phase-transfer of the as-synthesized nanoparticles from the aqueous to toluene phase using ODA as a phase-transfer catalyst via a modified version of a previously reported procedure.36 Toluene (1.5 mL) containing 2.5 × 10⁻⁴ M ODA was added to an aqueous solution containing nanoparticles (AuNPs and AgNPs: 9 mL; Au/AgNPs: 13.2 mL), resulting in two immiscible layers. Initially, the lower aqueous phase was colored and the upper organic phase was colorless. After 5 min of vigorous stirring, transfer of the nanoparticles from the aqueous phase to the toluene phase was observed as movement of color across the interface.
To prepare the substrate, a glass plate was sonicated with acetone for 20 min followed by washing with toluene to remove unnecessary dust and pollution. A certain amount of each colloidal solution was drop-cast onto the surface of a glass plate and then left to dry in air at room temperature resulting in the formation of nanoparticle assembly films physically-adsorbed on the glass surfaces. Finally, the obtained assemblies were rinsed in pure methanol.
Sample preparation for the evaluation of the SERS activity
The obtained substrates containing the metal nanoparticle assemblies were immersed in a methanol solution of PATP (1 mM) for 12 h followed by rinsing with pure methanol to ensure the desorption of non-specifically bonded molecules. The well-known high chemical affinity of thiol groups to metals leads to the formation of a monolayer of PATP molecules on assemblies consisting of metal nanoparticles;37,38 this occurs as PATP displaces ODA on the metal surface because the metal–S bond is stronger than the metal–NH2 bond.Measurements
UV-Vis spectral measurements were performed using a JASCO V-630 spectrophotometer. Field-emission scanning electron microscopy (FE-SEM) images were taken on a Hitachi S-4500 microscope with an acceleration voltage of 15 kV. Transmission electron microscopy (TEM) images were recorded on a Hitachi HF-2000 with an acceleration voltage of 200 kV. Elemental mapping images, a high-angle annular dark-field scanning/transmission electron microscopy (HAADF-STEM) image, and energy-dispersive X-ray spectra were taken on a STEM (HD-2300C, Hitachi Ltd). Raman scattering spectra of PATP-modified nanostructure substrates and the reference methanol solution of PATP (10 M) were obtained using a micro-Raman spectrometer (NRS-5100, JASCO). The excitation sources were 532 and 785 nm CW laser. The laser was focused onto the sample by using an objective lens (×100). Raman signals were obtained by one-shot measurements with 1 s of sampling time on each measurement point.Results and discussion
Optical and morphological characterization of the colloidal solution of the metal nanoparticles
Normalized extinction spectra for aqueous solutions of the synthesized metal nanoparticles are shown in Fig. 2 (the non-normalized spectra are also shown in Fig. S1†). AuNPs and AgNPs showed peaks at 525 and 393 nm, respectively, which can be assigned to the plasmon mode of a single isolated NP.25,39,40 In contrast, Au/AgNPs showed two types of collective oscillation modes at 390 and 490 nm. The former extinction peak can be ascribed to plasmon excitation of the silver shell on the AuNP core, while the latter broad shoulder band can be ascribed to plasmon excitation of the AuNP core. The appearance of these two modes and the blue shift of the plasmon band of the AuNP core to 490 nm from the AuNP value of 525 nm suggests that gold(core)–silver(shell) nanoparticles were successfully formed.29,35 | ||
| Fig. 2 Normalized extinction spectra of colloidal aqueous solutions of (a) AuNPs, (b) AgNPs, and (c) Au/AgNPs. | ||
In the normalized transmission extinction spectra (Fig. S2†) after phase transfer of the nanoparticles into toluene, the plasmon peaks derived from AuNPs and AgNPs were red-shifted by 8 and 20 nm, respectively. Similarly, the plasmon peak from the Ag shells of Au/AgNPs with the broadened shoulder around 500 nm in the toluene phase was red-shifted by 27 nm. These wavelength changes are attributed mainly to the increase in refractive index of the solvent (from 1.33 for water to 1.47 for toluene), as previously reported.36,41 These results suggest that the metal nanoparticles were successfully transferred into the toluene phase from the aqueous phase without any aggregation.
The average diameters (D) of AuNPs, AgNPs, and Au/AgNPs after phase transfer were estimated to be 10.4 ± 0.7, 9.6 ± 2.8, and 13.9 ± 1.3 nm, respectively, from TEM images (Fig. 3). Note that the diameters of AuNPs and AgNPs were almost the same and the thickness of the Ag shells in Au/AgNPs was calculated to be approximately 1.8 nm using the following formula: [(D of Au/AgNPs) − (D of AuNPs)]/2. Au/AgNPs showed prominent contrast with the core being darker than the shells, as shown in the inset of Fig. 3(c); the lighter regions are invariably a feature of silver. Furthermore, we have confirmed that the obtained Au/AgNPs formed gold(core)–silver(shell) structures utilizing the energy dispersive X-ray spectroscopy (EDS) mapping analysis, the HAADF-STEM image, and the EDS spectra measurements as shown in Fig. 4. EDS mapping analysis was conducted to investigate the relative positions of silver and gold within Au/AgNPs (Fig. 4A). From the mapping images of the Au M edge and the Ag L edge, it was confirmed that silver exists over all of the surfaces of the gold nanoparticles. In order to further investigate their morphological characterization, a HAADF image of the Au/AgNPs is shown in Fig. 4B. The outside shell region is darker, as compared with the core region, which indicates the presence of a high-Z element at the cores and a low-Z element at the shells. In this study, it is gold and silver, respectively. In addition, EDS spectra were measured at the center and periphery regions of the nanoparticle, as shown in Fig. 4C. As a result, it is shown that a majority of the gold exists at the center of the nanoparticle. On the other hand, silver heavily exists at the periphery region. Thus, we confirmed that Au/AgNPs formed gold(core)–silver(shell) nanoparticles.
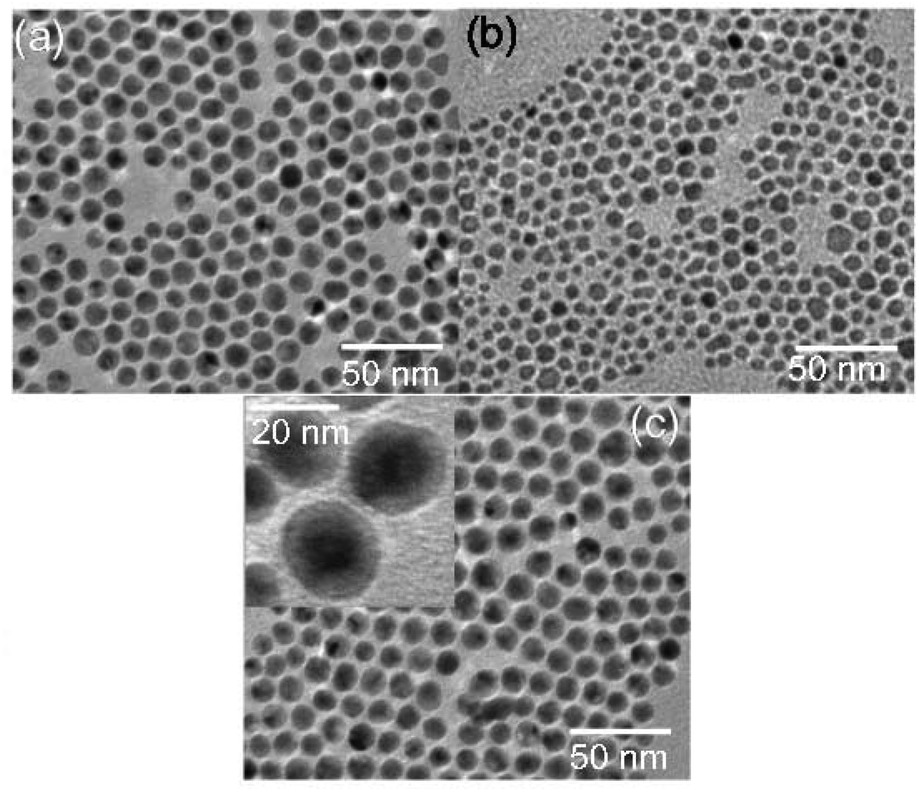 | ||
| Fig. 3 TEM images of (a) AuNPs, (b) AgNPs, and (c) Au/AgNPs dispersed in toluene solution. | ||
 | ||
| Fig. 4 (A) (a) Bright field (BF)-STEM image and EDS elemental mapping images of Au/AgNPs; (b) Au M edge and (c) Ag L edge. (B) (a) BF-STEM image and (b) HAADF-STEM image of Au/AgNPs. (C) EDS spectra in the regions of (a) the center and (b) the periphery of the Au/AgNP. (Inset) Atomic composition ratio of the Au M edge and the Ag L edge. | ||
Optical and morphological characterization of assemblies of metal nanoparticles
Metal nanoparticle assemblies were fabricated via assembly at air–toluene interfaces by drop-casting colloidal toluene solutions onto glass surfaces.26,27 The transmission extinction spectra of the assemblies after immobilization of PATP as a probe molecule for the SERS measurements are shown in Fig. 5. Unlike those of the colloidal toluene solutions, the spectra of the assemblies of AuNPs and AgNPs showed broad peaks at ∼71010,39 and ∼600 nm,25,40 respectively, which can be ascribed to the longitudinal plasmon mode of the coupling of multiple nanoparticles. In addition, the AgNP assembly showed a weak band at ∼380 nm, which is ascribed to isolated AgNPs. In contrast, it was confirmed that the assembly consisting of Au/AgNPs showed an appreciable broad peak corresponding to the coupling mode at 680 nm, which is intermediate between those of AuNPs and AgNPs. | ||
| Fig. 5 Extinction spectra of assemblies of (a) AuNPs, (b) AgNPs, and (c) Au/AgNPs fabricated via the air–toluene interface-mediated process. Dashed lines indicate the excitation source wavelengths (532 nm and 785 nm) in Raman scattering measurements. | ||
SEM images of the metal nanoparticle assemblies are shown in Fig. 6(A). It was confirmed that all of the nanoparticles formed 2D, high-density assemblies, although there are several defects. In order to further verify this, the thicknesses of the nanoparticle assemblies were estimated from their cross-sectional SEM images and their atomic force microscope (AFM) measurements, as shown in Fig. S3 and S4,† respectively. The average thicknesses of the nanoparticle assemblies consisting of AuNPs, AgNPs, and Au/AgNPs were calculated to be 12, 13, and 13 nm, respectively, from the cross-sectional SEM images. And the average thicknesses of the AuNP, AgNP, and Au/AgNP assemblies were calculated to be 12, 9, and 10 nm, respectively, from the AFM images. These thicknesses were nearly identical with the diameters of the nanoparticles calculated from their TEM images. These results suggest that each nanoparticle formed two-dimensional assemblies. The coverage of the assemblies consisting of AuNPs, AgNPs, and Au/AgNPs, as calculated using Image J, was 69, 75, and 63%, respectively. These results suggest that the longitudinal plasmon coupling modes of the assemblies observed in the extinction spectra (Fig. 5) are caused by dense packing of the nanoparticles. In addition, a picture of the assemblies prepared by drop-casting 3 mL of the colloidal toluene solution of Au/AgNPs is shown in Fig. 6(B). Although there is little color heterogeneity, nearly uniform nanoparticle assemblies were formed. Note that the simple procedure of drop-casting a colloidal toluene solution onto glass surfaces followed by air-drying for ∼15 min provides assemblies with areas of ∼34 cm2 without any special apparatus. Therefore, this air–toluene-interface-mediated procedure is easier, less time-consuming, and less expensive for the fabrication of dense nanoparticle assemblies over vast areas than commonly used techniques such as the Langmuir–Blodgett method22,23 and utilization of a layer-by-layer method.42
 | ||
| Fig. 6 (A) SEM images of assemblies of (a) AuNPs, (b) AgNPs, and (c) Au/AgNPs and (B) a picture of Au/AgNP assembly. | ||
SERS properties on the metal nanoparticle assemblies
To evaluate the SERS activity of the metal nanoparticle assemblies, Raman scattering spectra were measured using PATP as a SERS probe molecule37,43 immobilized on the assemblies.44–46 As shown in Fig. 7, a spectral SERS pattern characteristic of PATP was observed from all of the assemblies. Typically, the prominent peaks at 1428, 1384, and 1137 cm−1 are assigned to the non-totally symmetric b2 modes of the PATP molecule, and the peaks at 1183 and ∼1070 cm−1 are assigned to the totally symmetric a1 modes. | ||
| Fig. 7 SERS spectra of PATP immobilized on assemblies of (a) AuNPs, (b) AgNPs, and (c) Au/AgNPs measured with (A) 532 nm and (B) 785 nm excitation. | ||
To obtain a reliable assessment of their utility as SERS substrates, the development of uniform substrates with high spatial reproducibility (i.e., site-by-site variations in signal intensity) is strongly desirable. Thus, in order to evaluate the reproducibility of the SERS intensity, the intensities of the SERS signals at ∼1070 cm−1 under 785 nm excitation were measured at 60 different points on assemblies of AuNPs, AgNPs, and Au/AgNPs. Note that the measurements were not performed in non-uniform regions observed macroscopically such as reddish regions as seen in Fig. 6(B). As shown in Fig. 8, the SERS signals obtained from all the assemblies showed high reproducibility: the relative standard deviation (RSD) of the SERS signals was ≤10% (AuNPs: 8%; AgNPs: 9%; Au/AgNPs: 10%). These RSD values are low enough, as compared with the SERS-active substrates reported previously.8–10,12,14,15,47 Therefore, it has been demonstrated that the air–toluene-interface-mediated assembly method is useful for the quantitative investigation of SERS mechanisms as well as the fabrication of practical SERS substrates.
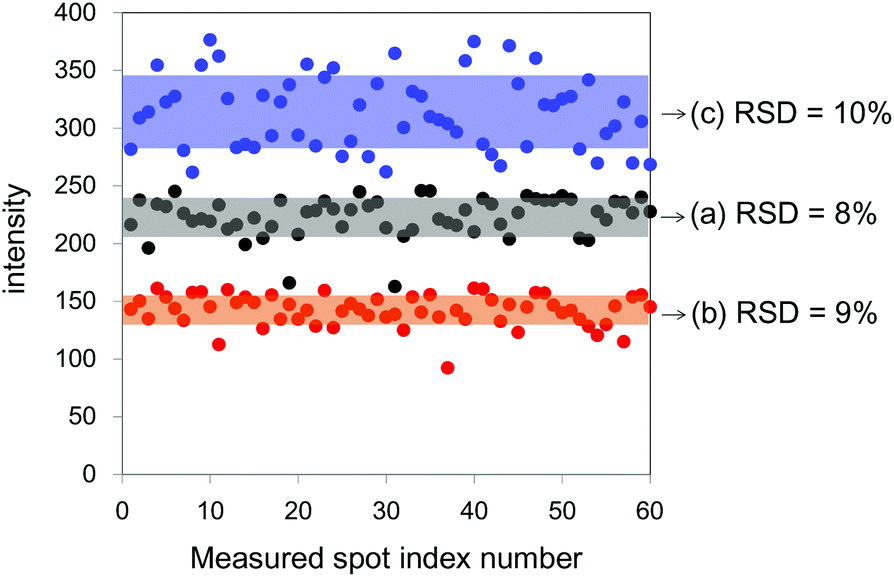 | ||
| Fig. 8 Intensities of the SERS peak at ∼1070 cm−1 of PATP in 60 spots on assemblies of (a) AuNPs, (b) AgNPs, and (c) Au/AgNPs measured at the 785 nm laser line. | ||
To quantitatively evaluate the enhancement effect of the obtained SERS signals, enhancement factor (EF) values were estimated based on the following equation, which was reported previously:48–50
| EF = (ISERS/Nsurf)/(Ibulk/Nbulk) | (1) |
| Nsurf = RA/σ | (2) |
| R = (ΓAsphere)/Apro | (3) |
| Nsurf = (ΓAAsphere)/(σApro) | (4) |
Next, Nbulk is calculated using the following equation:48,49
| Nbulk = AhcNA | (5) |
We determined h for the measurement configuration by transferring a silicon (100) wafer across the focal plane of the objective lens (×100) and recording the intensity of the Raman signal at 520 cm−1 from the silicon. We calculated h = 6 μm (532 nm) and 19 μm (785 nm) by integrating the intensity of the Raman signal over distance and dividing the calculated value by the largest observed Raman signal. Based on the above results, we determined EF values at 532 nm and 785 nm laser excitation.
Furthermore, the charge-transfer (CT) mechanism is not only the main contributor to the enhancement of the Raman signals, but is also important for the resolution of the enhancement mechanisms. In this study, we calculated the degree of CT (pCT) in order to investigate the CT contribution to the SERS signals. According to previous reports, the pCT(k) of the k-band (the index “k” is used to identify individual molecular lines in the SERS spectra) can be presented as follows:54–57
| pCT(k) = [Ik(CT) − Ik(SPR)]/[Ik(CT) + I0(SPR)] | (6) |
SERS spectra of PATP immobilized on the metal nanoparticles measured with 532 nm excitation are shown in Fig. 7(A). Only weak SERS signals were detected from the AuNP assemblies. In contrast, the signal at ∼1070 cm−1 (a1 mode) from the assemblies consisting of AgNPs was 12 times stronger than that from AuNPs (the detailed EF values are described in Table 1). As shown by the extinction spectra (Fig. 5), the excitation laser wavelength overlaps well with the plasmon band of the longitudinal plasmon coupling from AgNP assemblies, but does not overlap well with that of the AuNP assemblies. Therefore, the appearance of stronger SERS signals from AgNP assemblies is likely caused by the generation of strong local electric fields (i.e., hot spots) at the interstitial region between nanoparticles.10,17–19 Note that although the excitation wavelength does not overlap well with the plasmon coupling band of the Au/AgNP assemblies, the SERS signals at ∼1070 cm−1 were six times stronger than that of the AuNP assemblies, as shown in Table 1. This result implies that the enhancement by the Au/AgNP assemblies is caused by the strong SPR effect of the silver shells that coat the AuNP cores.
| EF at 532 nm | EF at 785 nm | |
|---|---|---|
| AuNPs | (2.7 ± 0.4) × 103 | (2.5 ± 0.2) × 105 |
| AgNPs | (3.2 ± 0.2) × 104 | (1.5 ± 0.1) × 105 |
| Au/AgNPs | (1.6 ± 0.3) × 104 | (4.0 ± 0.4) × 105 |
As shown in Table 2, pCT calculated from the SERS spectra of the AgNP assemblies was larger than that of the AuNP assemblies; this difference is most likely because of the differences in the work functions of gold (5.0 eV) and silver (4.3 eV).57 Also, the pCT of the Au/AgNP assemblies was almost the same as that of the AgNP assemblies. These results suggest that the SERS properties of the Au/AgNP assemblies are very similar to those of the AgNP assemblies.
| p CT at 532 nm | p CT at 785 nm | |
|---|---|---|
| AuNPs | 0.33 ± 0.06 | 0.06 ± 0.006 |
| AgNPs | 0.66 ± 0.002 | 0.19 ± 0.03 |
| Au/AgNPs | 0.63 ± 0.009 | 0.14 ± 0.02 |
In the SERS spectra (Fig. 7(B)) measured with 785 nm excitation, the signal at ∼1070 cm−1 obtained on the AuNP assemblies was stronger than that of the AgNP assemblies (the detailed EF values are shown in Table 1). As shown in Fig. 5, the excitation wavelength matches the plasmon band of the AuNP assemblies better than that of the AgNP assemblies, which leads to the difference in the EF values. Interestingly, despite having less overlap between the plasmon band of Au/AgNP assemblies and the excitation wavelength than the AuNP assemblies, the signal from the Au/AgNP assemblies was stronger than that from the AuNP and AgNP assemblies. Also, the pCT value of the Au/AgNPs was intermediate between those of AuNPs and AgNPs, as shown in Table 2.
It has been reported that gold(core)–silver(shell) nanoparticles produce peculiar SERS activity because of appreciable CT effects31 and have characteristic Fermi levels that are different from gold and silver nanoparticles.32 However, our results showed that the CT effect of the Au/AgNP assemblies is almost the same under 532 nm excitation and is less under 785 nm excitation than that of the AgNPs. Accordingly, it is unlikely that the Fermi level of the Au/AgNPs is significantly different from that of the AgNPs. Although the mechanism is unclear at this stage, more importantly, it should be noted that the Au/AgNP assemblies showed an appreciable EM effect due to the strong local electric fields as well as a strong CM effect due to the silver shells at 785 nm excitation. Therefore, we have demonstrated that the Au/AgNP assemblies are excellent SERS active materials, which have strong EM and CM effects.
Conclusion
We successfully fabricated dense 2D assemblies consisting of Au/AgNPs over vast areas. The assemblies were produced simply by drop-casting colloidal toluene solutions onto glass surfaces. The SERS signals from PATP immobilized on assemblies consisting of AuNPs, AgNPs, and Au/AgNPs showed excellent spatial reproducibility. The SERS activity of the Au/AgNP assemblies was investigated in detail using 532 and 785 nm lasers. The Au/AgNP assemblies showed higher SERS activity than those of AuNP and AgNP assemblies (strong CM and EM effects). Thus, we demonstrated that bimetallic nanoparticles can be used for highly SERS-active substrates. The nanoparticles in this study were too small to generate strong local electric fields; therefore optimization of the bimetallic nanoparticle size can provide much more highly SERS-active substrates with large EF values. Research on this is currently underway.Notes and references
- M. Fleischmann, P. J. Hendra and A. J. McQuillan, Raman spectra of pyridine adsorbed at a silver electrode, Chem. Phys. Lett., 1974, 26, 163–166 CrossRef CAS.
- D. A. Stuart, J. M. Yuen, N. Shah, O. Lyandres, C. R. Yonzon, M. R. Glucksberg, J. T. Walsh and R. P. Van Duyne, In vivo glucose measurement by surface-enhanced Raman spectroscopy, Anal. Chem., 2006, 78, 7211–7215 CrossRef CAS PubMed.
- S. Nie and S. R. Emory, Probing single molecules and single nanoparticles by surface-enhanced Raman scattering, Science, 1997, 275, 1102–1106 CrossRef CAS PubMed.
- K. Kneipp, Y. Wang, H. Kneipp, L. T. Perelman, I. Itzkan, R. R. Dasari and M. S. Feld, Single molecule detection using surface-enhanced Raman scattering (SERS), Phys. Rev. Lett., 1997, 78, 1667–1670 CrossRef CAS.
- A. M. Michaels, J. Jiang and L. Brus, Ag nanocrystal junctions as the site for surface-enhanced Raman scattering of single rhodamine 6G molecules, J. Phys. Chem. B, 2000, 104, 11965–11971 CrossRef CAS.
- L. Brus, Noble metal nanocrystals: plasmon electron transfer photochemistry and single-molecule Raman spectroscopy, Acc. Chem. Res., 2008, 41, 1742–1749 CrossRef CAS PubMed.
- A. Campion and P. Kambhampati, Surface-enhanced Raman scattering, Chem. Soc. Rev., 1998, 27, 241–250 RSC.
- R. Que, M. Shao, S. Zhuo, C. Wen, S. Wang and S.-T. Lee, Highly reproducible surface-enhanced Raman scattering on a capillarity-assisted gold nanoparticle assembly, Adv. Funct. Mater., 2011, 21, 3337–3343 CrossRef CAS.
- H. Wang, S. Levin and N. J. Halas, Nanosphere arrays with controlled sub-10-nm gaps as surface-enhanced Raman spectroscopy substrates, J. Am. Chem. Soc., 2005, 127, 14992–14993 CrossRef CAS PubMed.
- W. Lee, S. Y. Lee, R. M. Brider and O. Rabin, Self-assembled SERS substrates with tunable surface plasmon resonances, Adv. Funct. Mater., 2011, 21, 3424–3429 CrossRef CAS.
- V. Liberman, C. Yilmaz, T. M. Bloomstein, S. Somu, Y. Echegoyen, A. Busnaina, S. G. Cann, K. E. Krohn, M. F. Marchant and M. Rothschild, A nanoparticle convective directed assembly process for the fabrication of periodic surface enhanced Raman spectroscopy substrates, Adv. Mater., 2010, 22, 4298–4302 CrossRef CAS PubMed.
- Q. Shao, R. Que, L. Cheng and M. Shao, Fast one-step silicon–hydrogen bond assembly of silver nanoparticles as excellent surface-enhanced Raman scattering substrates, RSC Adv., 2012, 2, 1762–1764 RSC.
- C. A. Smyth, I. Mirza, J. G. Lunney and E. M. McCabe, Surface-enhanced Raman spectroscopy (SERS) using Ag nanoparticle films produced by pulsed laser deposition, Appl. Surf. Sci., 2013, 264, 31–35 CrossRef CAS PubMed.
- X. Ke, B. Lu, J. Hao, J. Zhang, H. Qiao, Z. Zhang, C. Xing, W. Yang, B. Zhang and J. Tang, Facile fabrication of SERS arrays through galvanic replacement of silver onto electrochemically deposited copper micropatterns, ChemPhysChem, 2012, 13, 3786–3789 CrossRef CAS PubMed.
- J.-C. Bian, Z.-D. Chen, Z. Li, F. Yang, H.-Y. He, J. Wang, J. Z. Y. Tan, J.-L. Zeng, R.-Q. Peng, X.-W. Zhang and G.-R. Han, Electrodeposition of hierarchical Ag nanostructures on ITO glass for reproducible and sensitive SERS application, Appl. Surf. Sci., 2012, 258, 6632–6636 CrossRef CAS PubMed.
- G. Haran, Single-molecule Raman spectroscopy: A probe of surface dynamics and plasmonic fields, Acc. Chem. Res., 2010, 43, 1135–1143 CrossRef CAS PubMed.
- J. P. Camden, J. A. Dieringer, Y. Wang, D. J. Masiello, L. D. Marks, G. C. Schatz and R. P. Van Duyne, Probing the structure of single-molecule surface-enhanced Raman scattering hot spots, J. Am. Chem. Soc., 2008, 130, 12616–12617 CrossRef CAS PubMed.
- G. Braun, I. Pavel, A. R. Morrill, D. S. Seferos, G. C. Bazan, N. O. Reich and M. Moskovits, Chemically patterned microspheres for controlled nanoparticle assembly in the construction of SERS hot spots, J. Am. Chem. Soc., 2007, 129, 7760–7761 CrossRef CAS PubMed.
- A. Chen, A. E. DePrince III, A. Demortiére, A. Joshi-Imre, E. V. Shevchemko, S. K. Gray, U. Welp and V. K. Vlasko-Vlasov, Self-assembled large Au nanoparticle arrays with regular hot spots for SERS, Small, 2011, 7, 2365–2371 CrossRef CAS PubMed.
- S. Yun, M. K. Oh, S. K. Kim and S. Park, Linker-molecule-free gold nanorod films, Effect of nanorod size on surface enhanced Raman scattering, J. Phys. Chem. C, 2009, 113, 13551–13557 CAS.
- M. Suzuki, Y. Niidome, N. Terasaki, K. Inoue, Y. Kuwahara and S. Yamada, Surface-enhanced nonresonance Raman scattering of rhodamine 6G molecules adsorbed on gold nanorod films, Jpn. J. Appl. Phys., 2004, 43, L554–L556 CrossRef CAS.
- M. A. Mahmoud, C. E. Tabor and M. A. El-Sayed, Surface-enhanced Raman scattering enhancement by aggregated silver nanocube monolayers assembled by the Langmuir–Blodgett technique at different surface pressures, J. Phys. Chem. C, 2009, 113, 5493–5501 CAS.
- N. Ahamad and A. Ianoul, Using phospholipids to control interparticle distance in SERS-active substrates, J. Phys. Chem. C, 2011, 115, 3587–3594 CAS.
- A. Sánchez-Iglesias, P. Aldeanueva-Potel, W. Ni, J. Pérez-Juste, I. Pastoriza-Santos, R. A. Alvarez-Puebla, B. N. Mbenkum and L. M. Liz-Marzán, Chemical seeded growth of Ag nanoparticle arrays and their application as reproducible SERS substrates, Nano Today, 2010, 5, 21–27 CrossRef PubMed.
- T. Arakawa, T. Munaoka, T. Akiyama and S. Yamada, Effects of silver nanoparticles on photoelectrochemical responses of organic dyes, J. Phys. Chem. C, 2009, 113, 11830–11835 CAS.
- K. Sugawa and Y. Tanoue, Simple fabrication of two-dimensional self-assemblies consisting of gold and silver nanoparticles at an air/toluene interface and their surface-enhanced Raman scattering activity, Jpn. J. Appl. Phys., 2012, 51, 06FG10 CrossRef.
- T. P. Bigioni, X.-M. Lin, T. T. Nguyen, E. I. Corwin, T. A. Witten and H. M. Jaeger, Kinetically driven self assembly of highly ordered nanoparticle monolayers, Nat. Mater., 2006, 5, 265–270 CrossRef CAS PubMed.
- L. Lu, H. Wang, Y. Zhou, S. Xi, H. Zhang, J. Hu and B. Zhao, Seed-mediated growth of large, monodisperse core–shell gold–silver nanoparticles with Ag-like optical properties, Chem. Commun., 2002, 144–145 RSC.
- N. R. Jana, Silver coated gold nanoparticles as new surface enhanced Raman substrate at low analyte concentration, Analyst, 2003, 128, 954–956 RSC.
- S. Pande, S. K. Ghosh, S. Praharaj, S. Panigrahi, S. Basu, S. Jana, A. Pal, T. Tsukuda and T. Pal, Synthesis of normal and inverted gold–silver core–shell architectures in β-cyclodextrin and their applications in SERS, J. Phys. Chem. C, 2007, 111, 10806–10813 CAS.
- S. Pande, J. Chowhury and T. Pal, Understanding the enhancement mechanisms in the surface-enhanced Raman spectra of the 1,10-phenanthroline molecule adsorbed on a Au@Ag bimetallic nanocolloid, J. Phys. Chem. C, 2011, 115, 10497–10509 CAS.
- M. Mandal, N. R. Jana, S. Kundu, S. K. Ghosh, M. Panigrahi and T. Pal, Synthesis of Aucore–Agshell type bimetallic nanoparticles for single molecule detection in solution by SERS method, J. Nanopart. Res., 2004, 6, 53–61 CrossRef CAS.
- J. Turkevich, P. C. Stevenson and J. Hiller, A study of the nucleation on and growth processes in the synthesis of colloidal gold, J. Discuss Faraday Soc., 1951, 11, 55–75 RSC.
- W. Wang, S. Efrima and O. Regev, Directing oleate stabilized nanosized silver colloids into organic phases, Langmuir, 1998, 14, 602–610 CrossRef CAS.
- T. Y. Olson, A. M. Schwartzberg, C. A. Orme, C. E. Talley, B. O'Connell and J. Z. Zhang, Hollow gold-silver double-shell nanospheres: structure, optical absorption, and surface-enhanced Raman scattering, J. Phys. Chem. C, 2008, 112, 6319–6329 CAS.
- K. Sugawa, Y. Tanoue, D. Tanaka and T. Sakai, Facile phase transfer of gold and Au-core/Ag-shell nanoparticles from aqueous to toluene solution using alkylamine molecules and their assemblies on solid supports, Jpn. J. Appl. Phys., 2011, 50, 04DH14 CrossRef.
- L.-B. Zhao, R. Huang, Y.-F. Huang, D.-Y. Wu and B. Ren, Photon-driven charge transfer and Herzberg-Teller vibronic coupling mechanism in surface-enhanced Raman scattering of p-aminothiophenol adsorbed on coinage metal surfaces: a density functional theory study, J. Chem. Phys., 2011, 135, 134707 CrossRef PubMed.
- N. Djaker, R. Hostein, E. Devaux, T. W. Ebbesen, H. Rigneault and J. Wenger, Surface enhanced Raman scattering on a single nanometric aperture, J. Phys. Chem. C, 2010, 114, 16250–16256 CAS.
- P. M. Jais, D. B. Murray, R. Merlin and A. V. Bragas, Metal nanoparticle ensembles: tunable laser pulses distinguish monomer from dimer vibrations, Nano Lett., 2011, 11, 3685–3689 CrossRef CAS PubMed.
- P. J. G. Goulet, D. S. dos Santos, R. A. Alvarez-Puebla, O. N. Oliveira and R. F. Aroca, Surface-enhanced Raman scattering on dendrimer/metallic nanoparticle layer-by-layer film substrates, Langmuir, 2005, 21, 5576–5581 CrossRef CAS PubMed.
- S. Underwood and P. Mulvaney, Effect of the solution refractive index on the color of gold colloids, Langmuir, 1994, 10, 3427–3430 CrossRef CAS.
- M. Fan and A. G. Brolo, Silver nanoparticles self assembly as SERS substrates with near single molecule detection limit, Phys. Chem. Chem. Phys., 2009, 11, 7381–7389 RSC.
- Y.-F. Huang, D.-Y. Wu, H.-P. Zhu, L.-B. Zhao, G.-K. Liu, B. Ren and Z.-Q. Tian, Surface-enhanced Raman spectroscopic study of p-aminothiophenol, Phys. Chem. Chem. Phys., 2012, 14, 8485–8497 RSC.
- K. Uetsuki, T. Yano, Y. Saito, T. Ichimura and S. Kawata, Experimental identification of chemical effects in surface enhanced Raman scattering of 4-aminothiophenol, J. Phys. Chem. C, 2010, 114, 7515–7520 CAS.
- K. Kim and H. S. Lee, Effect of Ag and Au nanoparticles on the SERS of 4-aminobenzenethiol assembled on powdered copper, J. Phys. Chem. B, 2005, 109, 18929–18934 CrossRef CAS PubMed.
- M. Baia, F. Toderas, L. Baia, J. Popp and S. Astilean, Probing the enhancement mechanisms of SERS with p-aminothiophenol molecules adsorbed on self-assembled gold colloidal nanoparticles, Chem. Phys. Lett., 2006, 422, 127–132 CrossRef CAS PubMed.
- L. Zhang, Self-assembly Ag nanoparticle monolayer film as SERS substrate for pesticide detection, Appl. Surf. Sci., 2013, 270, 292–294 CrossRef CAS PubMed.
- W. B. Cai, B. Ren, X. Q. Li, C. X. She, F. M. Liu, X. W. Cai and Z. Q. Tian, Investigation of surface-enhanced Raman scattering from platinum electrodes using a confocal Raman microscope: dependence of surface roughening pretreatment, Surf. Sci., 1998, 406, 9–22 CrossRef CAS.
- E. J. Smythe, M. D. Dickey, J. Bao, G. M. Whitesides and F. Capasso, Optical antenna arrays on a fiber facet for in situ surface-enhanced Raman scattering detection, Nano Lett., 2009, 9, 1132–1138 CrossRef CAS PubMed.
- Y. Wang, X. Zou, W. Ren, W. Wang and E. Wang, Effect of silver nanoplates on Raman spectra of p-aminothiophenol assembled on smooth macroscopic gold and silver surface, J. Phys. Chem. C, 2007, 111, 3259–3265 CAS.
- M. Osawa, N. Matsuda, K. Yoshii and I. Uchida, Charge transfer resonance Raman process in surface-enhanced Raman scattering from p-aminothiophenol adsorbed on silver: Herzberg-Teller contribution, J. Phys. Chem., 1994, 98, 12702–12707 CrossRef CAS.
- Q. Zhou, Y. Chao, Y. Li, W. Xu, Y. Wu and J. Zheng, Contribution of charge-transfer mechanisms to surface-enhanced Raman scattering with near-IR excitation, ChemPhysChem, 2007, 8, 921–925 CrossRef CAS PubMed.
- K. Kim and J. K. Yoon, Raman scattering of 4-aminobenzenethiol sandwiched between Ag/Au nanoparticle macroscopically smooth Au substrate, J. Phys. Chem. B, 2005, 109, 20731–20736 CrossRef CAS PubMed.
- W. Ji, Y. Kitahama, X. Xue, B. Zhao and Y. Ozaki, Generation of pronounced resonance profile of charge-transfer contributions to surface-enhanced Raman scattering, J. Phys. Chem. C, 2012, 116, 2515–2520 CAS.
- J. R. Lombardi and R. L. Birke, A unified view of surface-enhanced Raman scattering, Acc. Chem. Res., 2009, 42, 734–742 CrossRef CAS PubMed.
- A. P. Richer, J. R. Lombardi and B. Zhao, Size and wavelength dependence of the charge-transfer contributions to surface-enhanced Raman spectroscopy in Ag/PATP/ZnO junctions, J. Phys. Chem. C, 2010, 114, 1610–1614 Search PubMed.
- J. R. Lombardi and R. L. Birke, A unified approach to surface-enhanced Raman spectroscopy, J. Phys. Chem. C, 2008, 112, 5605–5617 CAS.
Footnote |
| † Electronic supplementary information (ESI) available: Extinction spectra of colloidal aqueous solution, normalized extinction spectra of colloidal toluene solutions of metal nanoparticles after phase transfer, cross-sectional SEM images of nanoparticle assemblies, and AFM images of the assemblies. See DOI: 10.1039/c3pp50281c |
| This journal is © The Royal Society of Chemistry and Owner Societies 2014 |