
Solid phase extraction of doxorubicin using molecularly imprinted polymer coated magnetite nanospheres prior to its spectrofluorometric determination
Mazaher
Ahmadi
,
Tayyebeh
Madrakian
* and
Abbas
Afkhami
Faculty of Chemistry, Bu-Ali Sina University, Hamedan, Iran. E-mail: madrakian@basu.ac.ir; madrakian@gmail.com; Fax: +98-811-8380709; Tel: +98-811-8380709
First published on 1st October 2014
Abstract
This work reports on the synthesis of a doxorubicin-imprinted polymer nanoadsorbent (DOXMNSs). The imprinted polymer was coated on the surface of magnetite nanospheres. The synthesized DOXMNSs have been characterized using FT-IR, XRD, VSM and TEM measurements. The prepared nanoadsorbent could well disperse in the sample medium and could selectively remove the drug from an aqueous medium before its magnetic separation, under the optimum condition. The optimum pH (i.e., pH = 7.5) has a good match with the normal cellular fluid pH, and the removal efficiency decreased significantly by decreasing the pH. The results give promise of a magnetic drug carrier for cancer therapy purposes. On the other hand, using the proposed method, sensitive doxorubicin determination in the linear concentration range of 2.0–150.0 ng mL−1 with a detection limit of 1.3 ng mL−1 could be achieved. The urine samples analyses results showed that a powerful method for the drug determination has been proposed.
Introduction
Doxorubicin (DOX) belongs to a family of anthracycline antibiotics, and it is known as an anticancer (antineoplastic) chemotherapy drug, commercialized in the form of a chloride salt and sold as Adriamycin.1–3 The drug displays a broad spectrum of antitumor activity, including activity against acute leukemias, Hodgkin's and non-Hodgkin's lymphomas, breast cancer, lung cancers, and sarcomas.3 The mechanisms for the anticancer and toxic effects of DOX include DNA intercalation and strand breakage, inhibition of topoisomerase II, formation of metal complexes with iron or copper, and free radical formation.4,5 Clinical use of DOX is limited due to its cardiotoxicity, which is usually caused by oxidative stress. Similar to all anthracyclines, DOX primarily works by intercalating DNA, but the mechanism of toxicity is also based on cell damage induced by reactive oxygen species, a mechanism in which free iron plays an important role.1From a medical or clinical point of view, monitoring drug levels in body fluids such as urine and plasma has become increasingly necessary in order to assess toxicity, adverse effects, interactions and therapeutic efficiency. Therefore, the development of sensitive and reliable analytical methods for the determination of DOX is a basic requirement for the study of this analyte in different types of samples with complex matrices. For this purpose, different analytical techniques have been used, and the most common among them is high performance liquid chromatography (HPLC) coupled with different detectors such as UV-vis,6 tandem MS,7 chemiluminescence,8 fluorimetric,9 and electroanalytical10 detectors. In addition to these HPLC methods, UV-vis spectrophotometry,11 fluorimetry,12,13 Raman spectroscopy,14 immunoassay analysis,15 and electroanalytical measurement techniques16,17 have also been used for the determination of DOX in different samples. Although these methods have been successfully applied to the analysis of DOX in various matrices, some of these methods lack sensitivity and selectivity, suffer from tedious procedures, and are time consuming or costly.11,18–20
Sample preparation is crucial for obtaining meaningful results from the analysis of real samples, since this is the most tedious and time-consuming step and a possible source of imprecision and inaccuracy of the overall analysis. Nowadays, solid-phase extraction (SPE) is widely used for the extraction and preconcentration of analytes in various environmental, food and biological samples.21–28 It is the most popular clean-up technique due to factors such as convenience, cost, time saving and simplicity, and it is the most accepted sample pre-treatment method today.29 At present, there are several types of sorbents for SPE. However, due to their unsatisfactory selectivity, these traditional sorbents usually cannot separate analytes efficiently in complex biological or environmental samples.30 New SPE sorbents have recently appeared as alternatives to conventional solid-phase extraction sorbents with the aim of achieving a more selective preconcentration of the analytes.
Molecular imprinting has become an established technique for preparing robust molecular recognition elements for a wide variety of target molecules.31–37 Molecularly imprinting polymers (MIPs) have been investigated as highly selective sorbents for SPE in order to concentrate and clean up samples prior to analysis. MIPs, involving the formation of cavities in a synthetic polymer for a template analyte, are useful for selective extraction. This analytical method is a rapidly developing technique for the preparation of polymeric materials that are capable of high molecular recognition.38,39 Radical polymerization is usually used for cross-linking of the functional monomers in the presence of template structures and then removing the target (Scheme 1). The use of MIPs for SPE involves conventional SPE, where the MIPs are packed into columns or cartridges40,41 and batch mode SPE, in which the MIPs are incubated with the sample.32 A major advantage of MIP-based SPE, related to the high selectivity of the sorbent, is the achievement of an efficient sample clean-up.
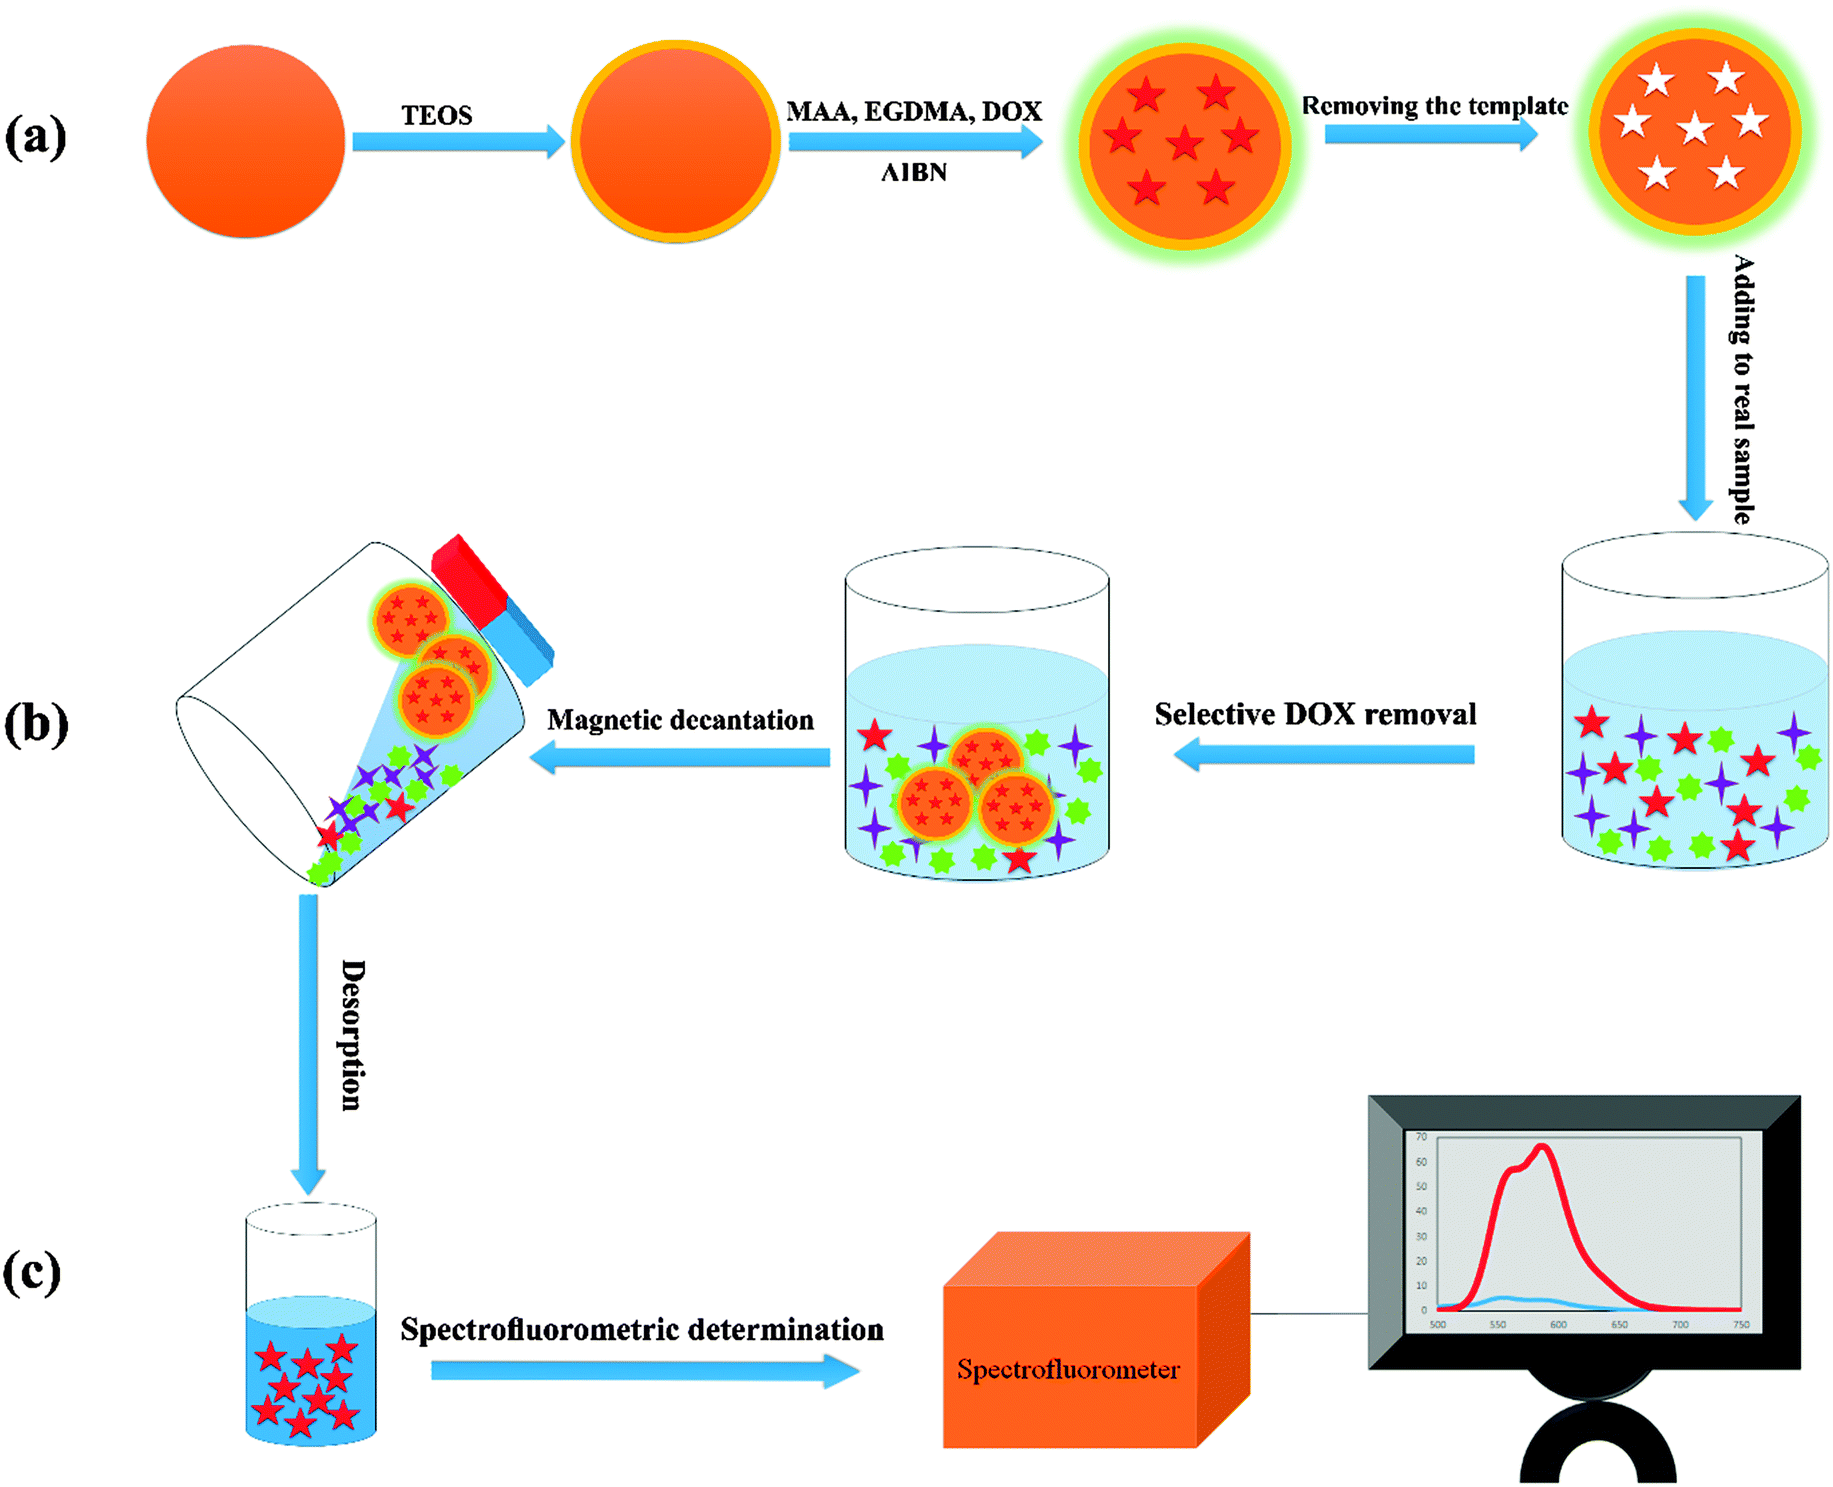 | ||
| Scheme 1 Overall description of the steps involved in drug determination: (a) synthesis of the adsorbent, (b) selective removal of the drug and (c) preconcentration and spectrofluorometric determination. | ||
This work reports on the synthesis of a DOX imprinted polymer coated magnetic nanoadsorbent for selective solid phase extraction of DOX from human urine samples. The concentration of DOX in the extract was determined using fluorescence spectroscopy measurements. This procedure is simple, rapid, selective and sensitive. It may be noted that many reports have been published on the determination of DOX, including conventional spectrofluorimetry.12,13 However, the present method is more sensitive compared with the previously reported ones.18,19,42,43
Experimental
Reagents and materials
All the chemicals used were of analytical reagent grade or highest purity available and were purchased from Merck Company (Darmstadt, Germany). Doxorubicin hydrochloride was purchased from Sigma-Aldrich Company. Double distilled water (DDW) was used throughout the work. All glassware was soaked in dilute nitric acid for 12 h, and then thoroughly rinsed with DDW. The DOX stock solution was prepared in DDW from its hydrochloride salt, and working standard solutions of different DOX concentrations were prepared daily by diluting the stock solution with DDW. Britton–Robinson universal buffer was used for pH adjustments.Apparatus
The size, morphology and structure of the synthesized nanospheres were characterized by transmission electronic microscopy (TEM, Philips-CMC-300 kV). The crystal structure of the synthesized nanospheres was determined using an X-ray diffractometer (XRD, 38066 Riva, d/G. via M. Misone, 11/D (TN) Italy) at ambient temperature. The magnetic properties of the synthesized nanospheres were measured with a vibrating sample magnetometer (VSM, 4 in. Daghigh Meghnatis Kashan Co., Kashan, Iran). The mid-infrared spectra of the synthesized nanospheres in the 4000–400 cm−1 region were recorded by an FT-IR spectrometer (Perkin-Elmer model Spectrum GX) using KBr pellets. A Perkin Elmer (LS50B) luminescence spectrometer was used for DOX spectrofluorometric concentration determination. A Metrohm model 713 pH meter was used for pH measurements. A 40 kHz universal ultrasonic cleaner water bath (RoHS, Korea) was used.Synthesis of investigated nanospheres (Scheme 1a)
DOX was imprinted onto the surface of magnetite nanospheres as magnetic carriers, as follows:Synthesis of DOX imprinted polymer coated magnetite nanospheres (DOXMNSs)
Typically 3 mmol of MAA (methacrylamide, as the functional monomer), 20 mmol of EGDMA (ethylene glycol dimethacrylate, as the cross-linker), and 400.0 mg of SCMNPs agent were dispersed into a 45.0 mL acetonitrile solution of DOX (1 mmol, as the template). After sealing, shaking, and purging the mixture with nitrogen, a 5.0 mL acetonitrile solution with 50.0 mg of AIBN (2,2′-azoisobutyronitrile, as the initiator) was added to the suspension with a sample injector. The resultant mixture was ultrasonicated at 60 °C for 2 h under nitrogen, and then stirred overnight. The product was washed with the mixture of methanol![[thin space (1/6-em)]](https://www.rsc.org/images/entities/char_2009.gif) :1.0 mol L−1 acetic acid (1:1 v/v) until no template molecule (DOX) was detected spectrofluorometrically in the washing solution. Then, the product (DOXMNSs) was separated by a magnet and washed overnight with the mixture of methanol:1.0 mol L−1 acetic acid (1:1 v/v). Then, the resulting nanospheres were dried under vacuum for 12 h. As a reference, non-imprinted polymer coated SCMNSs (NIPMNPs), which did not contain the template, were also prepared in parallel with the DOXMNSs using the same synthetic protocol in the absence of the template.
:1.0 mol L−1 acetic acid (1:1 v/v) until no template molecule (DOX) was detected spectrofluorometrically in the washing solution. Then, the product (DOXMNSs) was separated by a magnet and washed overnight with the mixture of methanol:1.0 mol L−1 acetic acid (1:1 v/v). Then, the resulting nanospheres were dried under vacuum for 12 h. As a reference, non-imprinted polymer coated SCMNSs (NIPMNPs), which did not contain the template, were also prepared in parallel with the DOXMNSs using the same synthetic protocol in the absence of the template.
DOX removal experiments (Scheme 1b)
To a 25.0 mL sample solution containing DOX and 10.0 mL Britton–Robinson buffer solution of pH 7.5, 0.02 g of DOXMNSs was added. The solution was shaken at room temperature for 25.0 min. Subsequently, the DOX loaded DOXMNSs were separated from the mixture with a permanent hand-held magnet within 60 s. The residual amount of the drug in the solution was determined spectrofluorometrically at λem = 558 nm (λex = 462 nm) (emission and excitation spectra of DOX are shown in Fig. 1). The adsorption percentage, i.e., the drug removal efficiency (%Re), was determined using the following equation: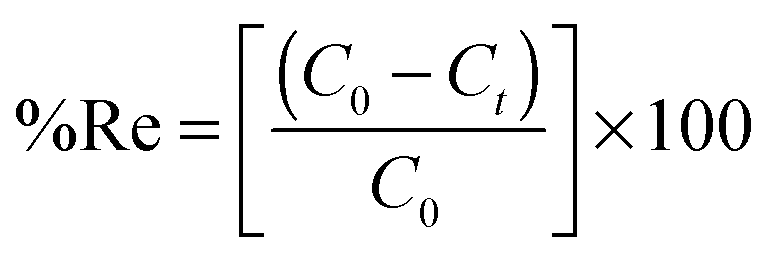 | (1) |
 | ||
| Fig. 1 Fluorescence excitation (—) at λem = 558 nm and emission spectra (---) at λex = 462 for DOX in water at pH 7.5 at room temperature. | ||
DOX preconcentration and spectrofluorometric determination (Scheme 1c)
Preconcentration studies for the determination of trace amounts of DOX were performed by adding 250.0 mL of the solution containing 2.0–150.0 ng mL−1 DOX and 150 mL of Britton–Robinson buffer of pH 7.5 to 0.02 g of DOXMNSs; the solution was stirred for 25 min. The concentration of DOX decreased with time due to adsorption by the DOXMNSs. The DOX loaded nanospheres were separated by magnetic decantation, and desorption was performed with a 2.0 mL of the mixture of methanol:1.0 M acetic acid (1:1 v/v). The concentration of DOX in the resulting solution was measured spectrofluorometrically at λem = 555 nm (λex = 462 nm).
Urine samples pretreatment
Drug-free urine samples were collected from healthy donors with informed consent and all experiments were performed in compliance with the relevant laws and institutional guidelines. All urine samples were stored at −20 °C. Then, 50.0 mL of each sample was diluted with 150 mL of Britton–Robinson buffer solution of pH 7.5 and 50.0 mL of DDW and directly subjected to the SPE procedure (the above section). Urine samples were spiked with DOX at ng mL−1 concentration levels.Results and discussion
In order to synthesize DOXMNSs, MNSs were first synthesized by a solvothermal reduction method. Then, the synthesized nanospheres were coated with a layer of SiO2 using TEOS silanization agent. Finally, the surface of the synthesized SCMNSs was imprinted with DOX using MAA as the functional monomer, EGDMA as the cross-linker, DOX as the template and AIBN as the polymerization reaction initiator.Characterization of the investigated nanospheres
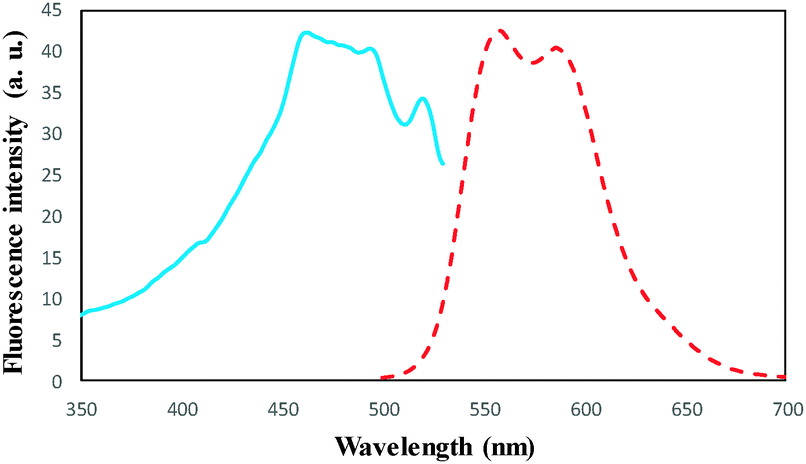
The magnetization curves of the bare MNSs, SCMNSs and DOXMNSs recorded with VSM are illustrated in Fig. 2. As shown in Fig. 2, the magnetization of the samples would approach the saturation values when the applied magnetic field increases to 10000 Oe. The saturation magnetization of the MNSs was 41.47 emu g−1. For SCMNSs and DOXMNSs, the saturation magnetizations were 30.13 and 27.19 emu g−1, respectively. These results showed that magnetic properties are hardly affected by the surface modification. A magnetization reduction of about 27.34% was observed between the bare and SiO2-coated Fe3O4 nanospheres (SCMNSs), and about 9.76% between SCMNSs and DOXMNSs. This may be related to the nanospheres size effect, the increased surface disorder, and the diamagnetic contribution of SiO2 and imprinted polymer layers.
 | ||
| Fig. 2 Magnetization curves obtained by vibrating sample magnetometer at room temperature: (▲) bare MNSs; (◆) SCMNSs; and (■) DOXMNSs nanospheres. | ||
The FTIR spectra for the products in each step of the DOXMNSs synthesis were recorded to verify the formation of the expected products. The related spectra are shown in Fig. 3. The characteristic absorption band of Fe–O in Fe3O4 (around 580 cm−1) is observed in Fig. 3a. A strong peak at around 1090 cm−1 in Fig. 3b is attributed to Si–O in SiO2. Two new absorption peaks at 1723 cm−1 and 1252 cm−1 in Fig. 3c are assigned to C![[double bond, length as m-dash]](https://www.rsc.org/images/entities/char_e001.gif) O and C–N bands in the polymer-coated final product (DOXMNSs), respectively. Moreover, new absorption peaks at 2819 and 2857 cm−1 are related to the stretching modes of aliphatic C–H bonds in the final product.21 The peaks at around 3300 cm−1 are attributed to water and the surface hydroxyl groups of the nanospheres. Based on the above results, it can be concluded that the fabrication procedure has been successfully performed.
O and C–N bands in the polymer-coated final product (DOXMNSs), respectively. Moreover, new absorption peaks at 2819 and 2857 cm−1 are related to the stretching modes of aliphatic C–H bonds in the final product.21 The peaks at around 3300 cm−1 are attributed to water and the surface hydroxyl groups of the nanospheres. Based on the above results, it can be concluded that the fabrication procedure has been successfully performed.
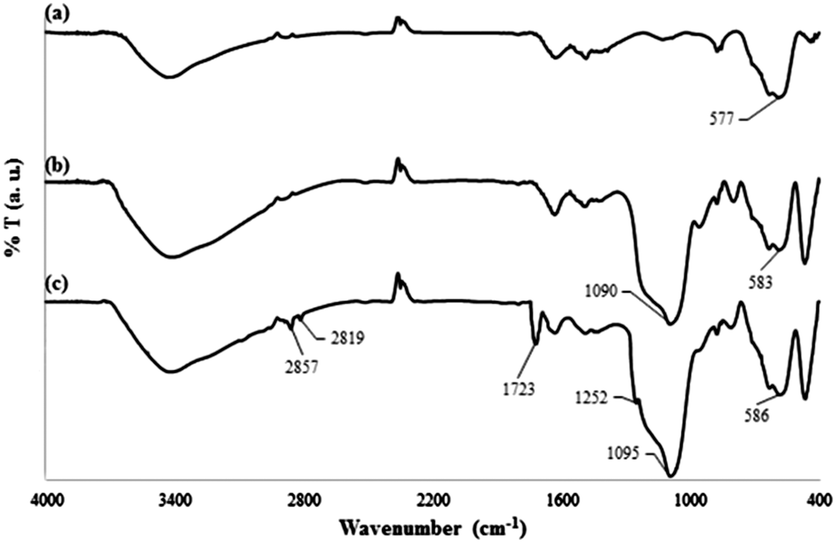 | ||
| Fig. 3 FT-IR spectra for (a) MNSs, (b) SCMNSs and (c) DOXMNSs nanospheres. | ||
The XRD pattern of DOXMNSs (Fig. 4) shows diffraction peaks that are indexed to the (220), (311), (400), (422), (511), (440) and (553) reflection characteristics of the cubic spinel phase of Fe3O4 (JCPDS powder diffraction data file no. 79-0418), revealing that the resultant nanospheres are mostly Fe3O4. The average crystallite size of the DOXMNSs nanospheres was estimated to be 10 nm from the XRD data according to the Scherrer equation.24
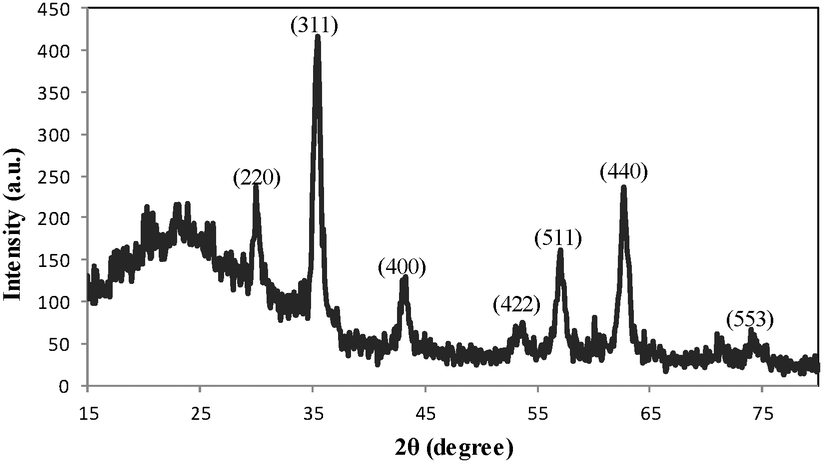 | ||
| Fig. 4 XRD pattern for DOXMNSs nanospheres. | ||
The TEM image of the MNSs in Fig. 5a indicates that spherical monodisperse nanoparticles with an average diameter of about 90 nm were synthesized. Fig. 5b indicates that the MNSs were successfully coated with a core–shell layer of SiO2. Fig. 5c depicts the DOXMNSs nanospheres. The figures show that after the MIP layer coating process, the core–shell layer thickness and morphological properties were changed to some extent.
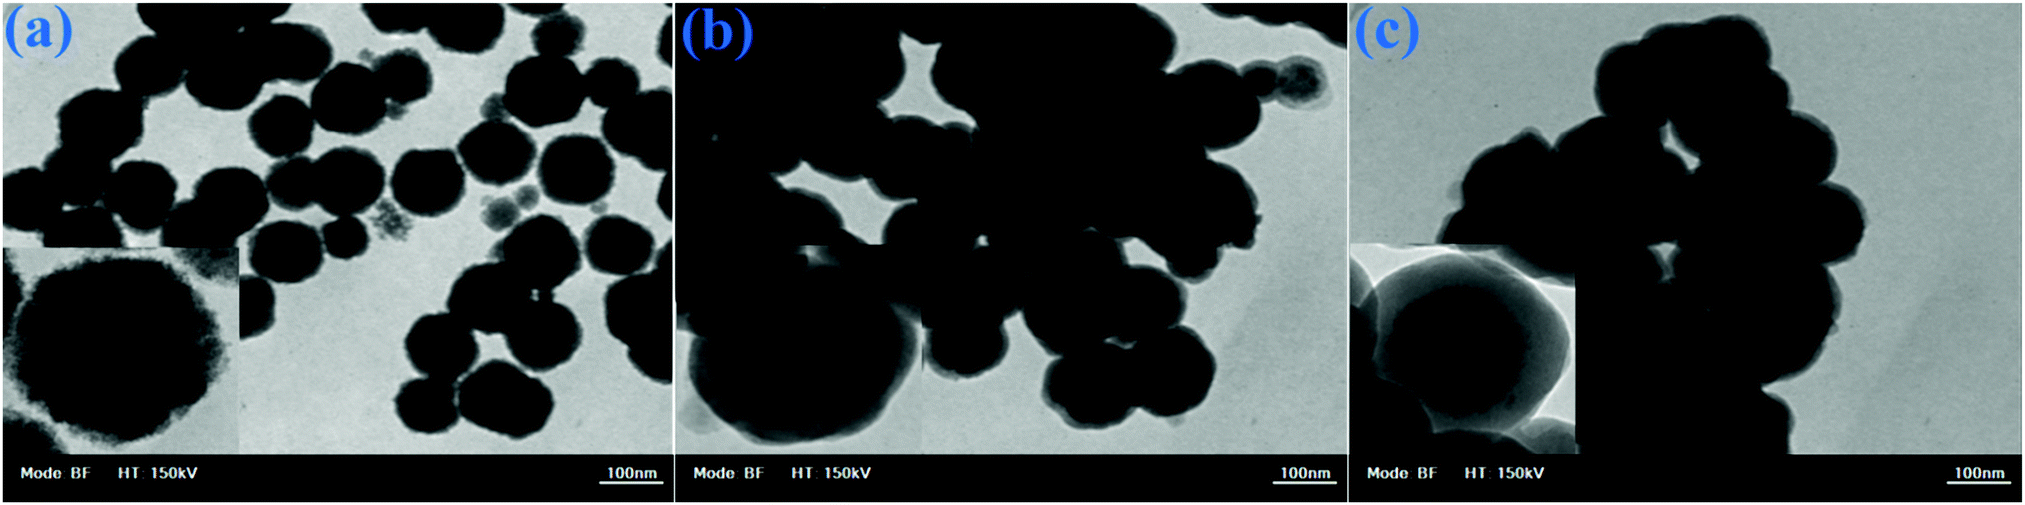 | ||
| Fig. 5 TEM images for (a) MNSs, (b) SCMNSs and (c) DOXMNSs nanospheres. | ||
Point of zero charge (pHPZC) of DOXMNSs nanospheres
The pHPZC of the DOXMNSs was determined in degassed 0.01 mol L−1 NaNO3 solution at room temperature. Aliquots of 30.0 mL 0.01 mol L−1 NaNO3 were mixed with 0.03 g of the nanospheres in several beakers. The initial pH of the solutions was adjusted to 3.0, 4.0, 5.0, 6.0, 7.0, 8.0, 9.0 and 10.0 using 0.01 mol L−1 of HNO3 and/or NaOH solutions, as appropriate. The initial pH values of the solutions were recorded, and the beakers were covered with parafilm and shaken for 24 h. The final pH values were recorded, and the differences between the initial and final pH (ΔpH) of the solutions were plotted against their initial pH values. The pHPZC corresponds to the pH where ΔpH = 0.31 The pHPZC for DOXMNSs was determined using the above procedure and a value of 6.3 was obtained. The results are shown in Fig. 6.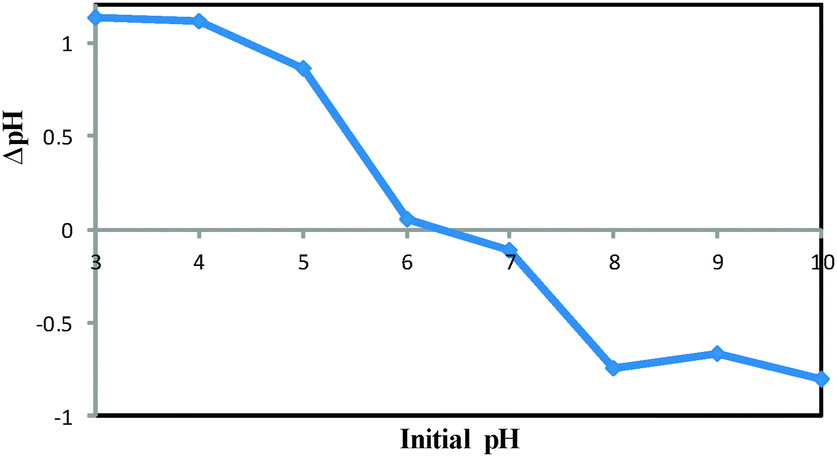 | ||
| Fig. 6 Point of zero charge (pHpzc) of DOXMNSs nanospheres. | ||
Effect of various factors affecting the DOX removal efficiency step
Various factors that can potentially affect the drug removal efficiency (i.e., pH, contact time and nanospheres dosage) were optimized using “one-at-a-time” method. Here are the detailed results.The effect of pH on the DOX removal efficiency was investigated in the range of 3.0–10.0 using an initial DOX concentration of 20.0 mg L−1 and a stirring time of 45 min, where the pH was adjusted with Britton–Robinson buffer. Fig. 7 indicates that the adsorbent provided the highest affinity to DOX at pH 7.5. This is reasonable, because the only species significantly present in the region between Hammett acidity −4.0 and pH 8.0 is the singly charged species with a positive charge at the amino sugar group (at Hammett acidity <−4.0, only the monocation of (D) is significantly present). However, at a pH greater than 8.0, this monocation (C) can lose a proton either from a phenolic group to form a zwitterion (Z) or from the amino sugar group to form the neutral species (N). The generated species may then lose a proton to form the singly charged anions (A) (Scheme 2 (ref. 46)). On the other hand, the adsorbent surface charge at pH < 6.3 (pHPZC = 6.3) is positive, and electrostatic repulsion is responsible for low DOX removal efficiency. But, at a pH range of 6.3–8.0, the adsorbent surface charge is negative, and the electrostatic attraction forces are responsible for a high removal efficiency of the positively charged DOX molecules. At pH > 8.0, the electrostatic repulsion between the negatively charged adsorbent surface and the DOX anions is likely to be responsible for the decrease in the DOX removal efficiency. It should be noted that at these pH values, DOX is partially in its neutral form, and this is another reason for a decrease in the removal efficiency due to a loss of electrostatic attraction forces.
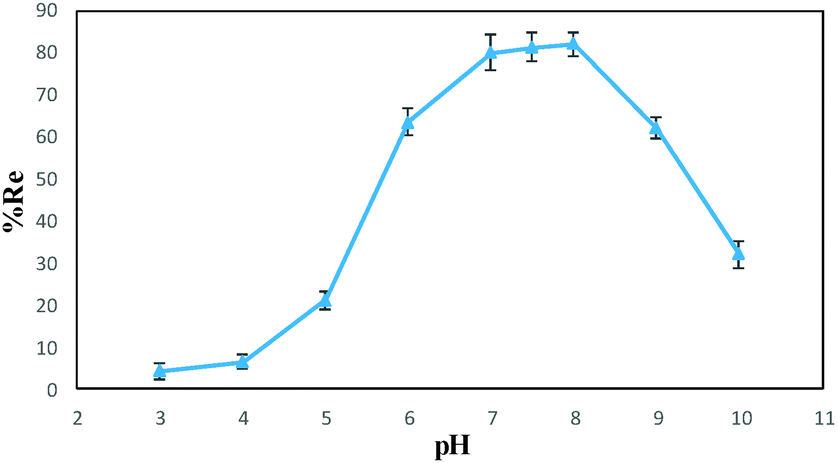 | ||
| Fig. 7 Removal efficiency of DOX at different pH values (conditions: 0.01 g of DOXMNSs, 25 mL of 20.0 mg L−1 DOX, agitation time of 45 min). | ||
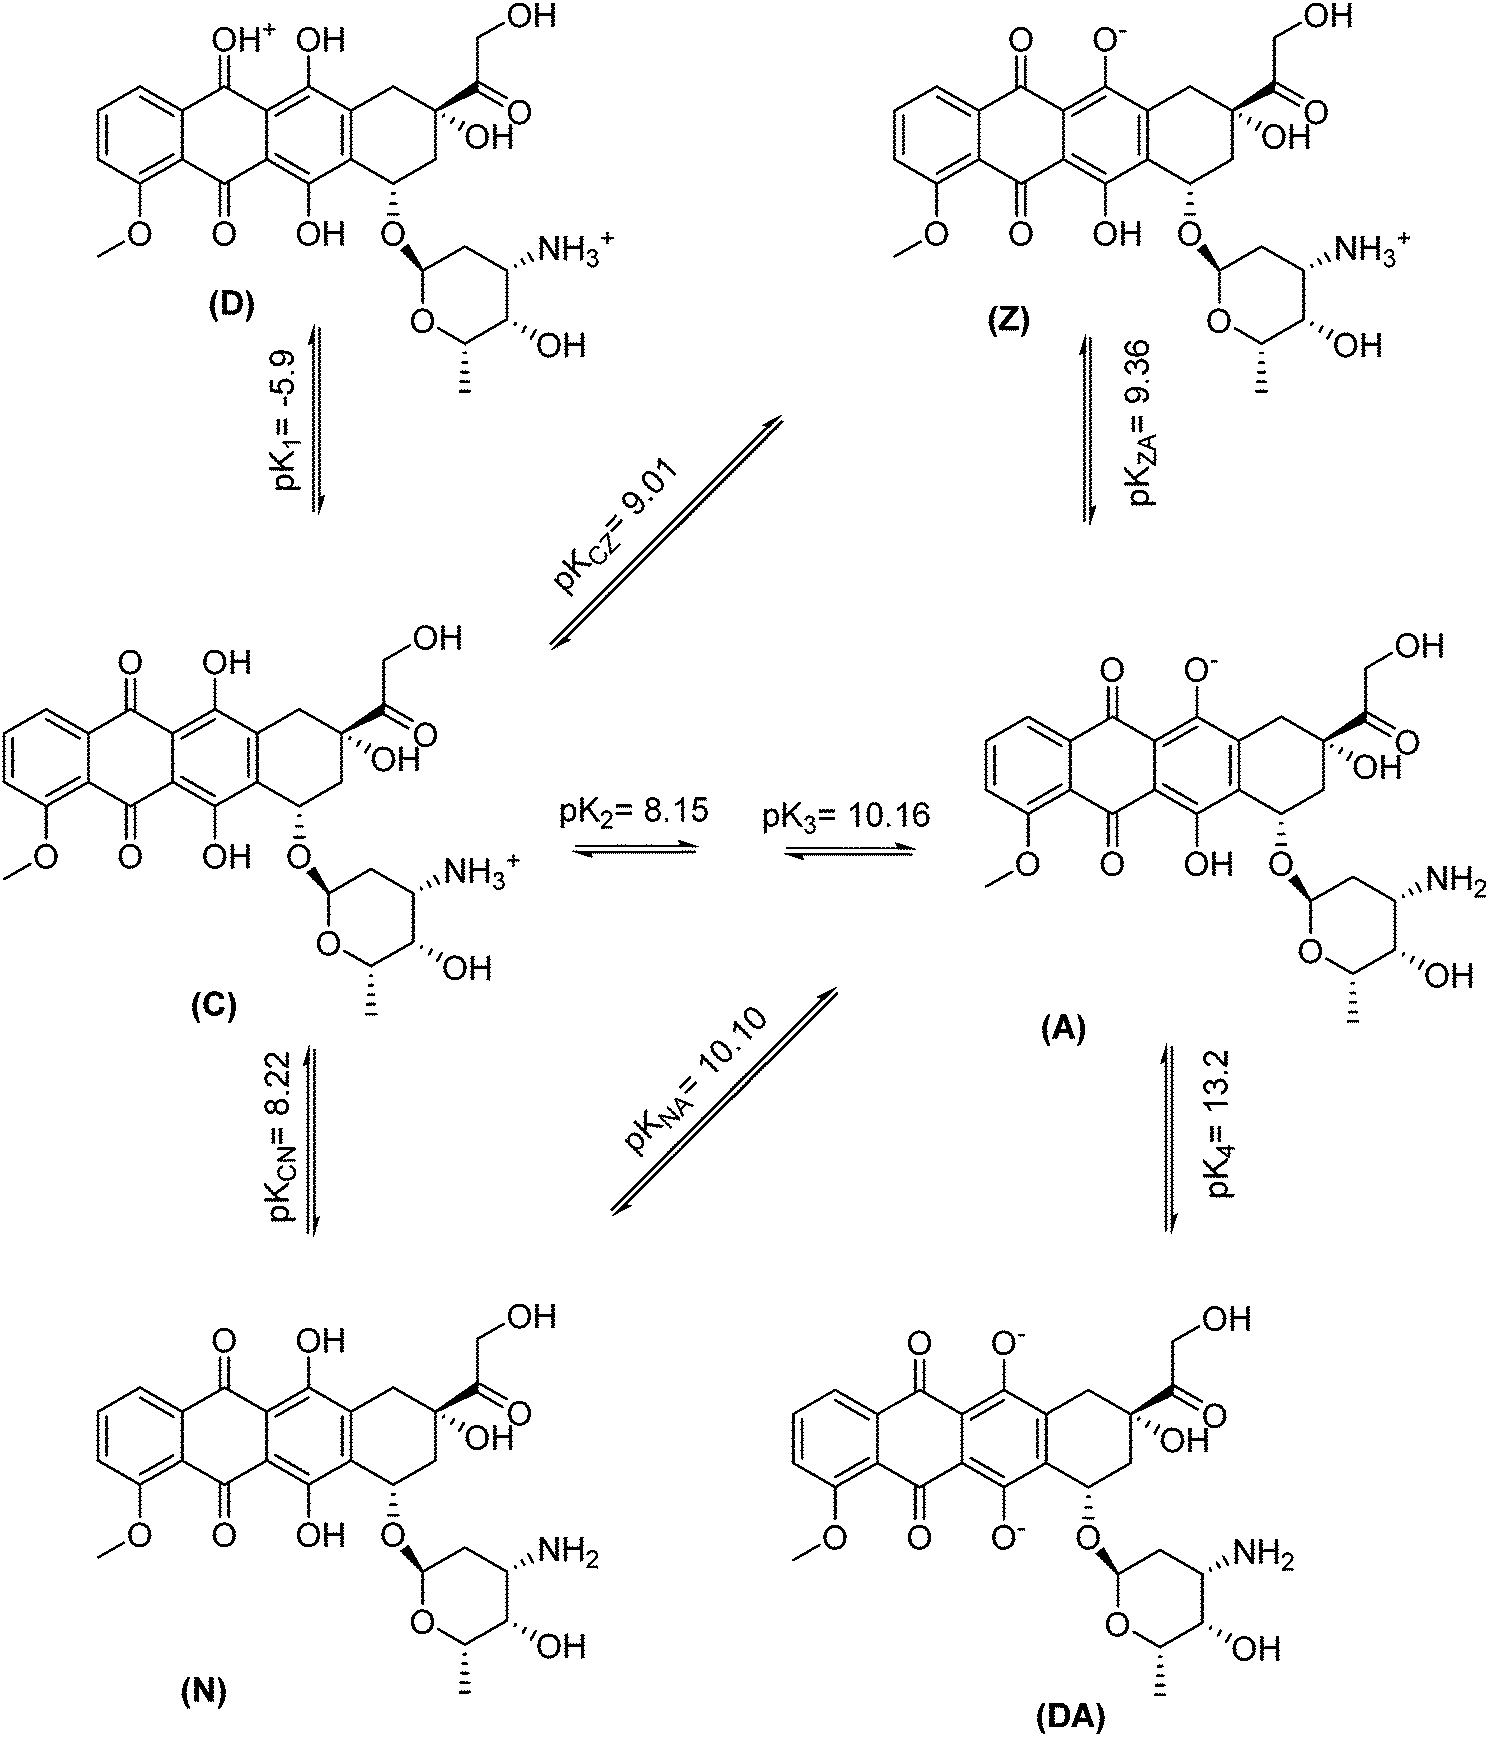 | ||
| Scheme 2 Overall dissociation pathway and negative logarithms of dissociation constants of doxorubicin. | ||
The optimum pH matches well with the normal cellular physiological pH (i.e., pH = 7.5), and the removal efficiency significantly decreases with decreasing pH. The pH-sensitive desorption of the synthesized nanospheres enable it to release active drug in target tissues in which the pH is lower than physiological values,47 such as in the acidic environment of tumor cells. On the other hand, magnetic properties of the nanospheres enable targeted drug delivery to desired tissues with a pre-applied magnetic field. These results can promise a magnetic drug carrier for cancer therapy purposes, after performing the in vivo and in vitro biocompatibility tests.
Effect of various factors affecting the DOX preconcentration efficiency
The aim of this step is to provide the highest preconcentration factor and concentration of the adsorbed drug in the minimum possible volume of desorbing solvent. In this regard, various factors that can potentially affect the drug desorbing efficiency (i.e., type and volume of desorbing solvent, desorbing time and initial sample volume) have been optimized using “one-at-a-time” method. The detailed results are given below::1.0 mol L−1 acetic acid (1:1 v/v)) were performed. After adsorption of DOX, the adsorbent was magnetically separated and washed with DDW. Then, 2.0 mL of the eluent was added to the DOX-loaded DOXMNSs. Samples were collected after 5.0, 10.0, 20.0, 30.0 and 45.0 min contact times to evaluate DOX recovery. The results showed that the mixture of methanol with 1.0 mol L−1 acetic acid (1:1 v/v) is the most effective as a back-extracting solvent and can be used for the quantitative recovery of the drug. The desorption rate was found to be rapid, as almost 98% desorption was completed at about 10.0 min.
Adsorption isotherms
The capacity of the adsorbent is an important factor that determines how much sorbent is required to quantitatively remove a specific amount of the drug from solution. For measuring the adsorption capacity of DOXMNSs and NIPMNPs, the absorbents were added to DOX solutions at various concentrations (under optimum conditions), and the suspensions were stirred at room temperature, followed by magnetic removal of the absorbent. An adsorption isotherm describes the fraction of the sorbate molecules that are partitioned between the liquid and the solid phase at equilibrium. Adsorption of the DOX by DOXMNSs adsorbent was modelled using Freundlich48 and Langmuir49 adsorption isotherm models. The remaining drug in the supernatants was measured spectrofluorometrically at λem = 558 nm (λex = 462 nm), and the results were used to plot the isothermal adsorption curves, as shown in Fig. 8. The equilibrium adsorption data were fitted to Langmuir and Freundlich isotherm models by nonlinear regression. The resulting parameters are summarized in Table 1.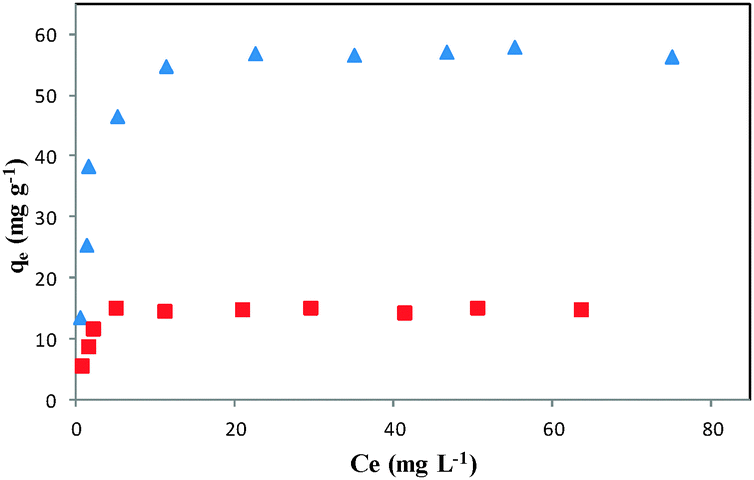 | ||
| Fig. 8 Isothermal adsorption curves of DOX on (▲) DOXMNSs and (■) NIPMNPs adsorbents. | ||
| Isotherm models | Langmuir | Freundlich | ||||||
|---|---|---|---|---|---|---|---|---|
| K L (L mg−1) | q max (mg g−1) | R 2 | RMS | K f | 1/n | R 2 | RMS | |
| DOXMNSs | 0.72 | 59.17 | 0.9695 | 0.79 | 2.85 | 0.23 | 0.8236 | 2.91 |
| NIPMNPs | 0.82 | 15.27 | 0.8962 | 1.14 | 8.86 | 0.14 | 0.6462 | 2.11 |
The higher correlation coefficient obtained for the Langmuir model and lower RMS values indicate that the experimental data are better fitted to this model, and adsorption of DOX on DOXMNSs adsorbents is more compatible with Langmuir assumptions, i.e., adsorption takes place at specific homogeneous sites within the adsorbent. The Langmuir model is based on the physical hypothesis that the maximum adsorption capacity consists of a monolayer adsorption, that there are no interactions between adsorbed molecules, and that the adsorption energy is distributed homogeneously over the entire coverage surface. This sorption model serves to estimate the maximum uptake values, although these cannot be reached in the experiments.
According to the results (Table 1), the maximum amount of DOX that can be adsorbed by DOXMNSs and NIPMNPs was found to be 59.17 and 15.27 mg g−1 at pH 7.5, respectively. The relatively high adsorption capacity of DOXMNSs in comparison with NIPMNPs shows that the adsorption of DOX molecules takes place at a large number of specific homogeneous sites within the adsorbent (specific cavities of the MIP), besides non-specific interactions which are approximately identical for both DOXMNSs and NIPMNPs adsorbents.
Reusability and stability of the adsorbent
The reusability and stability of DOXMNSs for the extraction of DOX was assessed by performing eleven consecutive separations/desorption cycles under the optimized conditions (conditions: 0.02 g of DOXMNSs, 25.0 mL of 2.0 mg L−1 DOX, agitation time of 25 min). Desorption of DOX from the adsorbent was performed with a mixture of methanol:1.0 mol L−1 acetic acid (1:1 v/v), as described in the experimental section. There was no significant change in the performance of the adsorbent during these eleven cycles, indicating that the fabricated DOXMNSs represent a reusable and stable solid phase sorbent for the extraction of DOX.
Analytical application
A calibration graph was constructed from spectrofluorometric measurements of the desorbed DOX after performing adsorption/separation under the optimum conditions described above. The calibration graph was linear in the range of 2.0–150.0 ng mL−1 for a sample volume of 250.0 mL. The calibration equation is IF = 0.6211C + 0.2511 with a determination coefficient of 0.9975 (n = 8), where IF is the fluorescence intensity of the eluate at λem = 555 nm (λex = 462 nm), and C is the concentration of the drug in ng mL−1. The limit of detection, defined as LOD = 3Sb/m, where LOD, Sb and m are the limit of detection, standard deviation of the blank and the slope of the calibration graph, respectively, was found to be 1.3 ng mL−1 of DOX. As the drug in 250.0 mL of the sample solution was concentrated to 2.0 mL, a maximum preconcentration factor of 125.0 was achieved in this method. The relative standard deviations (RSD) for 100.0 and 5.0 ng mL−1 of the drug were 0.82% and 1.41% (n = 3), respectively.The analytical applicability of the proposed method was evaluated by determining the DOX content of different amounts of DOX-spiked healthy human urine samples using the DOXMNSs adsorbent. The results are given in Table 2.
| Sample | Spiked value (ng mL−1) | Found (ng mL−1) | Recovery percent |
|---|---|---|---|
| 1 | 10.00 | 9.61 ± 0.11 | 96.10 |
| 2 | 30.00 | 31.10 ± 1.02 | 103.67 |
| 3 | 75.00 | 74.34 ± 0.86 | 99.12 |
| 4 | 130.00 | 132.41 ± 0.77 | 101.85 |
The results show that the proposed method results in good recoveries of DOX added to urine samples, and the method is a good candidate for DOX determination in urine samples. Since only 5.9% of DOX is excreted by the kidney during the initial 48 hours,50 concentration of DOX in urine must be at low levels in comparison to its plasma concentration level. Therefore, a low LOD value for the proposed method can be considered while dealing with DOX determination in urine samples.
Table 3 shows a comparison between the results obtained by the present method with those obtained by some other methods reported for the determination of DOX.
| Method | LOD (ng mL−1) | Linear range (ng mL−1) | Sample | Ref. |
|---|---|---|---|---|
| a Excitation–emission matrix fluorescence measurements and multi-way chemometric methods based on parallel factor analysis. b Total synchronous fluorescence spectroscopic data modelled with first- and second-order algorithms. c Second-order spectrophotometric data generated by a pH-gradient flow injection technique. d Adsorptive square-wave voltammetry. e Dual lifetime referenced fluorometry. f Solid phase extraction/high-performance liquid chromatography/tandem mass spectrometry. g Concentrations have been originally reported as μg mL−1 unit. h Concentrations have been originally reported as μmol L−1 unit. | ||||
| EEM-PARAFACa | 32g | — | Human plasma | 42 |
| TSFSb | 10g | — | Human plasma | 43 |
| pH-gradient flow-injectionc | 770g | 1500–12000g |
Human plasma | 18 |
| AdSWVd | 1.50 | 4.99–59.64 | Human urine | 1 |
| DLRe | 217.4h | — | Human urine | 19 |
| SPE/HPLC/MSf | 0.04 | 0.1–2.0 | Human urine | 20 |
| MIP/SPE/FL | 1.3 | 2.0–150.0 | Human urine | This work |
In this comparison, the determination of DOX by HPLC in combination with mass spectrometry with the SPE sample preparation method (SPE/HPLC/MS) yielded the lowest LOD. Such measurements, however, depend on expensive instrumentation and are costly to operate. In contrast, it is much simpler and less expensive to measure the intrinsic fluorescence of the drug after preconcentration using the proposed MIP adsorbent. Other advantages of the proposed method are low LOD, wide linear range, simplicity and high removal capacity of the adsorbent. The major advantage of the magnetic adsorbents is easy separation of the adsorbent after completion of the drug removal process. On the other hand, consumption of very small volumes of less toxic organic solvents in comparison to HPLC methods is another advantage of the proposed method.
Conclusion
Selective DOX-imprinted polymer coated magnetite nanospheres were synthesized. The preparation of this material was relatively simple and rapid. The synthesized magnetic nanospheres could disperse well in the sample medium and were subsequently removed easily from the medium, after surface adsorption of the DOX drug. The DOX removal and preconcentration results showed that under optimum conditions, sensitive DOX fluorimetric determination in the linear concentration range of 2.0–150.0 ng mL−1, with an LOD of 1.3 ng mL−1 was achievable. This study indicated that the sorption of DOX on the imprinted polymer was much better than that on non-imprinted polymer. The imprinted polymer also presents the advantages of high adsorption capacity and high chemical stability. The proposed method was successfully applied to the analysis of DOX in human urine samples, and the results showed that the method is a powerful one for DOX determination in comparison to previously reported methods. Finally, the pH-sensitive desorption behavior of the synthesized nanospheres confirms the use of a magnetic drug carrier for cancer therapy purposes after performing the in vivo and in vitro biocompatibility tests.Acknowledgements
This work is supported by the Bu-Ali Sina University Research Council and Center of Excellence in Development of Environmentally Friendly Methods for Chemical Synthesis (CEDEFMCS), and the authors acknowledge the support provided for this work.References
- O. Vajdle, J. Zbiljić, B. Tasić, D. Jović, V. Guzsvány and A. Djordjevic, Electrochim. Acta, 2014, 132, 49 CrossRef CAS PubMed.
- R. H. Blum and S. K. Carter, Ann. Intern. Med., 1974, 80, 249 CrossRef CAS PubMed.
- D. L. Chin, B. L. Lum and B. I. Sikic, J. Chromatogr. B: Anal. Technol. Biomed. Life Sci., 2002, 779, 259 CrossRef CAS.
- G. P. Sartiano, W. E. Lynch and W. D. Bullington, J. Antibiot., 1979, 32, 1038 CrossRef CAS.
- J. W. Lown, Pharmacol. Ther., 1993, 60, 185 CrossRef CAS.
- D. L. Chin, B. L. Lum and B. I. Sikic, J. Chromatogr. B: Anal. Technol. Biomed. Life Sci., 2002, 779, 259 CrossRef CAS.
- R. D. Arnold, J. E. Slack and R. M. Straubinger, J. Chromatogr. B: Anal. Technol. Biomed. Life Sci., 2004, 808, 141 CrossRef CAS PubMed.
- S. Ahmed, N. Kishikawa, K. Ohyama, M. Wada, K. Nakashima and N. Kuroda, Talanta, 2009, 78, 94 CrossRef CAS PubMed.
- A. Kümmerle, T. Krueger, M. Dusmet, C. Vallet, Y. Pan, H. B. Ris and L. A. Decosterd, J. Pharm. Biomed. Anal., 2003, 33, 475 CrossRef.
- R. Ricciarello, S. Pichini, R. Pacifici, I. Altieri, M. Pellegrini, A. Fattorossi and P. Zuccaro, J. Chromatogr. B: Biomed. Sci. Appl., 1998, 707, 219 CrossRef CAS.
- L. B. Liao, H. Y. Zhou and X. M. Xiao, J. Mol. Struct., 2005, 749, 108 CrossRef CAS PubMed.
- Y. Liu and B. Danielsson, Anal. Chim. Acta, 2007, 587, 47 CrossRef CAS PubMed.
- K. K. Karukstis, E. H. Z. Thompson, J. A. Whiles and R. J. Rosenfeld, Biophys. Chem., 1998, 73, 249 CrossRef CAS.
- Q. Yan, W. Priebe, J. B. Chaires and R. S. Czernuszewicz, Biospectroscopy, 1997, 3, 307 CrossRef CAS.
- K. Hirano, T. Nagae, T. Adachi, Y. Ito and M. Sugiura, J. Pharmacobiodyn., 1983, 6, 588 CrossRef CAS.
- E. A. Hillard, F. C. de Abreu, D. C. M. Ferreira, G. Jaouen, M. O. F. Goulart and C. Amatore, Chem. Commun., 2008, 2612–2628, 10.1039/B718116G.
- Š. Komorsky-Lovrić, Bioelectrochemistry, 2006, 69, 82 CrossRef PubMed.
- M. R. Alcaráz, A. V. Schenone, M. J. Culzoni and H. C. Goicoechea, Microchem. J., 2014, 112, 25 CrossRef PubMed.
- F. Martínez Ferreras, O. S. Wolfbeis and H. H. Gorris, Anal. Chim. Acta, 2012, 729, 62 CrossRef PubMed.
- C. Sottani, G. Tranfo, M. Bettinelli, P. Faranda, M. Spagnoli and C. Minoia, Rapid Commun. Mass Spectrom., 2004, 18, 2426 CrossRef CAS PubMed.
- T. Madrakian, A. Afkhami, M. A. Zolfigol, M. Ahmadi and N. Koukabi, Nano-Micro Lett., 2012, 4, 57 CrossRef CAS.
- T. Madrakian, A. Afkhami, M. Rahimi, M. Ahmadi and M. Soleimani, Talanta, 2013, 115, 468 CrossRef CAS PubMed.
- T. Madrakian, A. Afkhami, H. Mahmood-Kashani and M. Ahmadi, J. Iran. Chem. Soc., 2013, 10, 481 CrossRef CAS PubMed.
- T. Madrakian, A. Afkhami and M. Ahmadi, Chemosphere, 2013, 90, 542 CrossRef CAS PubMed.
- A. Afkhami, R. Moosavi and T. Madrakian, Talanta, 2010, 82, 785 CrossRef CAS PubMed.
- A. Afkhami, H. Bagheri and T. Madrakian, Desalination, 2011, 281, 151 CrossRef CAS PubMed.
- M. Roldán-Pijuán, R. Lucena, S. Cárdenas and M. Valcárcel, Microchem. J., 2014, 115, 87 CrossRef PubMed.
- M. Cai, X. Chen, X. Wei, S. Pan, Y. Zhao and M. Jin, Food Chem., 2014, 158, 459 CrossRef CAS PubMed.
- M. Javanbakht, A. M. Attaran, M. H. Namjumanesh, M. Esfandyari-Manesh and B. Akbari-adergani, J. Chromatogr. B: Anal. Technol. Biomed. Life Sci., 2010, 878, 1700 CrossRef CAS PubMed.
- C. He, Y. Long, J. Pan, K. Li and F. Liu, J. Biochem. Biophys. Methods, 2007, 70, 133 CrossRef CAS PubMed.
- T. Madrakian, A. Afkhami, H. Mahmood-Kashani and M. Ahmadi, Talanta, 2013, 105, 255 CrossRef CAS PubMed.
- T. Madrakian, M. Ahmadi, A. Afkhami and M. Soleimani, Analyst, 2013, 138, 4542 RSC.
- A. Afkhami, H. Ghaedi, T. Madrakian, M. Ahmadi and H. Mahmood-Kashani, Biosens. Bioelectron., 2013, 44, 34 CrossRef CAS PubMed.
- X. Sun, J. Wang, Y. Li, J. Jin, J. Yang, F. Li, S. M. Shah and J. Chen, J. Chromatogr. A, 2014, 1360, 9 CrossRef CAS PubMed.
- W. Rao, R. Cai, Y. Yin, F. Long and Z. Zhang, Talanta, 2014, 128, 170 CrossRef CAS PubMed.
- Y. Shiraishi, T. Suzuki and T. Hirai, New J. Chem., 2010, 34, 714 RSC.
- X. Su, X. Li, J. Li, M. Liu, F. Lei, X. Tan, P. Li and W. Luo, Food Chem., 2015, 171, 292 CrossRef CAS PubMed.
- S. Rimmer, Chromatographia, 1998, 47, 470 CAS.
- S. G. Dmitrienko, V. V. Irkha, A. Y. Kuznetsova and Y. A. Zolotov, J. Anal. Chem., 2004, 59, 808 CrossRef CAS.
- J. Olsen, P. Martin and I. D. Wilson, Anal. Commun., 1998, 35, 13H RSC.
- A. Zander, P. Findlay, T. Renner, B. Sellergren and A. Swletlow, Anal. Chem., 1998, 70, 3304 CrossRef CAS.
- M. G. Trevisan and R. J. Poppi, Anal. Chim. Acta, 2003, 493, 69 CrossRef CAS.
- A. Schenone, M. Culzoni, A. Campiglia and H. Goicoechea, Anal. Bioanal. Chem., 2013, 405, 8515 CrossRef CAS PubMed.
- H. Deng, X. Li, Q. Peng, X. Wang, J. Chen and Y. Li, Angew. Chem., Int. Ed., 2005, 44, 2782 CrossRef CAS PubMed.
- C. L. Fang, K. Qian, J. Zhu, S. Wang, X. Lv and S. H. Yu, Nanotechnology, 2008, 19, 125601 CrossRef PubMed.
- R. J. Sturgeon and S. G. Schulman, J. Pharm. Sci., 1977, 66, 958 CrossRef CAS.
- M. B. Yatvin, W. Kreutz, B. A. Horwitz and M. Shinitzky, Science, 1980, 210, 1253 CAS.
- H. Freundlich and W. Heller, J. Am. Chem. Soc., 1939, 61, 2228 CrossRef CAS.
- I. Langmuir, J. Am. Chem. Soc., 1916, 38, 2221 CrossRef CAS.
- K. Mross, P. Maessen, W. J. van der Vijgh, H. Gall, E. Boven and H. M. Pinedo, J. Clin. Oncol., 1988, 6, 517 CAS.
| This journal is © The Royal Society of Chemistry and the Centre National de la Recherche Scientifique 2015 |