Light harvesting properties of some new heteroleptic dithiocarbimate–diamine/diimine complexes of Ni, Pd and Pt studied as photosensitizer in dye-sensitized TiO2 solar cells†
Kiran
Diwan
a,
Ratna
Chauhan
a,
Santosh K.
Singh
a,
Bandana
Singh
a,
Michael G. B.
Drew
b,
Lal
Bahadur
a and
Nanhai
Singh
*a
aDepartment of Chemistry, Banaras Hindu University, Varanasi-221005, U. P., India. E-mail: nsingh@bhu.ac.in; nsinghbhu@gmail.com; lbahadur@bhu.ac.in; Fax: +91-542-2368127
bDepartment of Chemistry, University of Reading, Whiteknights, Reading, RG6 6AD, UK
First published on 17th September 2013
Abstract
This contribution describes the light harvesting efficiencies of new heteroleptic complexes of the form [M(L)(L′)] where L = p-tolylsulfonyldithiocarbimate (p-CH3C6H4SO2N![[double bond, length as m-dash]](https://www.rsc.org/images/entities/char_e001.gif) CS22−); M = Ni(II), L′ = 2,2′-bipyridine (bpy) (1) or 1,10-phenanthroline (phen) (2) or N,N,N′,N′-tetramethylethylenediamine (tmed) (3); M = Pd(II), L′ = bpy (4) or phen (5) or tmed (6); and M = Pt(II), L′ = bpy (7) or phen (8) or tmed (9). These have been characterized by elemental analysis, IR, 1H and 13C NMR and UV-visible spectroscopies, and 1, 4 and 6 by single crystal X-ray diffraction. UV-visible absorption, electrochemical behavior and structural features of the ligand aromatic sulfonyldithiocarbimate containing free sulfonyl oxygen atoms serving as a typical anchoring group on TiO2 semiconductor electrode of the nickel complexes enable them to act as potential photosensitizers for solar energy conversion. This study widens the scope for square planar heteroleptic complexes with a suitable combination of metal ions and ligands to be explored as photosensitizers.
CS22−); M = Ni(II), L′ = 2,2′-bipyridine (bpy) (1) or 1,10-phenanthroline (phen) (2) or N,N,N′,N′-tetramethylethylenediamine (tmed) (3); M = Pd(II), L′ = bpy (4) or phen (5) or tmed (6); and M = Pt(II), L′ = bpy (7) or phen (8) or tmed (9). These have been characterized by elemental analysis, IR, 1H and 13C NMR and UV-visible spectroscopies, and 1, 4 and 6 by single crystal X-ray diffraction. UV-visible absorption, electrochemical behavior and structural features of the ligand aromatic sulfonyldithiocarbimate containing free sulfonyl oxygen atoms serving as a typical anchoring group on TiO2 semiconductor electrode of the nickel complexes enable them to act as potential photosensitizers for solar energy conversion. This study widens the scope for square planar heteroleptic complexes with a suitable combination of metal ions and ligands to be explored as photosensitizers.
Introduction
In recent years, considerable effort has been applied to the search for eco-friendly, inexpensive, and stable new materials based on commercial dyes1 and synthetic inorganic as well as organic compounds2 to be used as photosensitizers in regenerative dye sensitized solar cells (DSSCs), a potential low cost alternative to expensive silicon-based photovoltaic devices.3 There are certain pre-requisites for a compound to act as a good photosensitizer. The compound should have (i) a high absorption coefficient in the visible region, (ii) a suitable redox potential for electron injection from excited dye molecules to the conduction band of the semiconductor and also for the reduction of the resulting oxidized dye molecule by the reduced species of the redox couple present in the cell electrolytes and (iii) suitable anchoring group(s) helping in its adsorption onto the TiO2 semiconductor electrode. Also, efficient remote interfacial electron transfer pathways have been demonstrated for light to electrical energy conversion through supramolecular sensitizers.4These properties are essential for sustaining a large number of turnovers of the whole process upon irradiation with light. Currently tris-heteroleptic Ru(II) polypyridyl complexes are well established as efficient dyes with high conversion efficiencies.5 Another important class of dyes based on metallophthalocyanins (MPcs) have shown somewhat smaller conversion efficiencies.6 Recently, we have reported impressive conversion efficiencies for some transition metal dithiocarbamate complexes containing ferrocenyl groups.7
The mononuclear mixed-ligand square planar complexes of platinum(II) are of great importance because of their remarkable opto-electronic properties, which offer possible applications in light emitting,8 chemical and biomolecule sensors,9,10 and as catalysts for hydrogen production.11 The charge transfer excited states, photophysical and electrochemical properties of heteroleptic Pt(II)(diimine)(dithiolate) [diimine = 2,2′-bipyridine (bpy), 1,10-phenanthroline (phen) and substituted polypyridines; dithiolate = dithiocarbamate (dtc−), dithiocarbimate2−, 1-ethoxycarbonyl-1-cyanoethylene-2,2-dithiolate (ecda2−), isomaleonitrile dithiolate (i-mnt2−), maleonitrile dithiolate (mnt2−), 2-oxo-1,3-dithiole-4,5-dithiolate (dmid2−), 3,4-toluenedithiolate (tdt2−), quinoxaline-2,3-dithiolate (qdt2−) and 1,2-benzendithiolate (bdt2−)] complexes have been studied in detail.12 Many of these complexes have been exploited in solar energy conversion schemes as dyes.12g,h,13 Recently the sensitizing activities of nickel complexes, Ni(II)(dcbpy)(qdt) and Ni(II)(decbpy)(qdt) (dcbpy = 4,4′-dicarboxy-2,2′-bipyridine; decbpy = 4,4′-di(CO2Et)-2,2′-bipyridine) have been demonstrated.14 The low photocurrent of these sensitizers was ascribed to a short-lived lifetime causing a weak charge injection from the sensitizers. Based on spectroscopic and electrochemical studies and extended Hückel MO calculations it was indicated that the LUMO is the π* localized on diimine ligands, whereas the HOMO has substantial contributions from both the metal d(Pt) and dithio ligand’s p(S) orbitals.12f Unlike extensively studied platinum complexes, nickel and palladium complexes are rather limited.15
Despite some obvious similarities, the ligand dianionic 1,1-dithiocarbimate (Fig. 1) differs significantly from monoanionic and dianionic 1,1- and 1,2-dithio ligands dtc−, ecda2−, i-mnt2−, mnt2−, dmid2−, tdt2−, qdt2− and bdt2−. The ligand dianionic dithiocarbimate (Fig. 1) has some remarkable features: (i) it can provide greater delocalization beyond the MS2 bond through the CN and C–S groups; (ii) it has both hard (N, O) and soft (S) donor atoms available for bonding; (iii) it has a higher negative charge on the sulphur atoms providing greater electron density on the central metal atom in comparison with the dithiocarbamate16 ligand and (iv) upon S,S coordination to a metal centre it forms the more strained four-membered chelate ring in comparison with the less strained five-membered ring obtained with 1,2-dithioligands such as maleonitrile dithiolate (mnt2−) and dmid2− complexes, which in turn can influence the intra- and inter-ligand as well as intermolecular S⋯S and M⋯S dimensions and interactions. Another important feature is that the two oxygen atoms of the ancillary aromatic sulfonyl group in the dithiocarbimate ligand, which normally do not participate in bonding, may act as a typical anchoring group facilitating the possibility for these hard (O) donor atoms to be adsorbed onto the Ti4+ of the TiO2 semiconductor electrode in accordance with Pearson's Hard–Soft Acid–Base (HSAB) principle. These features cause significant differences in the structure and properties of their complexes.
 | ||
| Fig. 1 Resonance forms of the ligand p-tolylsulfonyldithiocarbimate (I, II and III). | ||
It is worth mentioning that the precise arrangement and orientation of the functional groups in molecules play key roles in their activity and performance for energy and electron transfer in light driven reactions.
Motivated by the above facts and continuing our quest for exploring efficient dyes, we undertook the synthesis and characterization, and investigated the electrochemical and photophysical properties and light harvesting applications, of nine new heteroleptic complexes of Ni(II), Pd(II) and Pt(II) with p-tolylsulfonyldithiocarbimate and diamine/diimine ligands and the results of these investigations are reported here.
Results and discussion
The heteroleptic complexes of the general formula [M(L)(L′)] were obtained in good yields by treating an aqueous solution of the appropriate metal salt with a methanol–water solution containing the ligands L and L′ in equimolar ratios in a single-pot reaction. The synthetic routes for the complexes 1–9 are shown in Scheme 1. | ||
| Scheme 1 Synthesis of the complexes. L = p-CH3C6H4SO2NCS2, 1 (M = Ni, L′ = bpy, y = 2), 2 (M = Ni, L′ = phen, y = 2), 3 (M = Ni, L′ = tmed, y = 2), 4 (M = Pd, L′ = bpy, y = 4), 5 (M = Pd, L′ = phen, y = 2), 6 (M = Pd, L′ = tmed, y = 4), 7 (M = Pt, L′ = bpy, y = 4), 8 (M = Pt, L′ = phen, y = 2), 9 (M = Pt, L′ = tmed, y = 4). | ||
All the complexes gave satisfactory elemental analysis results and were air and moisture stable. They were characterized by IR, 1H and 13C NMR and UV-visible spectroscopy and their electrochemical properties studied. Complexes 1, 4 and 6 have been characterized by single crystal X-ray analyses.
Spectroscopy
Apart from the characteristic IR absorptions for the coordinated bpy, phen and tmed ligands, all the complexes display bands at 1415–1472, 1278–1310, 1135–1148 and 902–947 cm−1 arising from the ν(CN), νasym(SO2), νsym(SO2) and νasym(CS2) vibrations, respectively.17 The ν(CN) absorption occurs consistently at higher wave numbers in the complexes compared with the free ligand potassium p-tolyldithiocarbimate (1258 cm−1) indicating that the resonance form (I) makes a greater contribution to the overall structure of the complexes.
The NMR spectra of the complexes are typical for diamagnetic species. Their 1H and 13C resonances confirm the presence of diamine/diimine and p-tolyl sulfonyldithiocarbimate ligands in a 1![[thin space (1/6-em)]](https://www.rsc.org/images/entities/char_2009.gif) :1 ratio. Perceptible upfield shifts of δ = 20–23 ppm in the 13C spectra for the CS2 carbon in the complexes are observed by comparison with the corresponding resonance in the free dithiocarbimate ligand (δ = 225 ppm) indicates a significant contribution from resonance form I (Fig. 1).
:1 ratio. Perceptible upfield shifts of δ = 20–23 ppm in the 13C spectra for the CS2 carbon in the complexes are observed by comparison with the corresponding resonance in the free dithiocarbimate ligand (δ = 225 ppm) indicates a significant contribution from resonance form I (Fig. 1).
Crystal structures
X-ray quality single crystals of the complexes (1) [Ni(bpy)(L)]2·CH2Cl2, (4) Pd(bpy)(L) and (6) Pd(tmed)(L) were grown from solution by slow evaporation of CH2Cl2–CH3OH solvent. Crystallographic details are listed in Table 1 and selected bond distances and bond angles are given in Table S1 (ESI†). The asymmetric unit in complex 1 consists of two discrete molecules of Ni(bpy)(L) together with one molecule of solvent dichloromethane (Fig. 2). The crystal packing is shown in Fig. S1 in the ESI.†| 1·CH2Cl2 | 4 | 6 | |
|---|---|---|---|
| a R 1 = ∑(‖Fo∣ − ∣F‖/∑∣F∣). b wR2 = [(w(∑(∣Fo∣2 − ∣Fc∣2)2)/∑(w∣Fo∣4))]1/2. c GOF = [(w(∑(∣Fo∣ − ∣Fc∣2)2))]/(n − p)1/2, where n is the number of reflections, and p is the number of the refined parameters. | |||
| Empirical formula | C18.5H16ClN3NiO2S3 | C18H15N3O2PdS3 | C14H23N3O2PdS3 |
| Formula weight | 502.68 | 507.91 | 467.93 |
| Temperature | 150(2) | 293(2) | 293(2) |
| Crystal system | Monoclinic | Monoclinic | Monoclinic |
| Space group | P21/a | P21/n | P21/c |
| a (Å) | 32.8046(23) | 8.1376(5) | 12.4574(13) |
| b (Å) | 7.5551(7) | 31.501(2) | 15.6410(15) |
| c (Å) | 16.8736(14) | 15.4994(12) | 9.7801(10) |
| β (°) | 104.401(3) | 99.386(6) | 94.840(10) |
| V (Å3), Z | 4050.6(5), 8 | 3920.0(5), 8 | 1898.8(3), 4 |
| D calc (mg m−3) | 1.649 | 1.721 | 1.637 |
| Reflections collected | 27652 |
17419 |
13839 |
| Independent reflections | 11762 |
6463 | 3321 |
| Reflections with I > 2σ(I) | 5566 | 2495 | 2283 |
| F (000) | 2056 | 2032 | 952 |
| μ (mm−1) | 1.420 | 1.285 | 1.318 |
| Final indices [I > 2σI], R1a, wR2b |
0.0658, 0.1271 | 0.0901, 0.1508 | 0.1000, 0.2635 |
|
R indices (all data), R1a, wR2b |
0.1484, 0.1484 | 0.2011, 0.1688 | 0.1595, 0.3099 |
| GOFc | 0.849 | 0.919 | 1.064 |
| Largest difference peak and hole/e Å3 | 0.835, −0.662 | 1.266, −1.789 | 1.357, −1.696 |
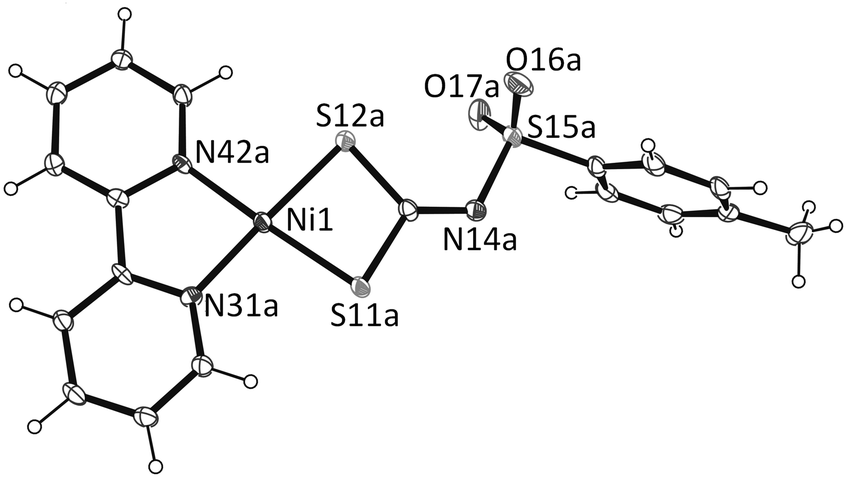 | ||
| Fig. 2 One molecule in the structure of complex 1, showing the numbering scheme and displacement ellipsoids at the 30% probability level. There are two molecules in the asymmetric unit with identical geometries together with one solvent molecule of dichloromethane. | ||
The nickel atom in each molecule A and B is at the centre of the slightly distorted square plane defined by N,N and S,S chelated bpy and dithiocarbimate ligands, respectively. The bpy chelate results in a N–Ni–N bond angle of 84.2(2)° in both molecules, a value which is not far from the ideal 90° for square planar geometry. The bite angles for S(11)–Ni(1)–S(12) of 78.88(5)° in A and 78.57(5)° in B are, however, significantly smaller than the ideal 90°. The average Ni–N distance 1.91 Å and is within the range of those for other nickel diimine complexes.18 The Ni(1)–S(11) and Ni(1)–S(12) distances of 2.176(1) and 2.168(1) Å in A, and 2.158(2) and 2.176(1) Å in B, respectively, are significantly smaller than those found in the anionic [nickel(dithiocarbimate)2]2− (ref. 19) and cationic [Ni(S2CNEt2)(dppe)]2+ (ref. 20) as well as the neutral nickel dithiocarbamate [Ni(S2CNEt2)2] (ref. 21) but close to those found in nickel 1,2-dithiolates.
The coplanarity of Ni(1), S(11), S(12), N(31) and N(42) show very small deviations of 0.099, 0.003, 0.293, 0.007, 0.033 Å in A and 0.011, 0.115, 0.053, 0.042 and 0.025 Å in B from the least square plane of the chelate ring. The two equatorial planes are almost parallel, intersecting at 5.0(1)°. In complex 1 the intra-ligand separations S(11)⋯S(12) of 2.760 and 2.744 Å in A and B, respectively, are appreciably shorter than 3.60 Å, which is the sum of the van der Waals radii of two sulfur atoms, suggesting significant nonbonding S⋯S interactions, while the inter-ligand S⋯S distances are far greater than this value, thus indicating the lack of significant intermolecular S⋯S interactions.
The molecules interact with each other through several weak interactions such as hydrogen bonding, C/H⋯π, S⋯H, O⋯S and C⋯C producing a supramolecular network. The solvent molecules participate in the hydrogen bonding to form a three dimensional network through O⋯H–C. For example, weak hydrogen bonds are found between the hydrogen atoms of the ligand bpy and the oxygen of the sulfonyl group of the ligand L. The two units are arranged into open supramolecular 2D layers via significant π–π interactions (Fig. 3) between the two bpy ligands with mean interplanar bpy to bpy distances of 3.61 and 3.67 Å.
 | ||
| Fig. 3 The close π–π interactions between molecules A and B in 1 (hydrogen atoms and solvent molecules have been omitted for clarity). | ||
The two units are further interlinked by interlayer Ni–π interactions (Fig. 4) between the nickel atoms and the aromatic π system of the bpy ligand [For 1, Ni1⋯CgB = 3.505 Å; Ni2⋯CgA = 3.536 Å].22 The Ni(II)–π interactions are probably weak; however, they are very important in stabilizing the polymeric structure of the complexes. The solvent molecule forms a channel across the crystal lattice (Fig. S2 in the ESI†).
 | ||
| Fig. 4 Ni⋯π interactions between molecules A and B in 1 (hydrogen atoms and solvent molecule have been omitted for clarity). | ||
The structure of Pd(bpy)(L) (4) also contains discrete molecules, named A and B with similar geometries in the asymmetric unit. The structure of molecule A is shown in Fig. 5. The structure displays a slightly distorted square planar environment around the palladium centre with average Pd–N and Pd–S distances of 2.06(1) and 2.269(5) Å, and N(31)–Pd–N(42) and S(11)–Pd–S(12) angles of 79.9(4)° and 75.34(1)°, respectively. It is interesting to note that there is marked asymmetry in the M–N bond lengths with M–N(31) shorter than M–N(42) although the M–S bond lengths are similar. The mean Pd–N distance is well within the range of the related palladium bipyridyl complex but the Pd–S distances are significantly smaller than reported in the anionic23,24 and neutral25,26 palladium dithiocarbamate complexes.
 | ||
| Fig. 5 One molecule in complex 4, showing the numbering scheme and displacement ellipsoids at the 40% probability level. There are two molecules in the asymmetric unit with equivalent geometries. | ||
Least square plane calculations show that the atoms S(11), S(12), N(31) and N(42) are −0.063, 0.062, 0.067 and −0.064 Å from the equatorial planes in A and 0.007, −0.007, −0.007 and 0.007 Å in B. The metal atoms are 0.008(4) and −0.040(4) Å from the planes. The two equatorial planes in A and B are nearly parallel, intersecting at an angle of 3.8(1)°. These small deviations are concomitant with weak intermolecular Pd(1)⋯Pd(2) (distance of 3.435(1) Å) and Pd⋯S interactions between molecules A and B at 3.867(4), 4.364(3), 4.435(4) and 4.494(4) Å, respectively. The close distance between the metals indicates that the molecules A and B form a weak dimer as shown in Fig. 6.
 | ||
| Fig. 6 Pd⋯Pd interaction between molecules A and B in 4 (hydrogen atoms have been omitted for clarity). | ||
These dimensions are in good agreement with those reported for the 1,2-dithio complex Pd(dbbpy)(dmid) [dbbpy = 4,4′-di-tert-butyl-2,2′-bipyridine; dmid = 2-oxo-1,3-dithiole-4,5-dithiolate].13d In 4 the intra-ligand S⋯S distance of 2.772(4) Å is also well within the range for noncovalent interactions. The inter-ligand S⋯S separations in 4 are significantly smaller than those in 1 eliciting weak inter-ligand S⋯S contacts. A packing diagram is given in Fig. S3 in the ESI.†
The structure of complex Pd(tmed)(L) (6) contains one molecule in the asymmetric unit, shown in Fig. 7. The crystal packing is given in Fig. S4 in the ESI.† The structure of 6 also shows the metal to be in a square planar environment with S(11), S(12), N(34) and N(31) at 0.038, −0.038, 0.037 and −0.037 Å from the plane, respectively. The metal is −0.034(4) Å from the plane. Pd–S distances of 2.270(3) and 2.282(3) Å, and Pd–N distances of 2.089(11) and 2.107(11) Å are within the expected ranges.
 | ||
| Fig. 7 Structure of complex 6, showing the numbering scheme and displacement ellipsoids at the 30% probability level. | ||
An examination of the structural data of nickel and palladium complexes 1, 4 and 6 reveals the concomitant increase in M–N and M–S bond lengths and decrease in chelate angles with an increase in the metal ion size (Ni < Pd). For 1, 4 and 6 the C–S and CN bond lengths in the ranges of 1.72–1.74 Å and 1.29–1.30 Å, respectively, show that the carbon–sulfur bonds are considerably shorter than a single bond (ca. 1.815 Å) due to partial π-delocalization over the CS2 unit. The carbon–nitrogen bond lengths are close to those found for CN double bonds in these complexes. These dimensions can be accounted for by assuming that resonance form I (Fig. 1) is the major contributor to the overall structures of the complexes.
Data were also measured for complex Ni(tmed)(L) (3) but a crystal structure analysis showed significant disorder. The crystals were orthorhombic, with probable space group P21212 with a = 7.7992(5), b = 9.0759(11), c = 27.157(3) Å, V = 1922.32 Å3 and Z = 4. No detailed discussion on the geometric data can be made on the basis of the data collected for this compound, albeit its molecular structure can be confirmed as being similar to that of 6.
Electronic absorption spectra
The electronic absorption spectra of the complexes 1–9 in dichloromethane solution are presented in Fig. 8–10. Nickel complexes 1, 2 and 3 in solution show a medium band at around 400 nm (ε = 9.15 × 10³–2.28 × 10⁴ M−1 cm−1) and a weak band at about 600 nm (ε = 1.40 × 10²–4.02 × 10² M−1 cm−1) assignable to intra-ligand charge transfer (ILCT)27 and d–d transitions, respectively, from the square planar geometry about the Ni(II) centre.15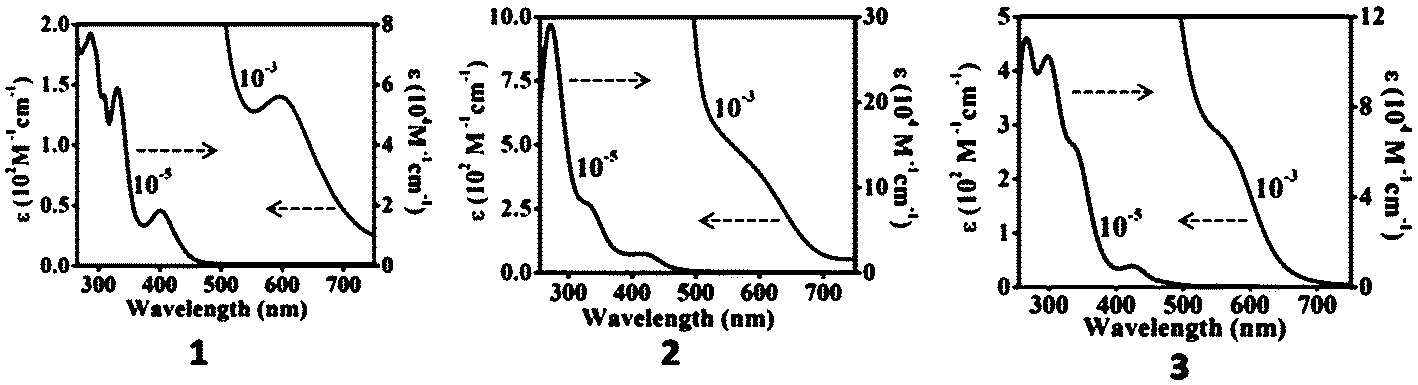 | ||
| Fig. 8 Absorption spectra of nickel complexes 1, 2 and 3 in dichloromethane solution. | ||
 | ||
| Fig. 9 Absorption spectra of palladium complexes 4, 5 and 6 in dichloromethane solution. | ||
 | ||
| Fig. 10 Absorption spectra of platinum complexes 7, 8 and 9 in dichloromethane solution. | ||
The corresponding d–d transitions in the Pd and Pt complexes are expected to occur at relatively higher energies27 due to the presence of significant spin–orbit coupling in these species. In the palladium (4, 5, 6) and platinum (7, 8, 9) complexes, a low energy absorption band near 350–420 nm for the Pd(II) complexes (ε = 3.64 × 10³–1.65 × 10⁴ M−1 cm−1) and the Pt(II) complexes (ε = 3.65 × 10³–3.90 × 10³ M−1 cm−1) is assigned to the intra-ligand π–π* transition with significant admixture of Mdπ–π*(MLCT) transitions. In all the complexes, the higher energy absorptions <330 nm (ε = 4.05 × 10⁴–2.92 × 10⁵ M−1 cm−1) are comparable to those reported for analogous group 10 metal complexes and are assigned to ILCT–LLCT transitions.12,14,15
Cyclic voltammetry
The redox behavior of the complexes was studied through cyclic voltammetry using a platinum-disk working electrode, a platinum-wire counter electrode and an Ag/Ag+ (acetonitrile) reference electrode in a one-compartment cell. The voltammograms (Fig. 11 for the nickel complexes and in Fig. S5 and S6 for the palladium and platinum complexes, respectively, in the ESI†) were recorded by using anhydrous solutions of the metal complexes in dichloromethane containing Bu4NClO4 (0.1 M) as supporting electrolyte. The potential scan rates used were 50–100 mV s−1. Prior to each experiment, the solution was purged with purified nitrogen gas to exclude dissolved oxygen. The electrochemical parameters derived from the cyclic voltammograms of the nickel complexes (anodic and cathodic peak potentials, Ep,a & Ep,c, peak potential difference, ΔEp, and the formal redox potential in the ground state, E0′) are given in Table 2. | ||
| Fig. 11 Cyclic voltammograms of nickel complexes 1, 2 and 3 (from top to bottom) at different sweep rates. | ||
| Complex | E p,a (V) | E p,c (V) | ΔEp (V) | E 0′ (V) | J p,a/Jp,c |
|---|---|---|---|---|---|
| 1 | +0.540 | +0.326 | +0.214 | +0.433 | 0.84 |
| 2 | +0.500 | +0.276 | +0.224 | +0.388 | 1.56 |
| 3 | +0.632 | +0.408 | +0.224 | +0.520 | 2.25 |
As is evident from Fig. 11, the peak potential remains unchanged with the change in sweep rate, indicating the redox processes to be of a reversible nature. However, the large peak potential separation (ΔEp = 0.214–0.224 V rather than 0.060 V expected for a one electron transfer process) and the large deviation of the peak current ratios (Jp,a/Jp,c = 0.84–2.25) from unity reflects the nature of the redox process to be either quasi-reversible or include the involvement of the EC sequence, i.e., a reversible electrochemical process followed by a ligand centred chemical process.
All the three nickel complexes exhibited similar voltammograms with formal redox potentials E0′ = 0.433, 0.388 and 0.520 V vs. Ag/Ag+ (ACN) for 1, 2 and 3, respectively. This observation reveals that the replacement of heterocyclic diimine ligands (bpy, phen), which have their own unoccupied π* orbitals, by aliphatic tetramethylethylenediamine leads to a higher anodic shift. In the cases of the palladium and platinum complexes 4–9, irreversible oxidation and reduction peaks at potentials given in Table 3 were observed.
| Complex | E p,a (V) | E p,c (1) (V) | E p,c (2) (V) |
|---|---|---|---|
| 4 | +0.642 | −0.452 | — |
| 5 | +0.822 | −0.700 | −1.33 |
| 6 | — | −0.300 | — |
| 7 | +1.12 | −1.15 | — |
| 8 | +0.640 | −0.226 | −0.840 |
| 9 | — | −0.212 | −0.954 |
Photosensitization
 | ||
| Fig. 12 Energy level diagram for complexes 1, 2 and 3. | ||
 | ||
| Fig. 13 Photocurrent–potential curves for TiO2-based cells sensitized by complexes 1, 2 and 3 under visible light illumination. | ||
| Complex | J sc (mA cm−2) | V oc (V) | FF | η (%) | IPCE (%) |
|---|---|---|---|---|---|
| N719 | 12.72 | −0.790 | 0.66 | 1.74 | 60 |
| 1 | 7.27 | −0.640 | 0.71 | 0.88 | 42 |
| 2 | 6.74 | −0.645 | 0.71 | 0.82 | 40 |
| 3 | 6.26 | −0.66 | 0.67 | 0.73 | 39 |
Under visible light illumination, short-circuit photocurrents around 7.27, 6.74 and 6.26 mA cm−2 were obtained with the use of complexes 1, 2 and 3, respectively. These values are ∼50–60% of that obtained with a TiO2 electrode sensitized by N719 under identical experimental conditions (Table 4). The cell outputs achieved with the use of these synthetic nickel complexes as photosensitizers in DSSC configuration can be considered as significant and comparatively better than those reported in the recent past for some of the systems.30 The photocurrent obtained on illumination of the dye-coated semiconductor electrodes by visible light (λ > 420 nm) can be assigned exclusively to charge carrier injection by photo excited dye molecules, since visible light of sub-band gap energy cannot excite the semiconductor electrode (TiO2). Among the three nickel complexes, complex 1 showed the best performance (Table 4). Unlike the anchoring of carboxylic acid substituted bipyridine ligands on the TiO2 surface31 the present study suggests efficient remote interfacial electron transfer from these sensitizers into the TiO2 semiconductor film.4
 | (1) |
 | (2) |
 | ||
| Fig. 14 Photocurrent action spectra obtained with the use of complexes 1, 2, and 3 as photosensitizers. | ||
It is worth mentioning that despite better photophysical properties of the palladium and platinum complexes (4–9), their conversion efficiencies were negligible in comparison to the good efficiencies of the Ni sensitizers found in the order 1 > 2 > 3. The lowest efficiency of 3 may be ascribed to the presence of saturated tmed ligands in this complex. The better performance of the nickel complexes compared to the palladium and platinum complexes may be attributed to nearly reversible redox behavior and prominent electronic absorption features, higher planarity (evidenced by the crystal structures) and probably increased adsorption of the nickel dyes (1–3) as compared to the irreversible redox behavior of the corresponding Pd and Pt complexes. Similar results were also obtained in the cases of previously reported analogous group 10 metal ferrocenyl-based dithiocarbamate sensitizers.7a It is to be noted that the conversion efficiencies of the sensitizers (1–3) are higher than those of Ni(II), Pd(II) and Pt(II) sensitizers7a,12g–i,m,14 under almost identical experimental conditions.
 | (3) |
 | ||
| Fig. 15 Dependence of photocurrent on the intensity of light. | ||
Conclusions
During this work nine new heteroleptic complexes of nickel(II), palladium(II) and platinum(II) have been prepared and fully characterized. Due to their appropriate and required UV-visible absorption characteristics and quasi-reversible electrochemical properties, all the nickel complexes show higher conversion efficiencies compared with the almost negligible conversion efficiencies of the analogous palladium and platinum complexes showing irreversible redox behaviour. These results bode well for the rational design and synthesis of planar complexes with a suitable combination of metal ions and ligands for photoluminescence and as DSSC materials. The sulfonyl oxygen atoms of the ligand aromatic sulfonyldithiocarbimate enhance the adsorption of these complexes onto the TiO2 semiconductor electrode thus paving a new pathway for the development of cost effective solar cell dyes that do not possess additional anchoring groups on the diimine ligands reported earlier.Experimental section
Materials and general methods
All experimental manipulations were performed under aerobic conditions at ambient temperature. All the chemicals were reagent grade products obtained from commercial sources (Sigma-Aldrich, Merck) and used as received. The solvents were purified prior to use by standard methods whenever required. The dipotassium salt of the ligand (L), p-tolylsulfonyldithiocarbimate; K2(p-CH3C6H4SO2NCS2)·2H2O, was prepared in DMF by the reaction of p-tolylsulfonamide, KOH and carbon disulfide as described in the literature32 and was characterized by IR, 1H and 13C NMR spectra. The experimental details dealing with the elemental analysis and recording of IR, NMR, and UV-visible absorption spectra were the same as described earlier.7
Cyclic voltammograms of the complexes were determined using 10−4 M solutions of the complex in dichloromethane with 0.1 M tetrabutyl ammonium perchlorate as supporting electrolyte. Voltammograms were obtained with a bipotentiostat (Model No. AFRDE 4E, Pine Instrument Company, USA) in conjunction with an e-Corder (model 201, eDAQ, Australia). For this purpose, Ag/Ag+ (in acetonitrile) was used as the reference electrode, a platinum disc as the working electrode and a platinum wire as the counter electrode.
For constructing the DSSCs, the cell electrolyte containing the LiI (0.1 M) and I2 (0.01 M) redox couple was prepared in propylene carbonate (PC). Titanium paste (titanium-HT) used for preparing the TiO2 electrode; platinum catalyst (T/SP) for the counter electrode and the sealing agent (SX1170-60, 50 μm) all were obtained from Solaronix.
For photo electrochemical cell (PEC) measurements, a 150 W xenon arc lamp (Oriel Corporation, USA) was used as the light source and the semiconductor electrode was illuminated with a light beam after passing it through a 6 inch long water column (to filter IR) and condensing it with the help of fused silica lenses (Oriel Corporation, USA). This IR-filtered light is referred to as ‘white light’. For selective excitation of the dye only (not TiO2), the UV part of the white light (λ < 420 nm) was cut off with the aid of a long-pass filter (Model No. 51280, Oriel Corporation, USA) and this UV-filtered light is referred to as ‘visible light’. The light was monochromatized, when required, by using a grating monochromator (Oriel model 77250 equipped with model 7798 grating). The width of the exit slit of the monochromator was kept at 0.5 mm. To obtain the action spectrum (Jphoto–λ) of the dye-sensitized TiO2 electrode, the monochromatic light-induced photocurrent was measured with a digital multimeter (Philips model No. 2525) in combination with the potentiostat. The intensity of light was varied with neutral density filters and measured with a digital photometer (Tektronix model J16 with model J6502 sensor). The absorption spectra of the dyes in dichloromethane solution were recorded on a Cary 2390 (Varian) spectrophotometer.
Preparation of TiO2 electrode (photoanode) and counter electrode
A TiO2 thin film electrode (photoanode) was prepared by spreading highly transparent paste of TiO2 (titanium-HT) on a conductive glass plate (15 Ω per square, Pilkington, USA) by the doctor's blade method and annealing at 450 °C for half an hour in air. The dye was attached to the TiO2 surface by immersing the TiO2 coated electrodes in the solution of dye in dichloromethane for 6 h. The non-adsorbed dye was washed with anhydrous ethanol. The platinum counter electrode was prepared by deposition of Pt catalyst (T/SP paste, Solaronix SA) on another conductive glass plate and annealing at 400 °C for half an hour in air.DSSC assembly
For constructing the sandwich type DSSC, the counter electrode was placed over the dye-coated TiO2 electrode on which a heat-setting sealant/spacer (SX1170-60, 50 μm thick, Solaronix) was applied on three sides leaving one side open for the injection of the cell electrolyte. By controlled heating at 100 °C the assembly was sealed on three sides. The cell electrolyte solution was then injected through the opening. The electrolyte was drawn into the space between the electrodes by capillary action. Subsequently the opened side of the cell assembly was sealed with araldite and the contacts to both the electrodes were made with copper wire using silver paste, which was finally covered with araldite.X-ray crystallography
Reflection data for 1 were collected with MoKα radiation at 150 K using the Oxford Diffraction X-Calibur CCD System. The crystals were positioned at 50 mm from the CCD. 321 frames were measured with a counting time of 10 s. Reflection data for 4 and 6 were collected with MoKα radiation at room temperature 293(2) K using the same instrument as above. Data analysis was carried out with the CrysAlis program.33 The structures were solved using direct methods with the SHELXS97 program.34 The non-hydrogen atoms were refined with anisotropic thermal parameters. The hydrogen atoms bonded to carbon were included in geometric positions and given thermal parameters equivalent to 1.2 times those of the atoms to which they were attached. Absorption corrections were carried out using the ABSPACK program.35Synthesis
:1, v/v) solution containing the ligand K2L·2H2O (0.180 g, 0.5 mmol) and bpy (0.078 g, 0.5 mmol) or phen (0.099 g, 0.5 mmol) or tmed (0.058 g, 0.5 mmol) was added gradually a 15 ml aqueous solution of NiCl2·6H2O (0.119 g, 0.5 mmol) or K2PdCl4 (0.163 g, 0.5 mmol) or K2PtCl4 (0.208 g, 0.5 mmol). The reaction mixture was stirred for 6 h in the case of nickel and 24 h in the case of the palladium and platinum complexes at room temperature. The precipitate was filtered off, washed with the above solvent mixture, then methanol, followed by diethyl ether and dried in vacuo over CaCl2.
N), 1278 νasym(SO2), 1142 νsym(SO2), 943 νasym(CS2). 1H NMR (300.40 MHz, DMSO-d6, ppm): δ 7.73 (d, J = 7.51 Hz, 2H, H2 and H6), 7.37 (d, J = 7.81 Hz, 2H, H3 and H5), 2.38 (s, 3H, CH3); 8.57, 8.31, 7.95, 7.59 (bpy). 13C{1H} NMR (75.45 MHz, DMSO-d6, ppm): δ 204.15 (NCS2), 141.68 (C4), 137.45 (C1), 129.11 (C3 and C5), 126.71 (C2 and C6), 20.73 (CH3); 149.99, 132.59, 130.06, 127.91, 125.42 (bpy). UV-vis [CH2Cl2, λmax (nm), ε (M−1 cm−1)]: 600 (1.40 × 10²), 400 (1.84 × 10⁴), 330 (5.93 × 10⁴), 305 (5.75 × 10⁴), 286 (7.75 × 10⁴).
2. Greenish yellow solid (0.203 g, 84%). M.p. 185–187 °C. Elemental analysis calcd (%) for C20H15N3O2S3Ni: C 49.61, H 3.12, N 8.68, S 19.86; found C 49.38, H 3.32, N 8.45, S 19.35. IR (KBr, cm−1): 1427 ν(CN), 1285 νasym(SO2), 1145 νsym(SO2), 929 νasym(CS2). 1H NMR (300.40 MHz, DMSO-d6, ppm): δ 7.76 (d, J = 7.47 Hz, 2H, H2 and H6), 7.38 (d, J = 7.47 Hz, 2H, H3 and H5), 2.30 (s, 3H, CH3); 8.91, 8.11, 7.58, 7.22 (phen). 13C{1H} NMR (75.45 MHz, DMSO-d6, ppm): δ 205.77 (NCS2), 144.35 (C4), 131.30 (C1), 128.57 (C3 and C5), 127.02 (C2 and C6), 20.92 (CH3); 161.28, 159.64, 156.80, 154.18, 153.16, 147.55 (phen). UV-vis [CH2Cl2, λmax (nm), ε (M−1 cm−1)]: 600 (4.02 × 10²), 420 (2.28 × 10⁴), 340 (7.72 × 10⁴), 270 (2.92 × 10⁵).
3. Orange solid (0.185 g, 88%). M.p. 188–190 °C (decomposed). Elemental analysis calcd (%) for C14H23N3S3O2Ni: C 40.02, H 5.52, N 10.00, S 22.89; found C 39.62, H 5.42, N 9.65, S 22.46. IR (KBr, cm−1): 1423 ν(CN), 1264 νasym(SO2), 1134 νsym(SO2), 947 νasym(CS2). 1H NMR (300.40 MHz, DMSO-d6, ppm): δ 7.62 (d, J = 7.81 Hz, 2H, H2 and H6), 7.31 (d, J = 8.11 Hz, 2H, H3 and H5), 2.36 (s, 3H, CH3), 3.15 (d, CH2, tmed), 2.40 (s, CH3, tmed). 13C{1H} NMR (75.45 MHz, DMSO-d6, ppm): δ 202.48 (NCS2), 143.07 (C4), 139.44 (C1), 129.61 (C3 and C5), 127.17 (C2 and C6), 21.43 (CH3); 59.27, 48.81 (tmed). UV-vis [CH2Cl2, λmax (nm), ε (M−1 cm−1)]: 580 (2.40 × 10²), 425 (9.15 × 10³), 340 (6.04 × 10⁴), 300 (1.02 × 10⁵), 265 (1.10 × 10⁵).
4. Pale yellow solid (0.203 g, 80%). M.p. 180–182 °C. Elemental analysis calcd (%) for C18H15N3O2S3Pd: C 42.56, H 2.98, N 8.27, S 18.94; found C 42.25, H 3.26, N 8.15, S 18.55. IR (KBr, cm−1): 1442 ν(CN), 1309 νasym(SO2), 1148 νsym(SO2), 913 νasym(CS2). 1H NMR (300.40 MHz, DMSO-d6, ppm): δ 7.76 (d, J = 7.51 Hz, 2H, H2, H6), 7.37 (d, J = 7.81 Hz, 2H, H3 and H5); 2.38 (s, 3H, CH3) 8.69–8.31 (bpy). 13C{1H} NMR (75.45 MHz, DMSO-d6, ppm): δ 202.44 (NCS2), 142.63 (C4), 139.13 (C1), 129.27 (C3 and C5), 126.74 (C2 and C6), 21.54 (CH3); 154.59, 149.68, 140.91, 127.99, 124.02 (bpy). UV-vis [CH2Cl2, λmax (nm), ε (M−1 cm−1)]: 400 (1.65 × 10⁴), 355 (3.44 × 10³), 330 (5.04 × 10⁴), 275 (7.21 × 10⁴).
5. Pale yellow solid (0.215, 81%). M.p. 184–186 °C. Elemental analysis calcd (%) for C20H15N3O2S3Pd: C 45.16, H 2.84, N 7.90, S 18.08; found C 44.76, H 2.96, N 7.65, S 17.65. IR (KBr, cm−1): 1443 ν(CN), 1308 νasym(SO2), 1149 νsym(SO2), 912 νasym(CS2). 1H NMR (300.40 MHz, DMSO-d6, ppm): δ 7.80 (d, J = 8.11 Hz, 2H, H2 and H6), 7.39 (d, J = 7.81 Hz, 2H, H3 and H5), 2.38 (s, 3H, CH3); 8.95, 8.72, 8.28, 8.60 (phen). 13C{1H} NMR (75.45 MHz, DMSO-d6, ppm): δ 202.66 (NCS2), 141.42 (C4), 139.15 (C1), 129.36 (C3 and C5), 125.66 (C2 and C6), 20.96 (CH3); 156.59, 156.04, 152.94, 146.87, 143.10, 126.84 (phen). UV-vis [CH2Cl2, λmax (nm), ε (M−1 cm−1)]: 350 (3.64 × 10³), 315 (3.60 × 10³), 285 (7.50 × 10⁴), 245 (2.52 × 10⁵).
5. Pale yellow solid (0.215, 81%). M.p. 184–186 °C. Elemental analysis calcd (%) for C20H15N3O2S3Pd: C 45.16, H 2.84, N 7.90, S 18.08; found C 44.76, H 2.96, N 7.65, S 17.65. IR (KBr, cm−1): 1443 ν(CN), 1308 νasym(SO2), 1149 νsym(SO2), 912 νasym(CS2). 1H NMR (300.40 MHz, DMSO-d6, ppm): δ 7.80 (d, J = 8.11 Hz, 2H, H2 and H6), 7.39 (d, J = 7.81 Hz, 2H, H3 and H5), 2.38 (s, 3H, CH3); 8.95, 8.72, 8.28, 8.60 (phen). 13C{1H} NMR (75.45 MHz, DMSO-d6, ppm): δ 202.66 (NCS2), 141.42 (C4), 139.15 (C1), 129.36 (C3 and C5), 125.66 (C2 and C6), 20.96 (CH3); 156.59, 156.04, 152.94, 146.87, 143.10, 126.84 (phen). UV-vis [CH2Cl2, λmax (nm), ε (M−1 cm−1)]: 350 (3.64 × 10³), 315 (3.60 × 10³), 285 (7.50 × 10⁴), 245 (2.52 × 10⁵).
6. Pale yellow solid (0.197 g, 84%). M.p. 184–186 °C. Elemental analysis calcd (%) for C14H23N3O2S3Pd: C 35.93, H 4.95, N 8.98, S 20.55; found C 35.82, H 4.78, N 8.72, S 20.02. IR (KBr, cm−1): 1431 ν(CN), 1281 νasym(SO2), 1139 νsym(SO2), 921 νasym(CS2).1H NMR (300.40 MHz, DMSO-d6, ppm): δ 7.66 (d, J = 7.81 Hz, 2H, H2 and H6), 7.32 (d, J = 7.81 Hz, 2H, H3 and H5), 2.35 (s, 3H, CH3), 2.81 (s, CH2 tmed), 2.60 (s, CH3, tmed). 13C{1H} NMR (75.45 MHz, DMSO-d6, ppm): δ 205.14 (NCS2), 142.31 (C4), 139.45 (C1), 129.13 (C3 and C5), 126.71 (C2 and C6), 21.02 (CH3). 60.28, 50.06 (tmed). UV-vis [CH2Cl2, λmax (nm), ε (M−1 cm−1)]: 420 (2.21 × 10²), 285 (4.60 × 10⁴), 250 (9.44 × 10⁴).
7. Pale yellow solid (0.235, 79%). M.p. 177–180 °C (decomposed). Elemental analysis calcd (%) for C18H15N3O2S3Pt: C 36.24, H 2.53, N 7.04, S 16.12; found C 35.85, H 2.65, N 6.84, S 15.72. IR (KBr, cm−1): 1472 ν(CN), 1285 νasym(SO2), 1147 νsym(SO2), 902 νasym(CS2). 1H NMR (300.40 MHz, DMSO-d6, ppm): δ 7.77 (d, J = 7.81 Hz, 2H, H2 and H6), 7.38 (d, J = 7.81, 2H, H3 and H5), 2.38 (s, CH3); 8.70, 8.56, 8.44, 7.95 (bpy). 13C{1H} NMR (75.45 MHz, DMSO-d6, ppm): δ 204.06 (NCS2), 140.40 (C4), 137.82 (C1), 129.26 (C3 and C5), 126.91 (C2 and C6), 21.11 (CH3); 156.45, 150.56, 146.37, 129.44, 128.99 (bpy). UV-vis [CH2Cl2, λmax (nm), ε (M−1 cm−1)]: 405 (3.90 × 10³), 355 (3.54 × 10³), 310 (4.14 × 10⁴), 245 (2.02 × 10⁵).
8. Pale yellow solid (0.197 g, 84%). M.p. 190–192 °C. Elemental analysis calcd (%) for C20H15N3O2S3Pt: C 38.71, H 2.44, N 6.77, S 15.50; found C 38.46, H 2.58, N 6.58, S 15.18. IR (KBr, cm−1): 1466 ν(CN), 1217 νasym(SO2), 1146 νsym(SO2), 915 νasym(CS2). 1H NMR (300.40 MHz, DMSO-d6, ppm): δ 7.68 (d, J = 7.81 Hz, 2H, H2 and H6), 7.34 (d, J = 7.81 Hz, 2H, H3 and H5), 2.37 (s, 3H, CH3); 9.64, 9.02, 8.88, 7.98, (phen). 13C{1H} NMR (75.45 MHz, DMSO-d6, ppm): δ 203.97 (NCS2), 142.33 (C4), 139.20 (C1), 129.10 (C3 and C5), 126.80 (C2 and C6), 20.10 (CH3) 149.58, 144.93, 139.50, 129.33, 127.84, 127.16 (phen). UV-vis [CH2Cl2, λmax (nm), ε (M−1 cm−1)]: 350 (3.65 × 10³), 315 (4.05 × 10⁴), 245 (1.88 × 10⁵).
9. Pale yellow solid (0.236 g, 85%). M.p. 190–192 °C. Elemental analysis calcd (%) for C14H23N3O2S3Pt: C 30.21, H 4.16, N 7.55, S 17.28; found C 29.75, H 4.28, N 7.28, S 16.75. IR (KBr, cm−1): 1463 ν(CN), 1280 νasym(SO2), 1144 νsym(SO2), 916 νasym(CS2). 1H NMR (300.40 MHz, DMSO-d6, ppm): δ 7.67 (d, J = 8.11 Hz, 2H, H2 and H6), 7.32 (s, 2H, H3 and H5), 2.37 (s, 3H, CH3), 2.81 (t, CH2, tmed), 2.45 (s, CH3, tmed). 13C{1H} NMR (75.45 MHz, DMSO-d6, ppm): δ 202.89 (NCS2), 142.24 (C4), 139.50 (C1), 129.09 (C3 and C5), 126.66 (C2 and C6), 20.99 (CH3); 62.31, 51.48 (tmed); UV-vis [CH2Cl2, λmax (nm), ε (M−1 cm−1)]: 385 (3.65 × 10³), 355 (3.78 × 10³), 300 (3.76 × 10³).
Acknowledgements
We thank the Council of Scientific and Industrial Research (CSIR), New Delhi, for funding through Project No. 01(2290)/09/EMR(II). UGC-UPE I.I.T (B.H.U) for financial assistance and Banaras Hindu University (India), EPSRC (U.K.) and the University of Reading for funds for the CCD diffractometer. The financial assistance provided by DST, New Delhi, for photoelectrochemical work is duly acknowledged by RC and LB. Authors are also thankful to Ms Gunjan Rajput for her valuable input.Notes and references
- K. Hara, T. Horiguchi, T. Kinoshita, K. Sayama, H. Sugihara and H. Arakawa, Sol. Energy Mater. Sol. Cells, 2000, 64, 115 CrossRef CAS.
- (a) B. O'Regan and M. Grätzel, Nature, 1991, 353, 737 CrossRef; (b) M. Grätzel, Inorg. Chem., 2005, 44, 684 CrossRef PubMed; (c) J.-Y. Kim, K. J. Lee, S. H. Kang, J. Shin and Y.-E. Sung, J. Phys. Chem. C, 2011, 115, 19979 CrossRef CAS; (d) S. Ardo and G. J. Meyer, Chem. Soc. Rev., 2009, 38, 115 RSC; (e) M. K. Nazeeruddin, A. Kay, I. Rodicio, R. Humphry-Baker, E. Mueller, P. Liska, N. Vlachopoulos and M. Grätzel, J. Am. Chem. Soc., 1993, 115, 6382 CrossRef CAS; (f) T. Bessho, E. C. Constable, M. Grätzel, A. H. Redondo, C. E. Housecraft, W. Kylberg, M. K. Nazeeruddin, M. Neuberger and S. Schaffner, Chem. Commun., 2008, 3717 RSC; (g) R. Eisenberg and D. G. Nocera, Inorg. Chem., 2005, 44, 6799 CrossRef CAS PubMed; (h) N. Armaroli and V. Balzani, Angew. Chem., Int. Ed., 2007, 46, 52 CrossRef CAS PubMed; (i) N. Lewis and D. G. Nocera, Proc. Natl. Acad. Sci. U. S. A., 2006, 103, 15729 CrossRef CAS PubMed; (j) L. Bahadur and L. Roy, J. Photochem. Photobiol., A, 1995, 92, 207 CrossRef CAS.
- M. K. Nazeeruddin and M. Grätzel, Comprehensive Coordination Chemistry II, Elsevier, Oxford, 2004, ch. 16, vol. 9, p. 719 Search PubMed.
- A. Argazzi, C. A. Bignozzi, T. A. Heimer and G. J. Meyer, Inorg. Chem., 1997, 36, 2 CrossRef.
- (a) R. Po, M. Maggini and N. Camaioni, J. Phys. Chem., 2010, 114, 695 CAS; (b) J.-L. Brédas, J. Norton, J. Cornil and V. Coropceanu, Acc. Chem. Res., 2009, 42, 1691 CrossRef PubMed; (c) K. C. D. Robson, B. D. Koivisto, A. Yella, B. Sporinova, M. K. Nazeeruddin, T. Baumgartner, M. Grätzel and C. P. Berlinguette, Inorg. Chem., 2011, 50, 5494 CrossRef CAS PubMed; (d) M. Wang, S.-J. Moon, D. Zhou, F. Le Formal, N.-Lê. Cevey Ha, R. Humphry-Baker, C. Grätzel, P. Wang, S. M. Zakeeruddin and M. Grätzel, Adv. Funct. Mater., 2010, 20, 1821 CrossRef CAS.
- (a) N. Robertson, Angew. Chem., Int. Ed., 2008, 47, 1012 CrossRef CAS PubMed; (b) T. Cardolaccia, Y. Li and K. Schanze, J. Am. Chem. Soc., 2008, 130, 2535 CrossRef CAS PubMed; (c) M. Ishida, S. W. Park, D. Hwang, Y. B. Koo, J. L. Sessler, D. Y. Kim and D. Kim, J. Phys. Chem. C, 2011, 115, 19343 CrossRef CAS; (d) S. Mori, M. Nagata, Y. Nakahata, K. Yasuta, R. Goto, M. Kimura and M. Taya, J. Am. Chem. Soc., 2010, 132, 4054 CrossRef CAS PubMed; (e) M. K. Panda, G. D. Sharma, K. R. J. Thomas and A. G. Coutsolelos, J. Mater. Chem., 2012, 22, 8092 RSC.
- (a) A. Kumar, R. Chauhan, K. C. Molloy, L. Bahadur and N. Singh, Chem.–Eur. J., 2010, 16, 4307 CrossRef CAS PubMed; (b) V. Singh, R. Chauhan, A. Kumar, L. Bahadura and N. Singh, Dalton Trans., 2010, 39, 9779 RSC; (c) S. K. Singh, R. Chauhan, B. Singh, K. Diwan, G. K. Köhan, L. Bahadur and N. Singh, Dalton Trans., 2012, 41, 1373 RSC.
- W. Lu, B.-X. Mi, M. C. W. Chan, Z. Hui, C.-M. Che, N. Zhu and S.-T. Lee, J. Am. Chem. Soc., 2004, 126, 4958 CrossRef CAS PubMed.
- (a) N. Fletcher and M. C. Lagunas, Top. Organomet. Chem., 2010, 88, 143 CrossRef; (b) P.-H. Lanoë, J.-L. Fillaut, L. Toupet, J. A. G. Williams, H. Le Bozec and V. Guerchais, Chem. Commun., 2008, 4333 RSC.
- (a) T. J. Wadas, Q.-M. Wang, Y.-J. Kim, C. Flaschenreim, T. N. Blanton and R. Eisenberg, J. Am. Chem. Soc., 2004, 126, 16841 CrossRef CAS PubMed; (b) S. W. Botchway, M. Charnley, J. W. Haycock, A. W. Parker, D. L. Rochester, J. A. Weinstein and J. A. G. Williams, Proc. Natl. Acad. Sci. U. S. A., 2008, 105, 16071 CrossRef CAS PubMed.
- P. Du, J. Schneider, P. Jarosz and R. Eisenberg, J. Am. Chem. Soc., 2006, 128, 7726 CrossRef CAS PubMed.
- (a) J. A. G. Williams, Top. Curr. Chem., 2007, 281, 205 CrossRef CAS; (b) S. D. Cummings and R. Eisenberg, Inorg. Chem., 1995, 34, 2007 CrossRef CAS; (c) J. A. Zuleta, M. S. Burberry and R. Eisenberg, Coord. Chem. Rev., 1990, 97, 47 CrossRef CAS; (d) J. A. Zuleta, J. M. Bevilacqua, D. M. Proserpio, P. D. Harvey and R. Eisenberg, Inorg. Chem., 1992, 31, 2396 CrossRef CAS; (e) W. Paw, S. D. Cummings, M. A. Mansour, W. B. Connick, D. K. Geiger and R. Eisenberg, Coord. Chem. Rev., 1998, 171, 125 CrossRef CAS; (f) S. D. Cummings and R. Eisenberg, Prog. Inorg. Chem., 2003, 52, 315 CrossRef CAS; (g) E. A. M. Geary, L. J. Yellowlees, L. A. Jack, I. D. H. Oswald, S. Parsons, N. Hirata, J. R. Durrant and N. Robertson, Inorg. Chem., 2005, 44, 242 CrossRef CAS PubMed; (h) E. A. M. Geary, N. Hirata, J. Clifford, J. R. Durrant, S. Parsons, A. Dawson, L. J. Yellowlees and N. Robertson, Dalton Trans., 2003, 3757 RSC; (i) A. Islam, H. Sugihara, K. Hara, L. P. Singh, R. Katoh, M. Yanagida, Y. Takahashi, S. Murata, H. Arakawa and G. Fujihashi, Inorg. Chem., 2001, 40, 5371 CrossRef CAS PubMed; (j) R. Argazzi, C. A. Bignozzi, G. Hasselmann and G. J. Meyer, Inorg. Chem., 1998, 37, 4533 CrossRef CAS PubMed; (k) A. J. Lees, Chem. Rev., 1987, 87, 711 CrossRef CAS; (l) P. Du, J. Schneider, F. Li, W. Zhao, U. Patel, F. Castellano and R. Eisenberg, J. Am. Chem. Soc., 2008, 130, 5056 CrossRef CAS PubMed; (m) B. W. Smucker, J. M. Hudson, M. A. Omary and K. R. Dunbar, Inorg. Chem., 2003, 42, 4714 CrossRef CAS PubMed.
- (a) A. Islam, H. Sugihara, K. Hara, L. P. Singh, R. Katoh, M. Yanagida, Y. Takahashi, S. Murata, H. Arakawa and G. Fujihashi, Inorg. Chem., 2001, 40, 5371 CrossRef CAS PubMed; (b) B. W. Smucker, J. M. Hudson, M. A. Omary and K. R. Dunbar, Inorg. Chem., 2003, 42, 4714 CrossRef CAS PubMed; (c) J. Zhang, P. Du, J. Schneider, P. Jarosz and R. Eisenberg, J. Am. Chem. Soc., 2007, 129, 7726 CrossRef CAS PubMed; (d) R. Argazzi, C. A. Bignozzi, G. M. Hasselmann and G. J. Meyer, Inorg. Chem., 1998, 37, 4533 CrossRef CAS PubMed.
- C. L. Linfoot, P. Richardson, L. L. McCall, J. R. Durant, A. Morandeira and N. Robertson, Sol. Energy, 2011, 85, 1195 CrossRef CAS.
- (a) C. A. Craig and R. J. Watts, Inorg. Chem., 1989, 87, 309 CrossRef; (b) S. P. Kaiwar, J. K. Hsu, L. Liable-Sands, M. A. L. Rheingold and R. S. Pilato, Inorg. Chem., 1997, 36, 4234 CrossRef CAS; (c) B. W. Smucker, J. M. Hudson, M. A. Omary and K. R. Dunbar, Inorg. Chem., 2003, 42, 4714 CrossRef CAS PubMed; (d) S. P. Kaiwar, A. Vodacek, N. V. Blough and R. S. Pilato, J. Am. Chem. Soc., 1997, 119, 3311 CrossRef CAS; (e) M. Y. Darensbourg, T. Tuntulani and J. H. Reibenspics, Inorg. Chem., 1995, 34, 6287 CrossRef CAS; (f) T. R. Miller and I. G. Dance, J. Am. Chem. Soc., 1973, 95, 6970 CrossRef CAS; (g) A. Vogler, H. Hunkely, J. Hlavatsch and A. Merz, Inorg. Chem., 1984, 23, 506 CrossRef CAS; (h) A. Vogler and H. Hunkely, J. Am. Chem. Soc., 1981, 103, 1559 CrossRef CAS.
- (a) G. Hogarth, Prog. Inorg. Chem., 2005, 53, 71 CrossRef CAS; (b) J. Cookson and P. D. Beer, Dalton Trans., 2007, 1459 RSC.
- (a) L. M. G. Cunha, M. M. M. Rubinger, J. R. Sabino, L. L. Y. Visconte and M. R. L. Oliveira, Polyhedron, 2010, 29, 2278 CrossRef CAS; (b) L. C. Alves, M. M. M. Rubinger, R. H. Lindemann, G. J. Perpétuo, J. Janczak, L. D. L. Miranda, L. Zambolim and M. R. L. Oliveira, J. Inorg. Biochem., 2009, 103, 1045 CrossRef CAS PubMed.
- C. P. Berlinguette, J. R. Galán-Mascarós and K. R. Dunbar, Inorg. Chem., 2003, 42, 3416 CrossRef CAS PubMed.
- F. A. Cotton and C. B. Harris, Inorg. Chem., 1968, 7, 2140 CrossRef CAS.
- G. Exarchos, S. D. Robinson and J. W. Steed, Polyhedron, 2001, 20, 2951 CrossRef CAS.
- M. Bonamico, G. Dessy, C. Mariani, A. Vaciago and L. Zambonelli, Acta Crystallogr., 1965, 19, 619 CrossRef CAS.
- G. S. Kürkçüoğlu, O. Z. Yeşilel, İ. Kavlak and O. Büyükgünör, J. Mol. Struct., 2009, 920, 220 CrossRef.
- C. J. Burchell, S. M. Aucott, H. L. Milton, A. M. Z. Slawin and J. D. Woollins, Dalton Trans., 2004, 369 RSC.
- J. Ahmed, K. Itoh, I. Matsuda, F. Ueda, Y. Ishii and J. Ibers, Inorg. Chem., 1977, 16, 620 CrossRef CAS.
- M.-L. Riekkola, T. Pakkanen and L. Niinistö, Acta Chem. Scand., Ser. A, 1983, 37, 807 CrossRef.
- L. T. Chan, H.-W. Chen, J. P. Fackler Jr., A. F. Masters and W.-H. Pan, Inorg. Chem., 1982, 21, 4291 CrossRef CAS.
- (a) A. B. P. Lever, Inorganic Electronic Spectroscopy, Elsevier, Amsterdam, 1984, p. 479 Search PubMed; (b) R. J. H. Clark and P. C. Turtle, J. Chem. Soc., Dalton Trans., 1977, 2142 RSC; (c) S. I. Shupack, E. Billig, R. J. H. Clark, R. Williams and H. B. Gray, J. Am. Chem. Soc., 1964, 86, 4594 CrossRef CAS.
- C. Li, X. Yang, R. Chen, J. Pan, H. Tian, H. Zhu, X. Wang, A. Hagfeldt and L. Sun, Sol. Energy Mater. Sol. Cells, 2007, 91, 1863 CrossRef CAS.
- (a) J. Dutta, A. Bhattacharya and K. K. Kundu, Bull. Chem. Soc. Jpn., 1988, 61, 1735 CrossRef; (b) A. Nattestad, M. Ferguson, R. Kerr, Y.-B. Cheng and U. Bach, Nanotechnology, 2008, 19, 295304 CrossRef PubMed; (c) E. A. Gibson, L. Le-Pleux, J. Fortage, Y. Pellegrin, E. Blart, F. Odobel, A. Hagfeldt and G. Boschloo, Langmuir, 2012, 28, 6485 CrossRef CAS PubMed; (d) G. Boschloo and A. Hagfeldt, Acc. Chem. Res., 2009, 42, 1819 CrossRef CAS PubMed; (e) X. Wang and D. M. Stanbury, Inorg. Chem., 2006, 45, 3415 CrossRef CAS PubMed; (f) R. C. Larson, R. T. Iwamoto and R. N. Adams, Anal. Chim. Acta, 1961, 25, 371 CAS.
- K. Hara, T. Sato, R. Katoh, A. Furube, Y. Ohga, A. Shinpo, S. Suga, K. Sayama, H. Sugihara and H. Arakawa, J. Phys. Chem. B, 2003, 107, 5971 Search PubMed.
- (a) S. Anderson, E. C. Constable, M. P. Dare-Edwards, J. B. Goodenough, A. Hamnett, K. R. Seddon and R. D. Wright, Nature, 1979, 280, 571 CrossRef CAS; (b) J. B. Goodenough, M. P. Dare-Edwards, G. Campet, A. Hamnett and R. D. Wright, Surf. Sci., 1980, 101, 531 CrossRef CAS; (c) M. P. Dare-Edwards, J. B. Goodenough, A. Hamnett, K. R. Seddon and R. D. Wright, Faraday Discuss. Chem. Soc., 1980, 70, 285 RSC.
- (a) K. Hartke, Arch. Pharm., 1966, 299, 174 CrossRef CAS; (b) H. U. Hummel and U. Z. Korn, Z. Naturforsch., B: Chem. Sci., 1989, 44, 24 CAS.
- CrysAlis, Oxford Diffraction Ltd, Abingdon, UK, 2006 Search PubMed.
- G. M. Sheldrick, SHELXS97 and SHELXl97, Programs for Crystallographic solution and refinement, Acta Crystallogr., Sect. A: Fundam. Crystallogr., 2008, 64, 112 CrossRef CAS PubMed.
- ABSPACK, Oxford Diffraction Ltd, Oxford, UK, 2005 Search PubMed.
Footnote |
| † Electronic supplementary information (ESI) available. CCDC 791742 (1), 791743 (4) and 809581 (6) contain the supplementary crystallographic data for this paper; crystal packing diagrams (1, 4, 6) and cyclic voltammograms of complexes 4–9 are given as ESI. For ESI and crystallographic data in CIF or other electronic format see DOI: 10.1039/c3nj00507k |
| This journal is © The Royal Society of Chemistry and the Centre National de la Recherche Scientifique 2014 |