Metallomics for drug development: a further insight into intracellular activation chemistry of a ruthenium(III)-based anticancer drug gained using a multidimensional analytical approach†
Magdalena
Matczuk
a,
Monika
Prządka
a,
Svetlana S.
Aleksenko
b,
Zbigniew
Czarnocki
c,
Katarzyna
Pawlak
a,
Andrei R.
Timerbaev
*b and
Maciej
Jarosz
a
aChair of Analytical Chemistry, Warsaw University of Technology, Noakowskiego 3, 00-664 Warsaw, Poland
bVernadsky Institute of Geochemistry and Analytical Chemistry, Russian Academy of Sciences, Kosygin St. 19, 119991 Moscow, Russia. E-mail: andrei.timerbaev@univie.ac.at; Fax: +7-495-938-2054; Tel: +7-495-939-7035
cFaculty of Chemistry, Warsaw University, Pasteura 1, 02-093 Warsaw, Poland
First published on 30th October 2013
Abstract
The mechanism by which the most relevant ruthenium anticancer drugs are activated in tumors to commence their tumor-inhibiting action remains one of the challenging research tasks of present-day metallomics. This contribution aims to capture and identify eventually more reactive species of one of two bis-indazole tetrachloridoruthenate(III) compounds that are progressing in clinical trials. In view of the fact that the transport of ruthenium into cancer cells is governed by transferrin receptors, the susceptibility of the Ru drug adduct with holo-transferrin to exposure by glutathione and ascorbic acid (at their cancer cytosol concentrations) was studied by inductively coupled plasma mass spectrometry (ICP-MS), following isolation of the reaction products by ultrafiltration. Next, capillary electrophoresis coupled to ICP-MS was applied to monitor changes in the Ru speciation both under simulated cancer cytosol conditions and in real cytosol and to assign the charge state of novel metal species. The latter were identified by using tandem electrospray ionization MS in the respective ion mode. The formation of ruthenium(II) species was for the first time revealed, in which the central metal is coordinated by the reduced (GSH) or the oxidized (GSSG) form of glutathione, i.e. [RuIIHindCl4(GSH)]2− and [RuIIHindCl4(GSSG)]2−, respectively (Hind = indazole). Ascorbic acid released the ruthenium functionality from the protein-bound form in a different way, the products of adduct cleavage containing aqua ligands. Distribution of low-molecular mass species of Ru in human cytosol was found to have very much in common with the ruthenium speciation assayed under simulated cytosol conditions.
Introduction
Although ruthenium complexes show great promise as anticancer pharmaceuticals,1–3 their further rational development as drugs is hindered by an incomplete understanding of the mechanisms by which they enter and kill the target tumor cells.4,5 This statement does not side-step the most advanced, clinically tested compounds, two of which comprise the bis-indazole tetrachloridoruthenate(III) functional moiety (but differ in the type of the counter-ion). Despite a number of diversities in biological behavior expressed by the ruthenium compounds (including organometallics), they display two commonly encountered features. The first one is transport into cells by transferrin receptors that are overexpressed in rapidly proliferating cancerous cells due to a higher demand for iron. While binding to transferrin arguably implicates tumor cell accumulation for every Ru compound,5 there is a good deal of experimental proof in favor of transferrin-mediated transportation of indazolium trans-[tetrachloridobis(1H-indazole)ruthenate(III)] (I).6,7The second important facet that was suggested to explain the high anticancer activity of I, as well as other ruthenium(III) complexes, is the drug's activation by reduction in tumor tissue.8,9 Having poorly organized blood circulation, the tumor has a poor oxygen supply, leading cells to rely on glycolysis for producing energy and hence creating a reducing environment. It is assumed that after entry into the cell in the form of a transferrrin adduct, the Ru(III) functionality is released from the protein and converted to some Ru(II) species, which are believed to be more active regarding cell targets. However, it is still unclear what is responsible for the reduction. Moreover, to our knowledge, no evidence exists proving that reduction does occur, as no species of ruthenium(II) has ever been identified either in vivo, or in vitro, under conditions simulating cancer cytosol (the fact that the parent I can be reduced by glutathione10 is irrelevant to a real-world situation).
We believe that the use of metalloproteomic techniques associated with MS may help to recognize the cancer cell pathways for a given ruthenium drug and particularly to verify, with a mere in vitro experimental arrangement, whether (or not) these lead to the formation of Ru(II) species. In an early attempt to resolve this challenge,11 an integrated ICP-MS approach has been applied to shed light on the intracellular activation of I after its transferrin-mediated uptake. By combining information acquired by ICP-MS hyphenated with capillary electrophoresis (CE) and in standalone configuration, the evolution of novel Ru species under the action of glutathione and ascorbic acid was ascertained under simulated intracellular conditions. In the present paper, the ICP-MS platform was reinforced by electrospray ionization MS (ESI-MS), using the tandem (MS/MS) set-up, in order to identify new chemical entities of Ru and therefore verify the hypothesis of activation by reduction.
Experimental section
Instrumentation
An Agilent model 7500a ICP-quadrupole mass spectrometer (Tokyo, Japan) was used, employing the conditions listed in Table S1 (ESI†). The sample introduction system consisted of a Babington nebulizer (sample uptake 0.30 mL min−1), fitted in a commercial Scott spray chamber, a quartz torch with a standard inlet (2.5 mm), and a platinum sampler and skimmer cone (Agilent). Sample transport to the nebulizer was performed using a peristaltic pump. Total quantification was done using yttrium as an internal standard. As the detector for CE-ICP-MS, the mass spectrometer was interfaced to an Agilent HP3D CE system (Waldbronn, Germany) through a microconcentric CEI-100 nebulizer (CETAC, Omaha, USA) and a custom-machined low-dead-volume conical spray chamber (see ref. 11 for more detail). The self-aspirated make-up liquid (see Table S1 for composition, ESI†) was mixed with a separation electrolyte in a T-connector assembled at the outlet of the CE capillary. The signal of 72Ge was measured to control the stability of hyphenation performance and the efficiency of nebulization. A torch with a smaller inlet (1.5 mm) was utilized to decrease the influence of plasma backpressure on the electrophoretic flow, and a platinum shield was installed into the torch to improve sensitivity. Both CE, ICP-MS, and interface settings are shown in Table S1 (ESI†). Fused-silica capillaries of 70 cm total length and inner diameter of 75 μm were obtained from CM Scientific Ltd. (Silsden, UK). The capillary cassette and sample tray were thermostatted at 37 °C. Instrumental control and data analysis were performed using Agilent ChemStation software.Electrospray mass spectra were obtained using an Agilent 6460 mass spectrometer (Wilmington, USA) equipped with quadrupole mass analyzers. Samples were introduced by a syringe pump at a rate of 18 μL min−1. The main ESI-MS instrumental parameters are presented in Table S1 (ESI†). Instrument control and data analysis were performed using Mass Hunter Workstation software (Agilent). Calculations of isotope patterns were made by means of Iso/Pro version 3.0 MS/MS software (Scientific Instrument Services, East Amwell Township, USA).
A Bandelin Sonorex ultrasonic bath (Model 1210, Walldorf, Germany) was used for degassing the solutions. Samples were incubated at 37 °C in a WB 22 thermostat (Memmert, Germany). For ultrafiltration experiments, an MPW-350R centrifuge (JW Electronic, Poland), operating at 10![[thin space (1/6-em)]](https://www.rsc.org/images/entities/char_2009.gif) 000 rpm, and different molecular mass cut-off filters (Amicon Ultracel, Millipore, France) were employed.
000 rpm, and different molecular mass cut-off filters (Amicon Ultracel, Millipore, France) were employed.
Chemicals
Indazolium trans-[tetrachloridobis(1H-indazole)ruthenate(III)] (Fig. S1, ESI†) was a gift from Prof. Bernhard Keppler (University of Vienna). Human holo-transferrin (>98%), glutathione (>98%), L-ascorbic acid (>99.5%), acetic acid (>99.99%), and cytosol (from human liver, pooled) were obtained from Sigma-Aldrich. Sodium chloride, sodium dihydrogen phosphate, disodium hydrogen phosphate, ammonium chloride, and ammonium acetate, also from Sigma-Aldrich, were of analytical reagent grade. Sodium hydroxide, citric acid (>99.5%), and conc. nitric acid (for trace analysis) were the products of Fluka. Ammonia solution (25%, v/v), acetonitrile and methanol (both LC-MS purity) were purchased from POCh (Poland). The ICP standard solutions of germanium, yttrium, and ruthenium (1 g L−1) were from Merck or Agilent. High-purity water (18 MΩ cm−1) obtained from a Milli-Q water purification system (Millipore Elix 3, Saint-Quentin, France) was used throughout.Preparation of the Ru drug adduct with transferrin
The stock solution of I (1 mM) was prepared daily in 100 mM NaCl or 20 mM NH4Cl (for ICP-MS and ESI-MS experiments, respectively) and mixed with 5 × 10⁻⁵ M protein solution in phosphate buffer saline (10 mM phosphate buffer, 100 mM NaCl, pH 7.4) to yield a two-fold molar excess of I over the protein in the final solution. The mixture was incubated for 3.5 h at 37 °C to ensure complete adduct formation and then ultrafiltrated through a 10 kDa cut-off filter for 30 min (37 °C). Finally, reverse ultrafiltration was used to isolate the adduct (∼30 μL).ICP-MS analysis
The solution mimicking the intracellular medium of cancer cells comprised 10 mM phosphate buffer, 4 mM NaCl, pH 6.0 and contained glutathione (10 mM) or ascorbic acid (10 mM). It was used to dilute the adduct solution (final concentration of 5 × 10⁻⁵ M) prior to incubation (37 °C). Representative aliquots were serially taken for ultrafiltration using 10, 30, or 50 kDa cut-off filters (40 min, 37 °C). Both ultrafiltrate and residual fractions were diluted to 200 μL with 10 mM phosphate buffer (pH 6.0) and analyzed after a 50-fold dilution with 2% nitric acid containing 10 ng mL−1 yttrium.CE-ICP-MS
Samples were prepared similarly as for ICP-MS analysis (but without acidification) and introduced into the capillary hydrodynamically by applying a pressure of 30 mbar for 10 s (injection volume 25.5 nL). The capillary was conditioned before and between analyses, as described in the ESI.† The background electrolyte was 10 mM phosphate buffer, 4 mM NaCl (pH 6.0) prepared daily. A voltage of 25 kV was applied to generate separations (with the positive polarity placed at the inlet end of the capillary).In the case of cytosol analyses, human cytosol was diluted 10 times with 1 mM phosphate buffer (pH 6.0) fortified with glutathione (1 mM), ascorbic acid (1 mM) and citric acid (10 mM) and then ultrafiltrated through a 10 kDa cut-off filter for 1 h (4 °C) to separate high-molecular-mass (HMM) cytosol components. After the addition of the adduct to the ultrafiltrate, the mixture was diluted with 1 mM phosphate buffer (pH 6.0) to 400 μL (final Ru concentration of about 1 × 10⁻⁵ M). Upon incubation of the adduct-cytosol mixture (37 °C), aliquots were taken and subjected to analysis after ultrafiltration (10 kDa, 40 min, 37 °C).
ESI-MS analysis
Samples were prepared by diluting the adduct (formed as described above but using 10 mM ammonium acetate, pH 7.4) with 10 mM ammonium acetate buffer (pH 6.0), containing 10 mM glutathione or 10 mM ascorbic acid. After incubation and ultrafiltration through a 10 kDa cut-off filter, ultrafiltrates were mixed with acetonitrile (final concentration 30%, v/v) to improve ionization efficiency and injected directly to the ESI-MS source. Methanol also tried as a modifier was found to form agglomerates with the ruthenium compounds that complicates signal interpretation in mass spectra. Blank samples containing no ruthenium drug were made up in a similar way.Results and discussion
To elucidate the release and the nature of ruthenium species, possibly resulting from intracellular transformation of the drug–transferrin adduct, a three-dimensional approach was applied, according to the scheme presented in Fig. 1. Each of the analytical methods employed has a proven record in metalloproteomic studies of anticancer drugs,12–15 including a recent trend toward in-vitro investigation of their cell processing.11,16 Ultrafiltration was used as a simple, fast, and species-friendly method for separating basically low-molecular-mass (LMM) forms of ruthenium from proteinaceous compounds before analysis. Specifically, an attempt was made to establish a relationship between the number and net charge of the Ru species observed in ICP-MS electropherograms and detected by ESI-MS/MS. | ||
| Fig. 1 Analytical protocol for isolation and identification of LMM species of Ru formed under cytosol-like conditions. | ||
Initial characterization of the released ruthenium species
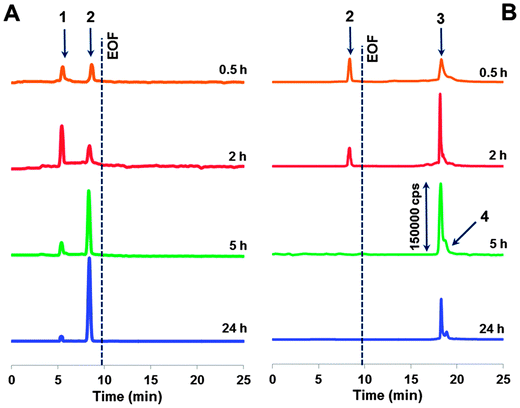 | ||
| Fig. 3 Electropherograms of ultrafiltrates obtained after adduct incubation with (A) ascorbic acid and (B) glutathione at varying times. For CE-ICP-MS conditions, see the Experimental section. | ||
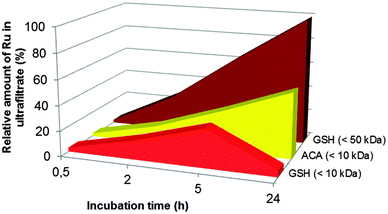
In the presence of glutathione in the incubated mixture, we observed only one cationic Ru species detached from the adduct. It is important to mention with the reference to standalone ICP-MS experiments that its peak tends to decrease with time and falls below the LOD (1 × 10⁻⁷ M) after 5 h of incubation. Also distinguishing for the releasing pathway ruled by glutathione is that along with the positively charged species, there are some anionic products generated (see the co-migrating peaks in Fig. 3B). Their signals increase upon increasing the incubation time, reaching a maximum after 5 h (cf.Fig. 2). CE-ICP-MS analysis of the respective HMM fraction (>10 kDa) also revealed a single peak (Fig. S2, ESI†). In contrast, when the reaction mixture was filtered using a 50 kDa cut-off filter, a ruthenium peak was detected only for the ultrafiltrate. Another observation, for reasons undefined yet, is that for the adduct incubated together with glutathione and ascorbic acid, or in a mixture, also including citric acid, all ruthenium freed evolves into the LMM fraction.
Summarizing, the most trustworthy conclusion from ICP-MS and CE-ICP-MS assessment undertaken above is that cytosol reducing components induce speciation changes of the drug–transferrin adduct accompanied by the formation of a number of ruthenium species. Their release occurs differently under the influence of ascorbic acid or glutathione with respect to the amount of LMM forms (i.e., those passing through a 10 kDa filter).
Identification of low-molecular-mass ruthenium species
By performing ESI-MS experiments, we were able to detect (and identify) two positively charged forms and a cationic and one or two anionic ruthenium LMM species in sample solutions containing ascorbic acid and glutathione, respectively (at least over the first hours of incubation; see Fig. 3). Main signals observed in both ionization modes, as well as signals produced in the MS/MS mode, with the proposed formulas of detected ions, are presented in Table 1.| Reductant and observed ions | Product ions | Equivalent ionsa | m/z | |
|---|---|---|---|---|
| Measured | Theoretical | |||
| a An equivalent ion in an opposite polarity spectrum. b Not detected. c The mass for a signal of highest intensity in the isotopic profile. | ||||
| Ascorbic acid | ||||
| [RuIII(Hind)2(OH)2(H2O)2]+ | 408.0 | 408.04 | ||
| [RuIIIHind(OH)2(H2O)2]+ | 290.1 | 289.98 | ||
| NDb | — | — | ||
| Ascorbic acid or glutathione | ||||
| [RuIIHind(OH)(H2O)3]+ | 291.1 | 290.99 | ||
| [RuII(OH)(H2O)3]+ | 172.9 | 172.94 | ||
| [RuIIHind(OH)(H2O)3 − 2H]− | 289.1 | 288.98 | ||
| Glutathione | ||||
| [RuIIHindCl4(GSH)]2− | 334.5 | 334.46c | ||
| [RuIIHindCl4]2− | 180.9 | 180.92c | ||
| [RuIIHindCl4(GSH) + 3H]+ | 671.9 | 671.94c | ||
| [RuIIHindCl4(GSSG)]2− | 486.9 | 486.99c | ||
| [RuIIHindCl4(GSH)]2− | 334.6 | 334.46c | ||
| [RuIIHindCl4]2− | 180.9 | 180.92c | ||
| [RuIIHindCl4(GSSG) + 3H]+ | 976.9 | 977.01c | ||
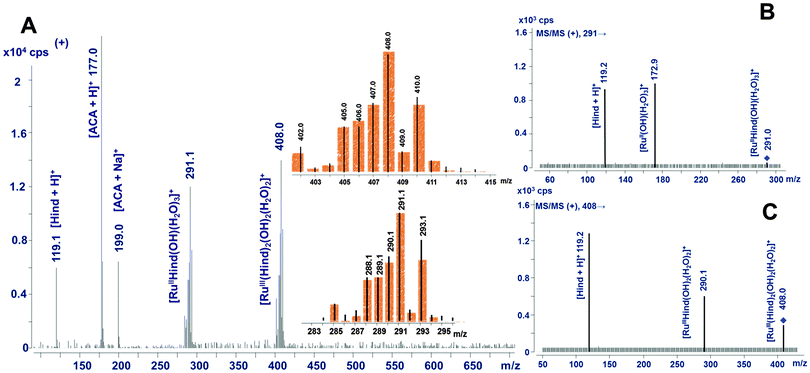
For the adduct that interacted with ascorbic acid, the specific signal at m/z 408 was observed in the positive mode (Fig. 4A), whose ruthenium isotopic pattern is characteristic of a singly charged ion. The most plausible assignment of this species is [RuIII(Hind)2(OH)2(H2O)2]+ that can be formed due to liberating the parent complexed anion of I, [RuIII(Hind)2Cl4]−, followed by its exhaustive hydrolytic conversion into the assigned cationic complex. Another abundant species of Ru (m/z 291) was seen in the mass spectra of individual samples containing ascorbic acid (see Fig. 4A) or glutathione (data not shown). Its ruthenium isotopic profile also corresponds to a monocharged ion, probably, being created through the loss of one indazole ligand by the removed Ru moiety, accompanied by the reduction of Ru(III) to Ru(II), i.e. [RuIIHind(OH)(H2O)3]+. For this ion the signal at m/z 289 was found in the negative mode (ascribed to [RuIIHind(OH)(H2O)3 − 2H]−). To define the proposed structures more unequivocally, the MS/MS spectra were recorded for both anticipated ions with m/z 291 and 408, which revealed the signals at m/z 173 and 290, respectively (see Fig. 4, traces B and C, and also Table 1). These fragmented ions are evidently produced via the loss of an indazole ligand that is represented in the product ion mode by a signal of [Hind + H]+ (m/z 119).
For anionic ruthenium LMM species caused by glutathione, the proposed compositions correspond mainly to complexes in which the chlorido ligands remained bound to Ru (Table 1). Two main signals at m/z 335 and 487 were found in negative-mode mass spectra (Fig. 5), belonging to doubly charged ions, as indicated by a gap of 1/2 unit spaces between two most intensive signals in ruthenium isotopic profiles. Taking into account this observation, these ions can be assigned to [RuIIHindCl4(GSH)]2− and [RuIIHindCl4(GSSG)]2−, respectively. This assignment was confirmed by ESI-MS/MS: both parent ions produced a secondary ion at m/z 181 identified as [RuIIHindCl4]2−. The presence of GSH in both suggested products was proved by detecting a signal with m/z 306 in the MS/MS mode. Also in support, both anionic complexes of Ru(II) give rise to the corresponding [+3H]+ signal in the positive mode (see Table 1). Additionally, after being subjected to glutathione action for 8 h, the Ru–transferrin adduct generated another, less abundant signal at m/z 1381 (spectrum not shown). We assume that the corresponding ruthenium species encompasses some glutathione aggregates.
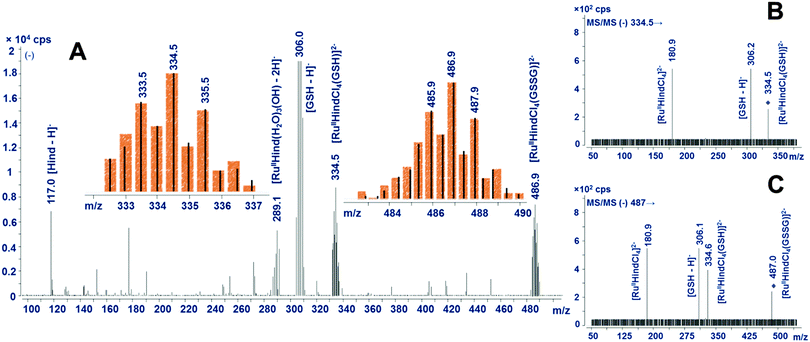 | ||
| Fig. 5 ESI-MS and ESI-MS/MS spectra (negative mode) of LMM species after the adduct exposure by glutathione for 2 h (A – scanning mode; B and C – spectra for selected ion fragmentation at m/z 335 and 487, respectively). For insets, see Fig. 4. | ||
It stands to reason that the results of molecular MS testing are in conformity with CE-ICP-MS data, regarding the number and charge polarity of LMM species discovered. As another important outcome, the cytosol reductants under scrutiny exhibit marked differences in the mechanism by which they cleave the Ru–transferrin adduct. Ascorbic acid was shown to remove the ruthenium moiety from the protein, inducing its conversion into a pair of essentially hydrolyzed, positively charged species which are arguably very active to bind to nitrogen or sulfur donor molecules. The assortment of LMM products driven by glutathione comprises both cationic and anionic forms, the latter incorporate the coordinated reductant (itself or in the oxidized form) and chlorides but no aqua or hydroxy ligands. However, accounting for the scope of this study, the most striking result is the release of ruthenium from the protein-bound form (caused by both reductants) that leads to the reduction of the central metal to ruthenium +2.
Speciation of low-molecular-mass ruthenium in human cytosol
In order to approach the real-world scenario and particularly, to verify the formation of the LMM species of Ru, the drug adduct with transferrin was subject to incubation with the LMM fraction of diluted human cytosol and CE-ICP-MS probing. Dilution was necessary not only to adjust the pH of normal cytosol (pH 7.4) to that of cancer cells (about 6) but also to avoid the capillary clogging. The diluted cytosol was fortified with glutathione, ascorbic acid, and citric acid to fine-tune their concentrations to those typical for cancer cells. Fig. 6 shows a separation profile that resembles very much electropherograms monitored under simulated conditions (see Fig. 3). Additionally peaks were observed (between 10 and 15 min) that belong to some products having a lower charge, or a larger size (or both). This indicates a more complex composition and eventually, a more complex releasing process in the biomatrix. The peak areas of unknown species increased with incubation time, while other four ruthenium peaks experienced rather an opposite trend. Importantly, the cleavage of the Ru adduct was as slow as observed under cytosol-mimicking conditions, hence proving their rightful selection for the present study. However, the amount of the LMM ruthenium was much smaller compared to model solutions, constituting nevertheless about 25% after 24 h. Thus, the drug–transferrin adduct might be cleaved intracellularly by the reaction with cytosol reductants, making the induced species possibly available for further reactions in the cell.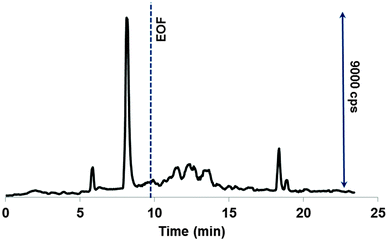 | ||
| Fig. 6 Ru-specific electropherogram of the species released from the adduct incubated for 1 h in human cytosol. For CE-ICP-MS and cytosol pretreatment conditions, see the Experimental section. | ||
Conclusions
The appearance of the ruthenium(II) species, if this does take place in vivo, is a prerequisite of Ru(III) drug's activation. From this viewpoint, the presented results, especially observations in a human cytosol environment, have significant implications for the mode of action in the cell. However, it is not certain that these species would be involved in cell processing of I, and in particular, interact with cell targets. These concerns drive our on-going research in two directions. First, it appears indispensable to prove drug conversion into LMM species of Ru(II) in cancer cytosol. Second, the respective HMM fraction is to be thoroughly analyzed to identify and characterize proteinaceous and other biomolecular forms, possibly containing the ruthenium(II) moieties. In pursuing these research goals, we will rely on the same multidimensional analytical methodology as well as on supplementary techniques, such as SEC-ICP-MS and capillary HPLC-ESI-MS, to be also applied after enzymatic digestion for metal-bound peptide mapping.Acknowledgements
The authors are thankful to Katarzyna Witkoś for assistance with ESI-MS/MS measurements. Financial support of this research by the European Union in the framework of Regional Development Fund through the Joint UW and WUT International PhD Program of Foundation for Polish Science – “Towards Advanced Functional Materials and Novel Devices” (MPD/2010/4) is gratefully acknowledged.References
- A. Levina, A. Mitra and P. A. Lay, Metallomics, 2009, 1, 458–470 RSC.
- T. Gianferrara, I. Bratos and E. Alessio, Dalton Trans., 2009, 7588–7598 RSC.
- E. S. Antonarakis and A. Emadi, Cancer Chemother. Pharmacol., 2010, 66, 1–9 CrossRef CAS PubMed.
- P. J. Dyson and J. Sava, Dalton Trans., 2006, 1929–1933 RSC.
- A. Bergamo and J. Sava, Dalton Trans., 2011, 40, 7817–7823 RSC.
- C. G. Hartinger, S. Zorbas-Seifried, M. A. Jakupec, B. Kynast, H. Zorbas and B. K. Keppler, J. Inorg. Biochem., 2006, 100, 891–904 CrossRef CAS PubMed.
- N. Cetinbas, M. I. Webb, J. A. Dubland and C. J. Walsby, JBIC, J. Biol. Inorg. Chem., 2009, 15, 131–145 CrossRef PubMed.
- M. J. Clarke, Coord. Chem. Rev., 2003, 236, 209–233 CrossRef CAS.
- E. S. Antonarakis and A. Emadi, Cancer Chemother. Pharmacol., 2010, 66, 1–9 CrossRef CAS PubMed.
- P. Schluga, C. G. Hartinger, A. Egger, E. Reisner, M. Galanski, M. A. Jakupec and B. K. Keppler, Dalton Trans., 2006, 1–7 Search PubMed.
- S. S. Aleksenko, M. Matczuk, X. Lu, L. S. Foteeva, K. Pawlak, A. R. Timerbaev and M. Jarosz, Metallomics, 2013, 5, 955–963 RSC.
- A. R. Timerbaev, C. G. Hartinger, S. S. Aleksenko and B. K. Keppler, Chem. Rev., 2006, 106, 2224–2248 CrossRef CAS PubMed.
- A. Timerbaev, K. Pawlak, C. Gabbiani and L. Messori, TrAC, Trends Anal. Chem., 2011, 30, 1120–1138 CrossRef CAS PubMed.
- M. Petković and T. Kamčeva, Metallomics, 2011, 3, 550–565 RSC.
- A. R. Timerbaev, K. Pawlak, S. S. Aleksenko, L. S. Foteeva, M. Matczuk and M. Jarosz, Talanta, 2012, 102, 164–170 CrossRef CAS PubMed.
- A. R. Timerbaev, L. S. Foteeva, K. Pawlak and M. Jarosz, Metallomics, 2011, 3, 761–764 RSC.
Footnote |
| † Electronic supplementary information (ESI) available: Scheme S1: structural formula of the Ru drug. Table S1: measurement parameters for the ICP-MS, CE-ICP-MS, and ESI-MS/MS. Conditions for capillary pretreatment. Fig. S1: measurement of EOF. Fig. S2: distribution of ruthenium between low- and high-molecular-mass fractions. See DOI: 10.1039/c3mt00252g |
| This journal is © The Royal Society of Chemistry 2014 |

