Controlled formation and disappearance of creases†
Dayong
Chen‡
a,
Lihua
Jin‡
b,
Zhigang
Suo
*b and
Ryan C.
Hayward
*a
aDepartment of Polymer Science & Engineering, University of Massachusetts, Amherst, MA 01003, USA. E-mail: rhayward@mail.pse.umass.edu
bSchool of Engineering and Applied Sciences, Kavli Institute for Nanobio Science and Technology, Harvard University, Cambridge, MA 02138, USA. E-mail: suo@seas.harvard.edu
First published on 14th November 2013
Abstract
Soft, elastic materials are capable of large and reversible deformation, readily leading to various modes of instability that are often undesirable, but sometimes useful. For example, when a soft elastic material is compressed, its initially flat surface will suddenly form creases. While creases are commonly observed, and have been exploited to control chemical patterning, enzymatic activity, and adhesion of surfaces, the conditions for the formation and disappearance of creases have so far been poorly controlled. Here we show that a soft elastic bilayer can snap between the flat and creased states repeatedly, with hysteresis. The strains at which the creases form and disappear are highly reproducible, and are tunable over a large range, through variations in the level of pre-compression applied to the substrate and the relative thickness of the film. The introduction of bistable flat and creased states and hysteretic switching is an important step to enable applications of this type of instability.
While elastic instabilities, such as buckling of a column or wrinkling of a sheet, have long been regarded as modes of failure in architectural structures,1 electromechanical systems,2 and composite materials,3 they have increasingly been exploited for a variety of applications.4–12 An example of recent interest is the formation of surface creases when a soft elastic material is compressed beyond a critical value.13–16 Creases may look superficially like cracks, since both correspond to sharp, singular features. A significant difference, however, can be readily appreciated and will have practical implications. While repeated opening and closing of cracks often leads to fatigue and catastrophic failure, the elastic character of creases makes it possible to cycle a soft material repeatedly between flat and creased states without inducing damage.
The formation of creases corresponds to a pronounced change of state, reminiscent of a phase transition. This change of state has recently been used to connect diverse stimuli to multiple functions. Crease-inducing stimuli include temperature,17 light18 and electric fields.19,20 Functions enabled by the formation of creases include the control of chemical patterns,17,18 enzymatic activity,17 cellular behavior,21 and adhesion.22 Each of these applications depends on how creases form and disappear. For a planar surface under in-plane compression, the creasing instability is supercritical, where creases appear and disappear at the same critical strain, with no hysteresis.15 In practice, however, surface tension provides a small energy barrier against creasing, thus leading to nucleation and growth of shallow, but finite-depth, creases at small over-strains beyond the critical value.16 It is tantalizing to imagine devices that exploit snapping creases, in a way analogous to other snap-through instability used to trigger giant deformation between bistable states.11,12 Unfortunately, the challenges associated with controlling this barrier, and the related presence of adhesion within the self-contacting creases,16 have led to widely varying degrees of hysteresis in different material systems23–27 complicating the application of creases.
Here we describe a strategy to create bistable flat and creased states, and to switch between the two states repeatedly, with hysteresis, at reproducible strains. We pre-compress a thick substrate, and then attach a thin film on top of the substrate. When we further compress the substrate-film bilayer, the difference in compression between the two layers defines an elastic energy barrier that separates the flat state from a state with deep creases that penetrate into the substrate. We use a combination of experiments and calculations to show that this approach yields well-defined bistable states, connected by a snap-through instability. The strains at which the creases form and disappear are tunable over a large range, through the pre-compression of the substrate and the relative thickness of the film.
The formation of creases can be either a supercritical or subcritical bifurcation. We sketch the bifurcation diagrams using the applied strain ε as the control parameter, and the depth of crease d as an indicator of state (Fig. 1). The depth of a crease d is defined as the distance between the uppermost point on the free surface and the bottom of the self-contacting region. For each type of bifurcation, a compressed solid has two branches of equilibrium states: the flat and the creased states. In the bifurcation diagram, the branch of flat states corresponds to the horizontal axis d = 0, while the branch of creased states corresponds to a curve with d > 0. In the supercritical bifurcation, the creased branch is a monotonic function. When ε exceeds a critical value εC, the flat surface forms creases. The depth of the creases d is infinitesimal initially, and then increases gradually as ε increases. When ε is reduced, the creases disappear at the same critical strain εC, with no hysteresis. By contrast, in the subcritical bifurcation, the creased branch is not a monotonic function. When the applied compressive strain exceeds the strain εF, the flat state becomes unstable, but no creased state of small depth exists; rather, the flat surface snaps forward to a state with creases of finite depth dF. When the applied compressive strain is reduced, the depth of the creases decreases gradually initially and then, at a finite depth dB and strain εB, the creased surface snaps backward to the flat state. That is, the switching between the flat and the creased state is hysteretic.
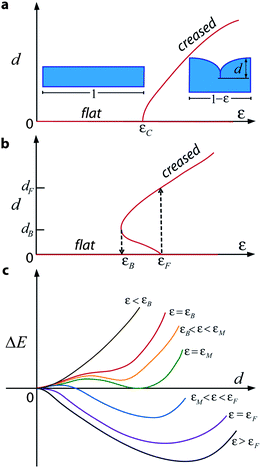 | ||
| Fig. 1 Supercritical and subcritical creases. Bifurcation diagrams for (a) supercritical and (b) subcritical creases. (c) Energy landscape corresponding to the subcritical bifurcation diagram. | ||
We can also describe the subcritical bifurcation by sketching the change in elastic energy ΔE to form creases as a function of the depth of the creases d (Fig. 1c). A minimum energy corresponds to a stable equilibrium state, and a maximum energy corresponds to an unstable equilibrium state. The shape of the energy landscape depends on the applied compressive strain ε. At a very small strain, ε < εB, creases of any depth raise the energy, and the flat state is stable. At a very large strain, ε > εF, the flat state is unstable, and a creased state is stable. At an intermediate strain, εB < ε < εF, the energy landscape has two local minima, one corresponding to a flat state, and the other to a creased state. Between the snap-forward strain εF and the snap-backward strain εB lies the Maxwell strain εM, at which the two energy minima are equal. The flat state has a lower energy than the creased state when εB < ε < εM, and the opposite is true when εM < ε < εF.
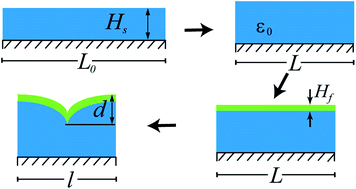
We design a system capable of tunable hysteresis of creases by using a multilayer setup (Fig. 2). We stretch a mounting layer to a length L0, and attach a substrate of undeformed thickness Hs = 200 μm. We then partially relax the mounting layer to a length L, which compresses the substrate to a pre-strain ε0 = 1 − L/L0. On the pre-strained substrate we attach a film of undeformed thickness Hf = 4 μm. When we relax the mounting layer to a length l, the film is under a compressive strain of ε = 1 − l/L. Both the film and substrate are poly (dimethyl siloxane) (PDMS; Sylgard 184, Dow Corning) elastomers of the same composition (40![[thin space (1/6-em)]](https://www.rsc.org/images/entities/char_2009.gif) :
:![[thin space (1/6-em)]](https://www.rsc.org/images/entities/char_2009.gif) 1 base:crosslinker by weight), and thus possess identical elastic properties in the undeformed state (shear modulus G = 16 kPa). The mounting layer is a much stiffer and thicker PDMS slab (G = 260 kPa), which keeps the bottom boundary of the substrate nearly planar while enabling the application of large compressive strains. All experiments are conducted with the surface submerged under an aqueous solution containing 0.5 mg mL−1 3-[hydro(polyethyleneoxy) propyl] heptamethyltrisiloxane (Gelest), which greatly reduces both surface tension (to ∼0.8 mN m−1) and self-adhesion,16 minimizing the importance of these effects compared to elasticity. As a result, the hysteresis arises predominantly from the elastic barrier due to the differential strain between the thin film and substrate, rather than the small residual surface energy and adhesion in the self-contacting region.
1 base:crosslinker by weight), and thus possess identical elastic properties in the undeformed state (shear modulus G = 16 kPa). The mounting layer is a much stiffer and thicker PDMS slab (G = 260 kPa), which keeps the bottom boundary of the substrate nearly planar while enabling the application of large compressive strains. All experiments are conducted with the surface submerged under an aqueous solution containing 0.5 mg mL−1 3-[hydro(polyethyleneoxy) propyl] heptamethyltrisiloxane (Gelest), which greatly reduces both surface tension (to ∼0.8 mN m−1) and self-adhesion,16 minimizing the importance of these effects compared to elasticity. As a result, the hysteresis arises predominantly from the elastic barrier due to the differential strain between the thin film and substrate, rather than the small residual surface energy and adhesion in the self-contacting region.
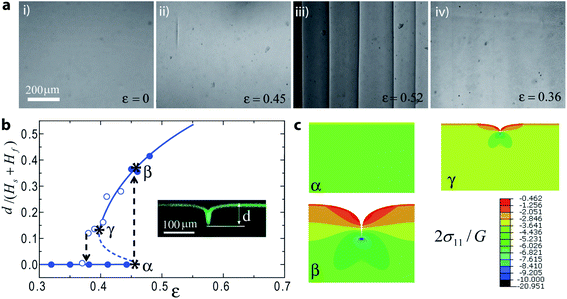
We use reflected light optical microscopy to obtain top-view images in situ while relaxing the mounting layer (Fig. 3a). The substrate is under pre-strain ε0 = 0.15. When the film is compressed, the flat surface snaps forward into the state of deep creases at a strain of εF = 0.45. Notably, the value of snap-forward strain εF is very close to the anticipated value of 0.44, i.e., the critical strain for creasing of the film, since the barrier due to surface tension here is very low, and hence even small defects are sufficient to enable creases to nucleate. As compressive strain is further increased, additional deep creases nucleate and grow on the surface, eventually packing into a quasi-periodic array, as seen in Fig. 3a, panel iii. The tendency of creases to adopt an average spacing proportional to the layer thickness, but without well-defined periodicity, is well known,28 and results from the difficulty of sliding creases laterally across the surface to adjust the crease locations initially defined by the nucleation and growth process. Once the quasi-periodic array is established, further compression causes the crease spacing to be reduced in an affine manner, i.e., such that the spacing between creases follows α(Hf + Hs)(1 − ε). Here, we measure a value of α that ranges from 1.9–2.8 between neighboring creases. Thus, we adopt a typical value of α = 2.5 for the numerical simulations. When the compressive strain is reduced below the snap-backward strain, the surface becomes flat again. No scars or other visible signs of the creases remain.
We use finite-element software ABAQUS to simulate the formation of creases. To construct the entire branch of creased states, namely, both the stable and unstable equilibrium states, we use the Riks method of arclength continuation.29 Due to the combination of the Riks method and issues associated with self-contact, the simulation often does not converge. To enable these calculations, we therefore place a much softer material on top of the film, which prevents surface self-contact and facilitates convergence of the simulation. As the modulus of this top layer is made much smaller than that of the film and substrate, the result will asymptotically approach that for a free surface.30 As an example, we present the bifurcation diagram for the case ε0 = 0.15 and Hf/(Hs + Hf) = 0.02 (Fig. 3b) obtained using this method. Also shown are cross-sections with the contour plots of the normalized true stress in the compression direction generated from the simulation (Fig. 3c). The snap-forward strain is set by the condition to form a crease in the film, which should be the same as the critical strain for a crease to form in a homogeneous material under uniaxial compression, εF = 0.44.15 The result calculated here, εF = 0.46, is slightly higher than this value, reflecting the small influence of the soft material placed above the film. We focus on the case that the film is much thinner than the substrate, Hf ≪ Hs. The equilibrium depth of this crease will be set by the substrate thickness—that is dF is a fraction of Hs. Over some intermediate range of strains, two (meta-)stable states exist, one corresponding to a flat surface (d = 0), and the other to a deep crease. In this regime, the film remains below the critical strain for creasing, and hence a shallow crease with d ≪ Hf raises the elastic energy, while the substrate is above the critical strain, and hence a deeper crease that penetrates into the substrate with d ≫ Hf can lower the elastic energy.
To provide a detailed comparison with these predictions, we use laser scanning confocal microscopy (LSCM) to characterize the cross-sections of the samples. The film is stained with fluorescein,16 and the deep crease is clearly visible (Fig. 3b inset). Experiments show that upon loading (solid symbols) the surface remains flat until a strain of ε = 0.45 before forming creases. Just beyond this point, a normalized crease depth of dF/(Hs + Hf) = 0.36 is measured, clearly indicating that the creases extend a distance many times the film thickness into the substrate. These values are in good agreement with numerical predictions. As mentioned above, the snap-forward strain εF obtained by the finite element simulations is around 0.46, which is slightly above the anticipated value of 0.44, due to the addition of the extremely compliant layer to help the numerical convergence. The snap-forward strain εF = 0.45 observed in experiments also represents a slight overestimate due to the small remaining barrier from surface tension.
Upon subsequently reducing the strain (open symbols), the creases become shallower, reaching a limiting depth of dB = 0.12(Hf + Hs) before undergoing a discontinuous snap-through transition back to the flat state at value of εB = 0.38. The experimental results and numerics show good agreement, although the measured values of εB are slightly lower than the predictions. In the simulations, the snap back strain εB is slightly overestimated due to the soft layer placed above the film. We also suspect that the experimental value of εB may be reduced slightly due to a small amount of adhesion of the surface within the self-contacting region. Nevertheless, bistability between flat and creased states, and a well-defined window of hysteresis are clearly developed by applying a compressive pre-strain to a soft substrate underlying a soft film.
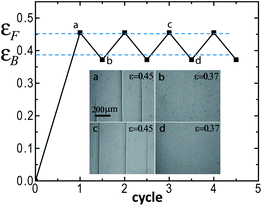
Our experimental measurements show that the snap-forward and snap-backward strains are reproducible (Fig. 4). The measured values of εF and εB remain unchanged over several cycles within the precision of our measurements, once again indicating that no permanent scarring or damage to the material has occurred. The inset images in Fig. 4 show the first cycle (a and b) and the third cycle (c and d) switching between creased states and flat states. During the third cycle, the sample is left creased (image c) for 2–3 days prior to snapping back at the same strain, indicating that even long-term aging does not damage the material. However, the creases do form at the same locations during each cycle, presumably due to the heterogeneities in the film that consistently serve as nucleation sites.23
When the applied strain lies between the Maxwell strain εM and the snap-forward strain εF, the flat state is metastable against the formation of creases, and hence it should be possible to mechanically perturb the surface to overcome the elastic energy barrier and drive the formation of a deep crease. ESI, Movie 1† shows just this behavior on the surface of a bilayer with ε0 = 0.15 and ε = 0.42 gently poked with a glass micropipette. Initially, a crease forms rapidly, and only in the vicinity of the perturbation. However, since the crease is lower in energy than the flat state, this localized crease spreads laterally, or “channels”, slowly from both ends over time. While this local snapping is fast, propagation of the short deep crease is slow. On the contrary, if the applied strain is below εB, the flat surface is the global energy minimum and should be stable against perturbations. For bilayer with ε0 = 0.15 and ε = 0.37, while poking with a glass micropipette induces formation of a transient crease, the flat state is quickly recovered (ESI, Movie 2†).
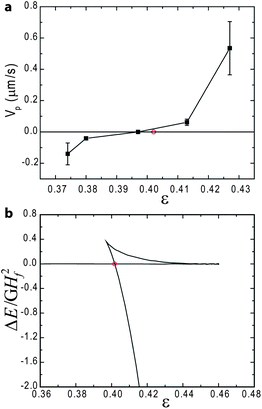
This behavior allows us to experimentally determine the Maxwell strain, where the crease propagation speed should vanish, which is otherwise difficult to measure. As in Movie 1,† an isolated crease is formed first by poking the surface of a sample compressed to εM < ε < εF. The compressive strain is then reduced stepwise and the crease propagation velocity characterized at each step (ESI, Movie 3†). As plotted in Fig. 5a, the growth velocity decreases as the applied strain is lowered, due to the reduction in the driving force for growth (i.e., the difference in elastic energy between the flat and creased states), just as in channeling of cracks.31 When the strain is reduced to the Maxwell strain, the crease ceases to propagate, and ultimately begins to retract from both ends with further decreases in strain. In Fig. 5b, we plot the normalized energy difference between the creased state and the flat state obtained by simulations. The shallow crease solution always has higher energy than the flat state, while the deep crease solution has energy lower than the flat state when the strain is higher than the Maxwell strain. The predicted Maxwell strain, defined as the strain when the flat state and the deep creased state have the same elastic energy, is denoted by red open circles in Fig. 5a and b. When ε0 = 0.15 and Hf/(Hf + Hs) = 0.02, the Maxwell strain is predicted as εM = 0.402, while the measured value is εM = 0.397 ± 0.005, very close to the prediction. However, we note that the predicted Maxwell strain is for periodic creases, while the measured Maxwell strain is for an isolated crease, thus the two should not agree perfectly. While the kinetics of crease channeling remain under study, we note that the slow propagation speeds of 0.54 μm s−1 to −0.14 μm s−1 (Fig. 5a) likely reflect the viscoelastic relaxation of material elements near the front of the propagating crease, in a similar fashion as for propagating cracks.32
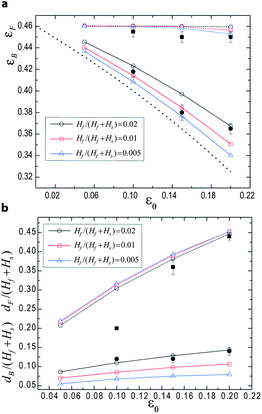
We use finite element simulations to characterize how the hysteresis of creases depends on the level of pre-strain and the thickness ratio of the film and substrate (Fig. 6). The snap-forward strain εF has no dependence on either quantity, as it is simply determined by the stability of the film against forming a shallow crease. In contrast, the snap-backward strain εB increases with Hf/(Hf + Hs) but decreases with ε0. Snapping back is determined by the difference between the energy reduction in the substrate and the energy increase in the film in the deep creased state with respect to the flat state. When the pre-strain ε0 is larger, the energy reduction in the substrate in the deep creased state is bigger and hence the snap-backward strain εB is lower. When ε0 is smaller, the snap-backward strain gets closer to the snap-forward strain εF and converges to εF when ε0 = 0. In the limit of vanishing film thickness, the snap back strain εB should correspond to the point where the strain in the substrate drops to the critical strain for creasing. This would lead to the relationship εB = (εF − ε0)/(1 − ε0), as plotted in Fig. 6a (black dotted line). When the thickness ratio Hf/(Hf + Hs) is larger, the energy increase in the film in the deep creased state is bigger and the snap back strain is higher. The snap-forward depth dF is primarily set by the thickness and strain of the substrate. Hence, dF is almost independent of the film thickness but increases with the pre-strain ε0. However, the snap back depth dB increases with the film thickness, for similar reasons as the effect on εB described above. The snap back depth dB also increases with the pre-strain ε0, since the depth of the crease increases with the strain in the substrate. With the decrease of ε0, dF gets closer to dB. Finally both converge to 0 when ε0 = 0, and the instability becomes supercritical with no hysteresis. In the current study, we only consider pre-strains ε0 ≤ 0.2, because larger pre-strains yield wrinkles at strain smaller than εF. However, we note that reducing the modulus of the film below that of the substrate allows the pre-strain ε0 to be tuned over a larger range. We also include in Fig. 6 the corresponding experimental results for the thickness ratio studied, Hf/(Hf + Hs) = 0.02, which show rather good agreement with numerical results. These results provide detailed guidelines for fine-tuning both the extent of the hysteresis window in strain, as well as the amplitudes of both the snap-in and snap–out transitions.
Conclusions
In this report, we have described a robust method for controlling the hysteretic behavior of surface creases through application of compressive pre-strain to the substrate of a soft bilayer. Over a well-defined range of strain, the system shows kinetic bistability between flat and deep creased states with snap-through transitions between these states at either extreme. Surfaces can be repeatedly snapped forward and backward between these states with little variation, and in good agreement with the predictions from numerical analysis. We anticipate that the greatly improved control over hysteresis, and the demonstration of bistability over a substantial range of strain will open new opportunities for applications of creases in sensors and responsive surfaces. This experimental system of a bilayer supported on a pre-stretched foundation provides great freedom to independently tune the modulus, thickness and pre-stretch/compression of both the substrate and film layers. While the current study has concerned only a very small range of parameter space with small values of Hf/(Hf + Hs), identical material properties for the film and substrate, and a narrow range of ε0, we anticipate that the same approach will enable detailed studies of the rich landscape of behaviors in other regimes.Experimental
Sample preparation
All experiments are performed on bilayers supported on a pre-stretched elastic ‘mounting layer’. The film layer and substrate layer consist of Sylgard 184 (Dow Corning) PDMS, while the mounting layer is prepared using a custom PDMS formulation from Gelest Inc. The mounting layer is prepared by first thoroughly mixing part A containing 99.997% fumed silica reinforced vinyl terminated PDMS (DMS-V31S15, Gelest Inc.) and 0.003% platinum catalyst (SIP6831.2) and part B containing 90% vinyl terminated PDMS (DMS-V31) and 10% trimethylsiloxy terminated methylhydrosiloxane-dimethylsiloxane copolymer (HMS-301) by a weight ratio 3 to 1. The mixture is then degassed, spread onto a silicon wafer, and cured at 120 °C for 8 h to yield a PDMS film with a thickness of ∼1–1.2 mm. This PDMS film is then cut into 0.8 cm × 2 cm slabs and the shear modulus is determined by tensile experiments to be 260 kPa. This custom formulation of PDMS provides larger accessible pre-stretch in the mounting layer (up to 250%) without fracture, while maintaining a modulus substantially above that of the substrate and film. The substrate layer is prepared by spin coating degassed Sylgard 184 40:1 (by weight) base : crosslinker mixture onto a polystyrene support at 360 rpm for 120 s. After being cured at 70 °C for 1 h, the substrate layer is bonded to the mounting layer by spin coating an adhesive layer of uncured 40:1 PDMS at 1200 rpm for 120 s and subsequently crosslinking this layer at 70 °C for 8 h prior to releasing pre-stretch in the mounting layer. Combining the pre-cured film with the adhesive layer gives rise to the substrate layer with an initial thickness of ∼200 μm. Then the polystyrene is detached and the PDMS substrate layer is put under uniaxial compression (ε0) by partially releasing pre-stretch. The top film is a Sylgard 184 40:1 PDMS film with a thickness of ∼4 μm by spin coating at 7000 rpm for 120 s. The top film is first partially cured at 70 °C for 15 min and then attached to the pre-compressed substrate; bonding between the layers is achieved by subsequently fully curing the film at 70 °C for 8 h. The lateral dimensions of the sample are at least 50 times as large as the combined thickness of the film and substrate, and thus in the central region of the film (where all measurements are conducted), the stress within each layer should be very nearly uniform along the thickness direction.To measure the viscoelastic properties of our samples, compressive stress relaxation experiments are conducted on Sylgard 184 40:1 PDMS cylinders with 12.5 mm in diameter and 15 mm in height molded in a syringe by fully curing at 70 °C for 8 h. Stress relaxation experiments are performed on an Instron 5800 compression test machine with 50 N loading cell by first loading the cylinder to a compressive strain of 0.45 with a strain rate 0.05 min−1, and then tracking the compressive stress relaxation over 1 h while holding at this strain. Fitting the stress relaxation curve with exponential decay function gives rise to the characteristic viscoelastic time τ = 1100 s.
Optical and confocal microscope imaging
Over the strains of interest (ε = 0.42 − 0.48 for loading and ε = 0.48 − 0.35 for unloading), deformation is performed slowly by applying an incremental changes in strain of ∼0.01 every 30 min, while the formation/disappearance of creases is monitored in situ using an upright optical microscope (Zeiss Axiotech Vario) in bright field reflection mode. Mechanical perturbation is performed with the sample held at a fixed strain by gently poking the surface with a rounded glass micropipette prepared by pulling a heated glass pipette until break and then forging the tip with a torch.For laser scanning confocal microscopy (Zeiss 510 META), the top film is labeled by incorporating a small amount of fluorescent monomer (4.5 μg fluorescein-o-acrylate per 1 g PDMS). The sample surface is immersed in a refractive index matched fluid of 72% by weight glycerol and 28% water.16
Numerical analysis
We use finite-element software (ABAQUS) to simulate snapping creases in a bilayer film-substrate structure subject to uniform external compression with the substrate under pre-strain. Both the film and the substrate are modeled as incompressible neo-Hookean materials. We write a user-defined material subroutine UMAT for the substrate to include the pre-strains in the free energy function. In order to break the translational symmetry, a small defect (10−4 times the total thickness Hf + Hs in size) is prescribed on the surface, and a crease will form on the position of the defect when the critical strain is reached. To minimize the effect of the defect, its size is set much smaller than the thickness of the film. At the same time, to resolve the field close to the defect, the size of the elements close to the defect is made much smaller than the size of the defect. The spacing of the creases is prescribed as 2.5 times the total thickness of the film and substrate, which is similar to the experimental observations. Symmetry is assumed so that only half of a crease is simulated. Riks method based on arclength continuation is used to solve the boundary value problem so that not only the stable solutions, but also the unstable solutions can be captured. After the onset of a crease, the crease tip folds up and forms self-contact. The combination of the Riks method and contact makes the convergence of the simulation hard. A thick layer with extremely low shear modulus (1/100 of the film and substrate shear modulus) is added on the top of the film to prevent self-contact. The top boundary of the extremely compliant layer is constrained to be flat so that instability cannot form there, but can only form on the interface between the film and the extremely compliant layer. As shown in ref. 29, when the modulus of the top layer is much smaller than that of the film and substrate, the result of the interfacial crease asymptotically approaches that of a surface crease. In order to realize the uniaxial compression condition as in the experiment by a 2D simulation, we model an axisymmetric ring under uniaxial compression parallel to the symmetry axis. The radius of the ring has to be much bigger than its thickness so that the curvature of the ring can be neglected. Element type CAX8H is used.Acknowledgements
The work at UMass was supported by NSF grant DMR-1309331 with additional support from the NSF MRSEC at UMass (DMR-0820506). The work at Harvard was supported by the NSF MRSEC (DMR-0820484).Notes and references
- Y.-L. Pi, M. Bradford and B. Uy, Int. J. Solids Struct., 2002, 39, 105 CrossRef.
- S. Krylov, B. R. Ilic, D. Schreiber, S. Seretensky and H. Craighead, J. Micromech. Microeng., 2008, 18, 055026 CrossRef.
- Y. Hu, A. Hiltner and E. Baer, Polym. Compos., 2004, 25, 653 CrossRef CAS.
- N. Bowden, S. Brittain, A. G. Evans, J. W. Hutchinson and G. M. Whitesides, Nature, 1998, 393, 146 CrossRef CAS PubMed.
- C. M. Stafford, C. Harrison, K. L. Beers, A. Karim, E. J. Amis, M. R. Vanlandingham, H.-C. Kim, W. Volksen, R. D. Miller and E. E. Simonyi, Nat. Mater., 2004, 3, 545 CrossRef CAS PubMed.
- D.-Y. Khang, H. Jiang, Y. Huang and J. A. Rogers, Science, 2006, 311, 208 CrossRef CAS PubMed.
- A. Schweikart and A. Fery, Microchim. Acta, 2009, 165, 249 CrossRef CAS.
- C. Lu, H. Möhwald and A. Fery, Soft Matter, 2007, 3, 1530 RSC.
- P. Yang, R. M. Baker, J. H. Henderson and P. T. Mather, Soft Matter, 2013, 9, 4705 RSC.
- S. Chung, J. H. Lee, M. W. Moon, J. Han and R. D. Kamm, Adv. Mater., 2008, 20, 3011 CrossRef CAS.
- H. Lee, C. Xia and N. X. Fang, Soft Matter, 2010, 6, 4342 RSC.
- C. Keplinger, T. Li, R. Baumgartner, Z. Suo and S. Bauer, Soft Matter, 2012, 8, 285 RSC.
- E. Hohlfeld and L. Mahadevan, Phys. Rev. Lett., 2011, 106, 105702 CrossRef.
- V. Trujillo, J. Kim and R. C. Hayward, Soft Matter, 2008, 4, 564 RSC.
- W. Hong, X. Zhao and Z. Suo, Appl. Phys. Lett., 2009, 95, 111901 CrossRef.
- D. Chen, S. Cai, Z. Suo and R. C. Hayward, Phys. Rev. Lett., 2012, 109, 038001 CrossRef.
- J. Kim, J. Yoon and R. C. Hayward, Nat. Mater., 2009, 9, 159 CrossRef PubMed.
- J. Yoon, P. Bian, J. Kim, T. J. McCarthy and R. C. Hayward, Angew. Chem., 2012, 51, 7146 CrossRef CAS PubMed.
- Q. Wang, M. Tahir, J. Zang and X. Zhao, Adv. Mater., 2012, 24, 1947 CrossRef CAS PubMed.
- B. Xu and R. C. Hayward, Adv. Mater., 2013, 25, 5555 CrossRef CAS PubMed.
- K. Saha, J. Kim, E. Irwin, J. Yoon, F. Momin, V. Trujillo, D. V. Schaffer, K. E. Healy and R. C. Hayward, Biophys. J., 2010, 99, L94 CrossRef CAS PubMed.
- E. P. Chan, J. M. Karp and R. S. Langer, J. Polym. Sci., Part B: Polym. Phys., 2011, 49, 40 CrossRef CAS PubMed.
- J. Yoon, J. Kim and R. C. Hayward, Soft Matter, 2010, 6, 5807 RSC.
- M. Guvendiren, J. A. Burdick and S. Yang, Soft Matter, 2010, 6, 5795 RSC.
- A. Ghatak and A. Das, Phys. Rev. Lett., 2007, 99, 076101 CrossRef.
- A. Gent and I. Cho, Rubber Chem. Technol., 1999, 72, 253 CrossRef CAS.
- O. Ortiz, A. Vidyasagar, J. Wang and R. Toomey, Langmuir, 2010, 26, 17489 CrossRef CAS PubMed.
- S. Cai, D. Chen, Z. Suo and R. C. Hayward, Soft Matter, 2012, 8, 1301 RSC.
- E. Riks, J. Appl. Mech., 1972, 39, 1060 CrossRef.
- L. Jin, D. Chen, R. C. Hayward and Z. Suo, Soft Matter, 2013 10.1039/c3sm51512e.
- J. He, G. Xu and Z. Suo, AIP Conf. Proc., 2004, 741, 3 CrossRef CAS.
- A. N. Gent, Langmuir, 1996, 12, 4492 CrossRef CAS.
Footnotes |
| † Electronic supplementary information (ESI) available. See DOI: 10.1039/c3mh00107e |
| ‡ These authors contributed equally to this work. |
| This journal is © The Royal Society of Chemistry 2014 |

