Magnetic ions in wide band gap semiconductor nanocrystals for optimized thermoelectric properties†
Chong
Xiao
a,
Kun
Li
a,
Jiajia
Zhang
b,
Wei
Tong
c,
Youwen
Liu
a,
Zhou
Li
a,
Pengcheng
Huang
a,
Bicai
Pan
b,
Haibin
Su
d and
Yi
Xie
*a
aHefei National Laboratory for Physical Science at Microscale, and Collaborative Innovation Center of Chemistry for Energy Materials, University of Science and Technology of China, Hefei, Anhui 230026, P.R. China. E-mail: yxie@ustc.edu.cn; Fax: +86-551-63606266
bDepartment of Physics, University of Science & Technology of China, Hefei, Anhui 230026, P.R. China
cHigh Magnetic Field Laboratory, Chinese Academy of Sciences, Hefei, Anhui 230031, P.R. China
dDivision of Materials Science, Nanyang Technological University, 50 Nanyang Avenue, 639798, Singapore
First published on 7th October 2013
Abstract
Here we propose a new concept in which incorporated magnetic ions create spin entropy, a narrowed band-gap and stronger anharmonic phonon coupling to obtain a larger Seebeck coefficient, higher electrical conductivity and lower thermal conductivity for significant improvement of the ZT value. This idea is experimentally achieved both with magnetic ion doping and full substitution of quaternary chalcogenide nanocrystals: the ZT value of Ni-doped Cu2ZnSnS4 is extraordinarily enhanced by 7.4 times compared to that of pure Cu2ZnSnS4, while Cu2CoSnS4 shows a 9.2 times improvement.
Over the past few years, thermoelectric materials have attracted considerable attention among physics, chemistry, and materials researchers due to their capability of direct conversion between heat and electricity, and are today well recognized as viable renewable-energy sources.1–4 However, achieving high-performance thermoelectric materials has been a great challenge because it requires the combination of a large Seebeck coefficient, high electrical conductivity, and low thermal conductivity, which are usually interrelated and often follow unfavorable opposing trends.5,6 Therefore, it is still one of the biggest challenges to independently optimize these three parameters to obtain high-performance thermoelectric materials with large ZT values, and so much effort has been devoted to this area over the past few decades.7–14
Recently, as typical wide band-gap semiconductors, novel quaternary chalcogenides, in particular, I2–II–IV–VI4 adamantines have been found to be potential thermoelectric materials, because their distorted chalcopyrite-like structures endow them with low lattice thermal conductivities.15–18 However, because of the wide band-gap, their electrical conductivity is always too low which therefore restrains their ZT values. Although the introduction of dopants enhances the electrical conductivity without increasing the thermal conductivity, the Seebeck coefficient is inevitably reduced at the same time, which still impedes the significant improvement of the ZT value.16,17 Compared to the commonplace dopants used in I2–II–IV–VI4 compounds, magnetic ions, such as transition metal ions with unpaired 3d electrons, seem to be more valuable as dopants for high-performance thermoelectric materials. In fact, one of the most striking features of these magnetic ions is that the degeneracy of the electronic configuration in real space can give rise to extra entropy, leading to the simultaneous enhancement of both the Seebeck coefficient and electrical conductivity, which has been observed in pure and doped cobalt oxides.19–21 This fact encourages us to explore the possibility of using high-performance thermoelectric candidates in wide band-gap semiconductors with magnetic ion components. It is of note that the systematic investigation of the thermoelectric effects of magnetic ions in a wide band-gap semiconductor has been long neglected.
Inspired by the above mentioned advantages, we first synthesized pure and Ni-doped Cu2ZnSnS4 nanocrystals, for which the elements are in extremely high abundance and are of low toxicity. The phase purity and crystal structure of the as-synthesized samples were well characterized by X-ray diffraction (XRD). As shown in Fig. 1f, the XRD patterns of both the pure and Ni-doped samples matched well with the standard tetragonal Cu2ZnSnS4 (space group: I![[4 with combining macron]](https://www.rsc.org/images/entities/char_0034_0304.gif) 2m) with lattice constants a = 5.427 Å and c = 10.848 Å (JCPDS 26-0575). Although no visible difference between the undoped and Ni-doped samples was detected in the XRD patterns, an indication of the Ni ions substituting Zn ions in the lattice was observed in the Raman spectra (Fig. 3f and g). A strong peak at 339 cm−1 and a weak peak at 289 cm−1 for pure Cu2ZnSnS4 nanocrystals were detected, agreeing well with the bulk counterpart.22,23 Compared to the pure Cu2ZnSnS4, the Ni-doped sample showed a red-shift of 4 cm−1, which can be ascribed to the incorporation of Ni2+ ions into the Zn2+ lattice sites. It is noticeable that there are no additional peaks for other phases such as ZnS, SnS, and Cu2S in both the pure and Ni-doped Cu2ZnSnS4 nanocrystals, which confirms the single phase of our samples. X-ray photoelectron spectroscopy (XPS, see Fig. S1, ESI†) measurements give further evidence for the incorporation of doped ions into the host lattice of Cu2ZnSnS4 nanocrystals with a doping concentration of 2.6%. Transmission electron microscopy (TEM, Fig. 1b and e) experiments confirm that our synthetic products consisted of nearly monodisperse nanocrystals for both pure and Ni-doped Cu2ZnSnS4. The HRTEM images (Fig. 1c and f) of one individual nanocrystal indicate the distances between the adjacent lattice fringes to be 3.11 Å and 3.06 Å for pure and Ni-doped nanocrystals respectively, which correspond with the (1 1 2) d-spacing for tetragonal Cu2ZnSnS4, and agree well with the XRD results. In order to further rule out the possible phase segregation in Ni-doped Cu2ZnSnS4 nanocrystals, we refined the XRD patterns using the Rietveld method (Fig. 1) and stochastically selected some nanoparticles for HRTEM and SAED (as seen in Fig. S2, ESI†). All of these results clearly confirmed the high purity and single phase of the obtained nanocrystals.
2m) with lattice constants a = 5.427 Å and c = 10.848 Å (JCPDS 26-0575). Although no visible difference between the undoped and Ni-doped samples was detected in the XRD patterns, an indication of the Ni ions substituting Zn ions in the lattice was observed in the Raman spectra (Fig. 3f and g). A strong peak at 339 cm−1 and a weak peak at 289 cm−1 for pure Cu2ZnSnS4 nanocrystals were detected, agreeing well with the bulk counterpart.22,23 Compared to the pure Cu2ZnSnS4, the Ni-doped sample showed a red-shift of 4 cm−1, which can be ascribed to the incorporation of Ni2+ ions into the Zn2+ lattice sites. It is noticeable that there are no additional peaks for other phases such as ZnS, SnS, and Cu2S in both the pure and Ni-doped Cu2ZnSnS4 nanocrystals, which confirms the single phase of our samples. X-ray photoelectron spectroscopy (XPS, see Fig. S1, ESI†) measurements give further evidence for the incorporation of doped ions into the host lattice of Cu2ZnSnS4 nanocrystals with a doping concentration of 2.6%. Transmission electron microscopy (TEM, Fig. 1b and e) experiments confirm that our synthetic products consisted of nearly monodisperse nanocrystals for both pure and Ni-doped Cu2ZnSnS4. The HRTEM images (Fig. 1c and f) of one individual nanocrystal indicate the distances between the adjacent lattice fringes to be 3.11 Å and 3.06 Å for pure and Ni-doped nanocrystals respectively, which correspond with the (1 1 2) d-spacing for tetragonal Cu2ZnSnS4, and agree well with the XRD results. In order to further rule out the possible phase segregation in Ni-doped Cu2ZnSnS4 nanocrystals, we refined the XRD patterns using the Rietveld method (Fig. 1) and stochastically selected some nanoparticles for HRTEM and SAED (as seen in Fig. S2, ESI†). All of these results clearly confirmed the high purity and single phase of the obtained nanocrystals.
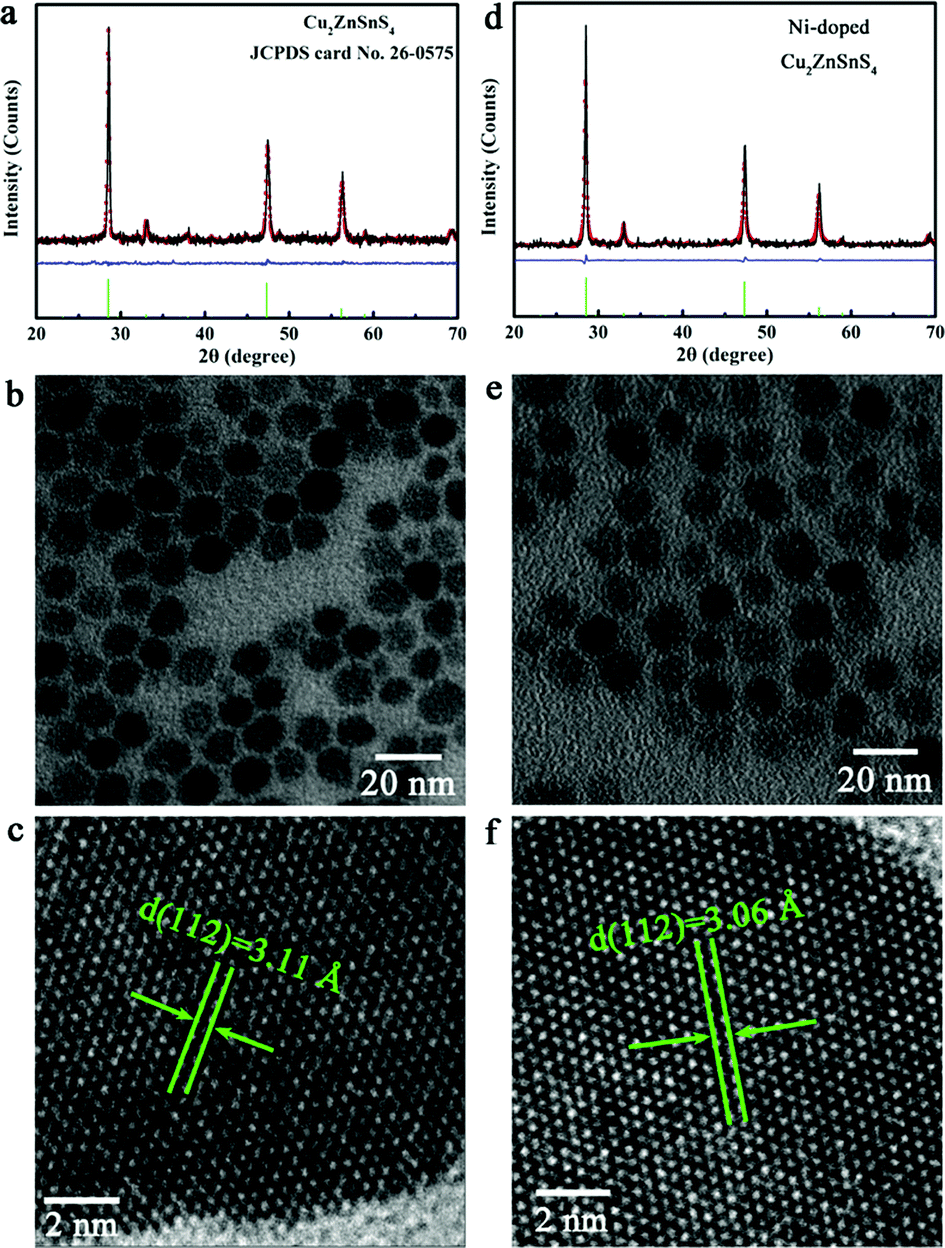 | ||
| Fig. 1 Characterization of as-obtained pure and Ni-doped Cu2ZnSnS4 nanocrystals. (a) XRD and refined XRD patterns, (b) TEM image and (c) HRTEM image of pure Cu2ZnSnS4 nanocrystals. (d) XRD and refined XRD patterns, (e) TEM image and (f) HRTEM image of Ni-doped Cu2ZnSnS4 nanocrystals. | ||
The temperature dependence of the thermoelectric properties for pure and Ni-doped Cu2ZnSnS4 nanocrystals were measured and are shown in Fig. 2. As shown in Fig. 2a, the positive Seebeck coefficients indicate the p-type electrical transport behavior in both pure and Ni-doped Cu2ZnSnS4 nanocrystals. The Seebeck coefficient for pure Cu2ZnSnS4 nanocrystals is 223 μV K−1 at room temperature, and slightly increases to 250 μV K−1 at 700 K, which is similar to a previous report of this temperature dependent trend.24 For the Ni-doped Cu2ZnSnS4 nanocrystals, the Seebeck coefficient quickly increases from 213 μV K−1 to 281 μV K−1 as the temperature increases to 700 K, showing a 12.4% enhancement compared to pure Cu2ZnSnS4 nanocrystals at the same temperature. This remarkably enhanced Seebeck coefficient should mainly be ascribed to the introduction of spin entropy by the Ni2+ ions in the lattice, substituting the Zn2+ ions. The contribution of the spin entropy has been long neglected while only a few previous reports have vividly exemplified its importance in the enhancement of thermopower in Co oxides.19–21 In our case, because the Zn2+ ions are partly substituted by Ni2+ ions, more free spin should be introduced into the system, which is confirmed by electron paramagnetic resonance (EPR) experiments. The temperature-dependent EPR spectra of as-prepared samples from 300 to 590 K are shown by curves in Fig. 3a and b. It is clearly shown that a strong single symmetric line at g = 1.996 and a six-line hyperfine spectrum splitting with an Aiso constant of 68 G are observed, which can be attributed to the surface defects and Zn nuclear spins (67Zn, I = 5/2) respectively.25–27 Meanwhile for the Ni-doped Cu2ZnSnS4 nanocrystals, two new different lines at g = 2.23 and g = 2.06 are observed, which are attributed to the Ni2+ electron spin. Most important is that the EPR line of Ni2+ becomes stronger as the temperature is increased to 570 K, which indicates the stronger entropy current derived from the electron spin of Ni2+, which results in the quickly enhanced thermopower in the Ni-doped Cu2ZnSnS4 nanocrystals.
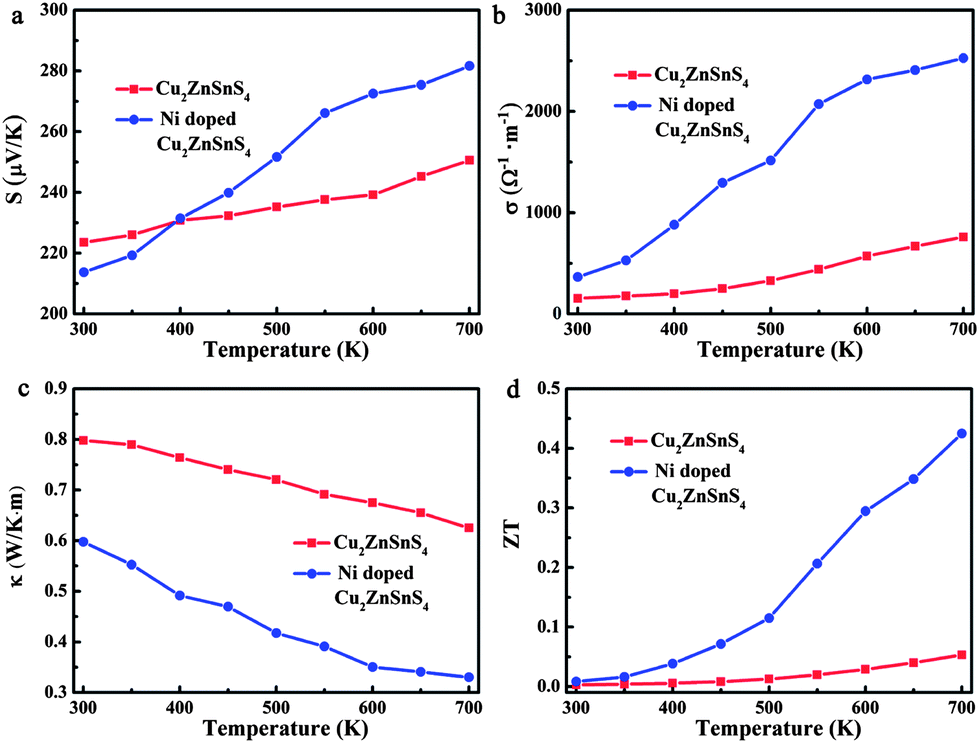 | ||
| Fig. 2 Thermoelectric properties of pure and Ni-doped Cu2ZnSnS4 nanocrystals. Temperature dependencies of (a) the Seebeck coefficient S, (b) electrical conductivity σ, (c) thermal conductivity κ, and (d) dimensionless figure-of-merit ZT. | ||
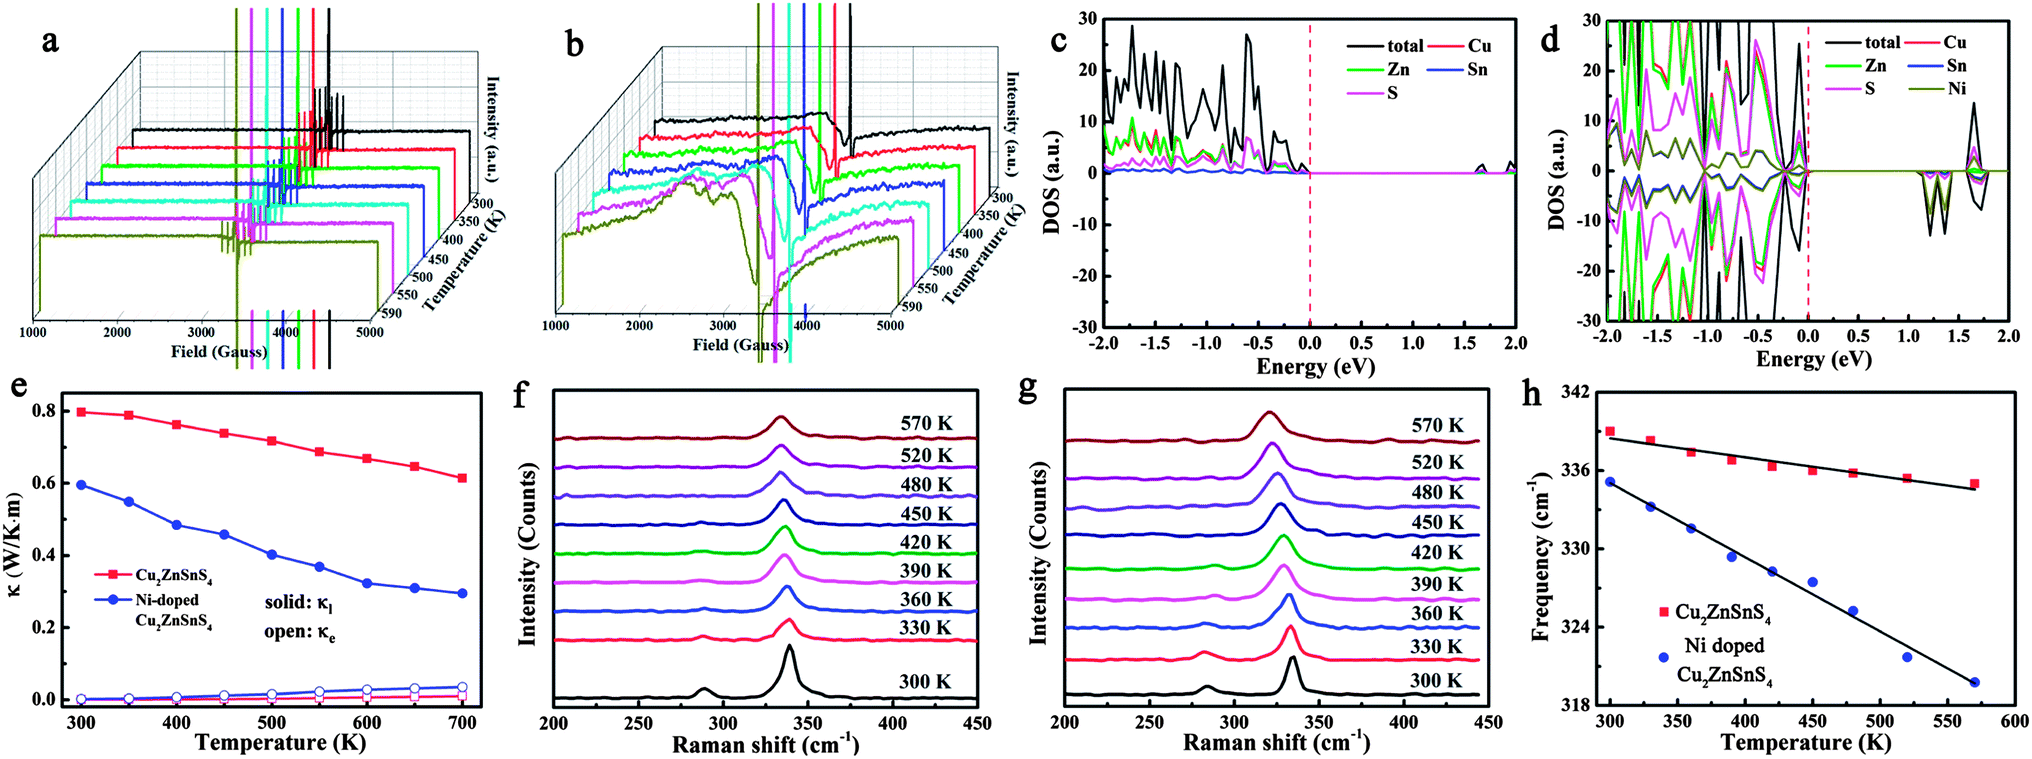 | ||
| Fig. 3 Comparison of pure and Ni-doped Cu2ZnSnS4 nanocrystals. Temperature-dependent ESR spectra for pure (a) and Ni-doped (b) Cu2ZnSnS4 nanocrystals. In pure Cu2ZnSnS4 nanocrystals only a strong single symmetric line and a six-line hyperfine spectrum splitting are observed, while in Ni-doped nanocrystals, the signal of the Ni2+ electron spin appears at room temperature, and then increases with increasing temperature. The calculated DOSs of the pure (c) and Ni-doped (d) Cu2ZnSnS4. (e) Electronic and lattice contributions to the thermal conductivity both for pure and Ni-doped Cu2ZnSnS4 nanocrystals. Temperature-dependent Raman spectra for (f) pure and (g) Ni-doped Cu2ZnSnS4 nanocrystals. (h) The A1 phonon frequency variation as a function of temperature both for pure and Ni-doped Cu2ZnSnS4 nanocrystals. | ||
Fig. 2b shows the temperature-dependent electrical conductivity of pure and Ni-doped Cu2ZnSnS4 nanocrystals. Remarkably, Ni doping results in a dramatic increase of the electrical conductivity for Cu2ZnSnS4 nanocrystals, reaching 2525 Ω−1 m−1 at 700 K, which is 3.3 times higher than that of the pure sample (759 Ω−1 m−1 at 700 K). It is well known that the chalcopyrite-like quaternary chalcogenides are a class of wide band-gap semiconductors with low intrinsic electrical conductivity, which limits their practical application as thermoelectric materials. In this study, because of the incorporation of Ni2+ ions, the band-gap is narrowed from 1.52 eV to 1.0 eV. As shown in Fig. 3c and Fig. S3 in the ESI,† for pure Cu2ZnSnS4, the valence band (VB) is mainly made up of the antibonding component of the hybridization between Cu/Zn 3d states and S 3p states, while an antibonding state formed by hybridisation of Sn 5s states and S 3p states makes up the conduction band (CB).28 As a result, pure Cu2ZnSnS4 shows a wider band-gap of 1.52 eV compared to those conventional narrow band-gap thermoelectric materials, such as Bi2Te3. As Ni2+ ions are incorporated into the lattice, the Ni 3d states are hybridised with the S 3p states, which results in the narrowing of the band-gap by 0.5 eV (Fig. 3d and Fig. S4, ESI†), which means the excitation of the carriers from the valence band to the conduction band becomes easier as the temperature increases in the doped Cu2ZnSnS4 nanocrystals, resulting in the increase of their conductivity with temperature.
In addition to having favorable electrical transport properties, a good thermoelectric material must also have low thermal conductivity (κ). Fig. 2c displays the temperature-dependent thermal conductivity. It is well known that kesterite-type compounds have a diamond-like tetrahedral framework structure with low phonon conductivity, which is similar to that in chalcopyrites. As expected, the total thermal conductivities of both pure and Ni-doped Cu2ZnSnS4 nanocrystals are very low, much less than those of the well-known thermoelectric materials. Obviously, Ni doping further lowers κ significantly: the thermal conductivity of the Ni-doped Cu2ZnSnS4 nanocrystals remains low between 300 and 700 K and reaches a minimum of 0.33 W m−1 K−1 at 700 K, which corresponds to a 46.8% decrease compared to the pure Cu2ZnSnS4 nanocrystal samples (0.62 W m−1 K−1 at 700 K). According to the Wiedemann–Franz law,29 the electron and lattice contribution to the total thermal conductivity can be calculated and is shown in Fig. 3e. It is clear that the much lowered total thermal conductivity in Ni-doped Cu2ZnSnS4 nanocrystals should be due to the lowered lattice thermal conductivity. As is well known, the strong anharmonicity of the bonding arrangement usually results in phonon–phonon umklapp and normal processes, which result in the intrinsic low lattice thermal conductivity.30 When the Ni2+ is incorporated into the lattice and substitutes the Zn2+ ions, the anharmonicity should be strengthened. As seen in Fig. 3f and g, a red-shift of 4 cm−1 in the Raman spectrum at room temperature clearly reflects the strengthened anharmonicity in Ni-doped Cu2ZnSnS4 nanocrystals.28 In fact, for the kesterite-type materials, group analysis demonstrates that the strong peak located at 339 cm−1 corresponds to the A1 phonon mode,28 a pure anion mode, which corresponds to the vibration of S atoms surrounded by motionless neighboring atoms. When the Ni2+ ions are incorporated into the lattice, the stronger interaction of Ni–S will cause the anharmonic coupling of phonons to other phonons, and as a result, lower thermal conductivity is observed in Ni-doped Cu2ZnSnS4 nanocrystals. More importantly, as seen in Fig. 3h, the A1 phonon frequency further shifts toward the lower energy side as the temperature increases, which implies that the thermal conductivity should be further lowered because of the further strengthened anharmonicity. On the other hand, a large density of interfaces introduced by the nanocrystal grain boundary in the hot pressed disks should scatter the long-wavelength phonons effectively, which also contribute to the low thermal conductivity. As a result, the ultra low thermal conductivity was obtained in the Ni-doped Cu2ZnSnS4 nanocrystals.
According to the measured Seebeck coefficient, electrical and thermal conductivity, the ZT values were calculated and are plotted as a function of temperature in Fig. 2d. The ZT value of Ni-doped Cu2ZnSnS4 increases obviously with temperature and reaches the maximum value of 0.42 at 700 K, representing an improvement of 7.4 times compared to that of the pure Cu2ZnSnS4 nanocrystals (ZT = 0.05 at 700 K). This value is higher than that of the reported Cu self-doped Cu2ZnSnS4 system, for both the bulk23 and nanocrystals,17 at the same temperature. The increasing ZT value with increasing temperature also implies that the magnetic ion doped quaternary chalcogenides may exhibit even higher ZT values at higher temperatures. It is equally important that compared to the pure Cu2ZnSnS4 sample, the more quickly increasing ZT value of the Ni-doped Cu2ZnSnS4 nanocrystals also implies that the incorporation of magnetic ions decouples the strongly interrelated three thermoelectric parameters.
In order to verify the universality of the magnetic ion decoupling of the strongly interrelated three thermoelectric parameters, we also extensively investigated the effect of wide band gap semiconductor nanocrystals fully substituted with magnetic ions. As Cu2NiSnS4 crystallizes in a cubic form (space group: F3m), different to the tetragonal Cu2ZnSnS4 (space group: I2m), other Cu2XSnS4 (X = Mn, Fe, Co) compounds with the same space group were used as examples. The structures and morphologies of the as-prepared Cu2XSnS4 nanocrystals were fully characterized by XRD, TEM, and HRTEM measurements. The XRD patterns (Fig. 4a, d and g) of Cu2XSnS4 nanocrystals match well with the standard tetragonal Cu2MnSnS4 with lattice constants a = 5.514 Å and c = 10.826 Å (JCPDS 51-0757), Cu2FeSnS4 with lattice constants a = 5.450 Å and c = 10.739 Å (JCPDS 44-1476) and Cu2CoSnS4 with lattice constants a = 5.402 Å and c = 10.805 Å (JCPDS 26-0513). Direct experimental information on the composition and the purity of the products was also obtained using XPS (Fig. S5 in ESI†), which verified the high purity of these samples. Low-magnification TEM studies (Fig. 4b, e and h) show that all the as-prepared Cu2XSnS4 nanocrystals are nearly monodisperse, which is similar to pure and Ni-doped Cu2ZnSnS4 nanocrystals. The HRTEM images (Fig. 4c, f and I) of one individual nanocrystal indicate that the distances between the adjacent lattice fringes are 3.15 Å, 3.13 Å and 3.15 Å for the Cu2MnSnS4, Cu2FeSnS4 and Cu2CoSnS4 nanocrystals, respectively, which correspond to the (1 1 2) d-spacing and agree well with the XRD results.
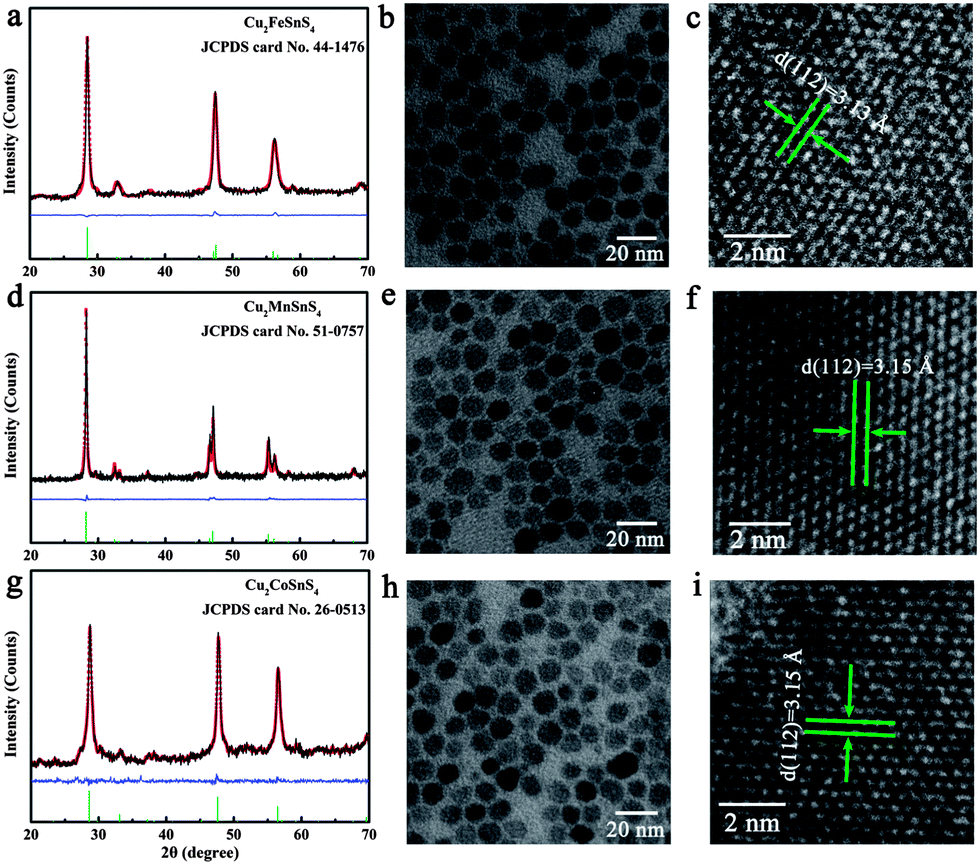 | ||
| Fig. 4 Characterization of as-obtained Cu2XSnS4 nanocrystals. (a) XRD and refined XRD patterns, (b) TEM image and (c) HRTEM image of Cu2FeSnS4 nanocrystals. (d) XRD and refined XRD patterns, (e) TEM image and (f) HRTEM image of Cu2MnSnS4 nanocrystals. (g) XRD and refined XRD patterns, (h) TEM image and (i) HRTEM image of Cu2CoSnS4 nanocrystals. | ||
Fig. 5h shows the calculated ZT values of the Cu2XSnS4 nanocrystals. It is obvious that all Cu2XSnS4 nanocrystals show more superior thermoelectric properties than pure Cu2ZnSnS4 nanocrystals, which should be a benefit of the simultaneously increased Seebeck coefficient and electrical conductivity, and lowered thermal conductivity resulting from the presence of magnetic ions. The Cu2CoSnS4 nanocrystals show the largest ZT value of 0.51 at 700 K among these three samples, and represent a 9.2 times improvement over the Cu2ZnSnS4 nanocrystals (ZT = 0.05 at 700 K).
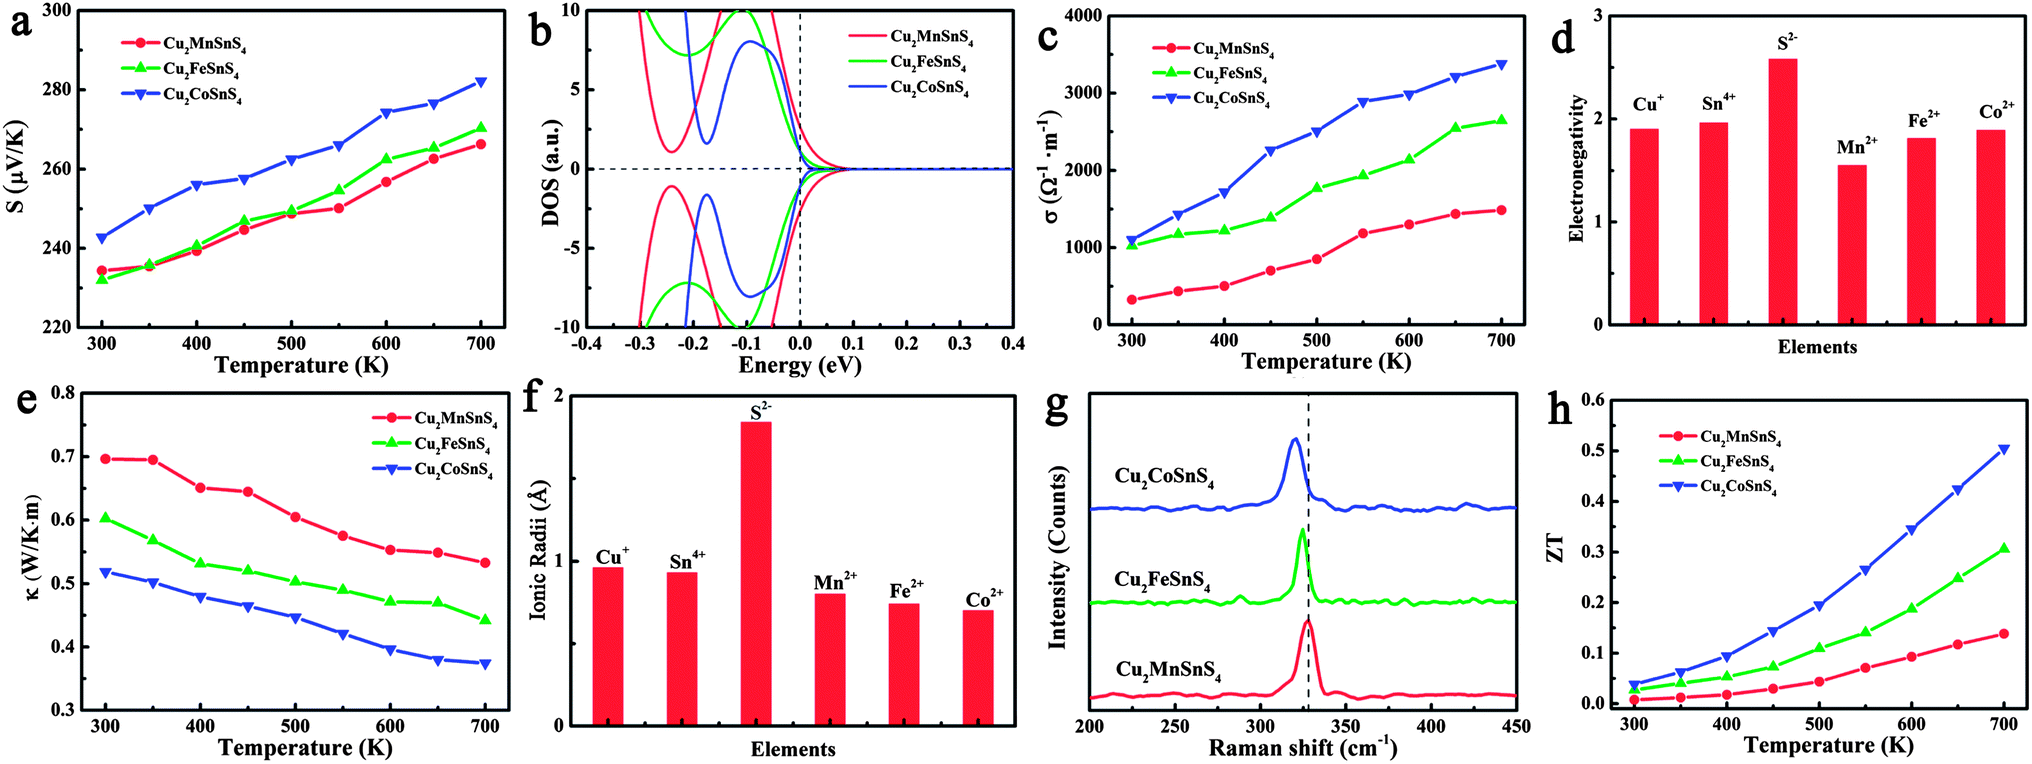 | ||
| Fig. 5 Thermoelectric properties of Cu2XSnS4 (X = Mn, Fe, Co) nanocrystals. (a) Temperature-dependence of the Seebeck coefficient, (b) the calculated density of states near the Fermi level, (c) temperature-dependence of the electrical conductivity, (d) Pauling electronegativity for the constituent elements, (e) temperature-dependence of the thermal conductivity, (f) ionic radii for the constituent elements, (g) Raman spectra, and (h) figure of merit for the Cu2XSnS4 (X = Mn, Fe, or Co) nanocrystals. | ||
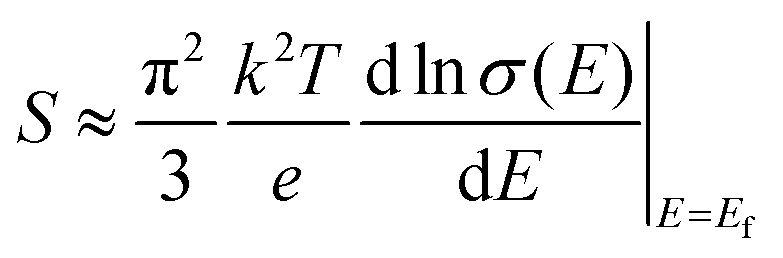
It is well known that the trade-off between the Seebeck coefficient and the electrical conductivity plays an important role in superior thermoelectric materials.31Fig. 5a shows the measured Seebeck coefficients of the as-prepared quaternary Cu2XSnS4 (X = Mn, Fe, Co) nanocrystals fully substituted with magnetic ions. It is obvious that the positive Seebeck coefficients indicate that all the samples exhibit p-type semiconductor behaviour, among which the Cu2CoSnS4 nanocrystals show the largest Seebeck coefficient. According to the Mott formula (eqn (1)), the Seebeck coefficient is proportional to the logarithmic derivative of σ(E) with respect to E near the Fermi level.32 In other words, the larger slope near the Fermi level reflects the larger Seebeck coefficient.
 | (1) |
As previously mentioned, the valence band (VB) of Cu2ZnSnS4 is mainly made up of the antibonding component of the hybridization between Cu 3d states and S 3p states.27 In the case of quaternary nanocrystals fully substituted by magnetic ions, because of the presence of unpaired 3d transition metal ions, more sophisticated band structure character should be considered. In fact, the 3d orbital splits into three degenerate t2 orbitals and two degenerate e orbitals in the tetrahedral field. When the 3d electrons fill these split orbitals, the crystal field stabilization energy (CFSE), which is the stability resulting from placing a transition metal ion in the crystal field generated by a set of ligands, of Co2+ is the largest ((6/5)Δt), compared with that of either Fe2+ ((3/5)Δt) or Mn2+ (0), implying the strongest interaction of Co2+ ions with the surrounding S2− ions. This result indicates that the Cu2CoSnS4 should have a different valence band structure, which means that a different Seebeck coefficient should be obtained for the Cu2CoSnS4 nanocrystals. Fig. 5b visually shows the calculated DOS of these three compounds, in which the Cu2CoSnS4 shows the most rapidly changing DOS near the Fermi level and is expected to have a larger thermopower than Cu2FeSnS4 and Cu2MnSnS4.
The temperature-dependent electrical conductivity of the Cu2XSnS4 nanocrystals (Fig. 5c) clearly shows that the electrical conductivity increases from Cu2MnSnS4 to Cu2FeSnS4 and then to Cu2CoSnS4, which reaches the highest value of 3380 Ω−1 m−1 at 700 K. It is well known that a larger electronegativity difference among the constituent elements leads to more ionic bonding, a stronger tendency for carrier localization, and a stronger scattering of carriers by optical phonons, which all result in a lower electrical conductivity. Taking into account the electronegativity of Mn2+, Fe2+, and Co2+, shown in Fig. 5d, since Co2+ has the lowest electronegativity difference compared to other constituent elements in the quaternary nanocrystals, it is inevitable that Cu2CoSnS4 show the highest electrical conductivity.
The temperature-dependent thermal conductivity results (Fig. 5e) indicate that the Cu2CoSnS4 obviously shows the lowest thermal conductivity among the Cu2XSnS4 nanocrystals. According to the Wiedemann–Franz law, the thermal conductivity (κ) is the sum of two independent components, a lattice contribution κl and an electronic contribution κe equal to LσT, where L is the Lorenz number. The electronic and lattice thermal conductivity were also calculated and are shown in Fig. S6 in the ESI.† As seen in Fig. S6,† although the Cu2CoSnS4 nanocrystals show the larger electrical conductivity, the electronic contributions to the thermal conductivity are still very low and can be omitted. So, it could reasonably be concluded that the lower thermal conductivity should come from the lowered lattice thermal conductivity. It is well known that the strong anharmonicity of the bonding arrangement usually brings phonon–phonon umklapp and normal processes, which results in the intrinsic low lattice thermal conductivity. On the basis of the ionic radii of Mn2+, Fe2+, and Co2+, Co2+ shows the biggest difference compared to Cu+, Sn4+, and S2− (Fig. 5f) implying the largest lattice distortion in Cu2CoSnS4 and resulting in the strongest anharmonicity, which is confirmed by the Raman result (Fig. 5g): the A1 phonon frequency shifts toward the lower energy side from Cu2MnSnS4 to Cu2FeSnS4 and then to Cu2CoSnS4, which implies that the thermal conductivity should be further lowered because of the further strengthened anharmonicity. On the other hand, ionic mass should be responsible for the lattice thermal conductivity. Usually, heavy atoms give rise to a lower acoustic phonon frequency, which leads to a higher lattice thermal resistance.33–35 Moreover, the ionic mass difference also contributes to the lattice thermal conductivity.36–38 In our study, the magnetic ions are located at the centres of the sulfur tetrahedra, and therefore the largest ionic mass difference between Co2+ and S2− should also contribute to the lowest lattice thermal conductivity.
Conclusions
In summary, here we demonstrate a new concept of decoupled optimization of the thermoelectric parameters, i.e. Seebeck coefficient, electrical and thermal conductivity, through magnetic ion doping or full substitution in wide band-gap semiconductors. The insights gained from the experimental results and theoretical calculations in this study indicate that magnetic ions can create spin entropy and narrow band-gaps, and strengthen anharmonic phonons, which results in the coexistence of a large Seebeck coefficient, high electrical conductivity and low thermal conductivity in one compound. This idea is experimentally achieved in quaternary chalcogenide nanocrystals: as examples, the ZT value of the Ni2+ magnetic ion doped Cu2ZnSnS4 nanocrystal is extraordinarily enhanced by 7.4 times compared to that of pure Cu2ZnSnS4 nanocrystals, while the fully Co2+ substituted Cu2CoSnS4 nanocrystal shows a 9.2 times improvement in the ZT value. Furthermore, we have systematically investigated the effect of magnetic ions on the thermoelectric properties in the fully substituted wide band-gap semiconductors: our results clearly indicate that the further enhanced ZT value could be achieved in a compound containing magnetic ions with a larger crystal field stabilization energy, smaller electronegativity difference and larger ionic radii difference of the constituent elements. Considering the large number and varied types of wide band-gap semiconductors, it is reasonable to believe that a higher ZT value can be expected due to the separate optimization of the thermoelectric parameters in systems with carefully selected parent compounds and magnetic ions. In this sense, this current study opens a new cost-effective and nontoxic means to design and broaden the prospective thermoelectric materials.Acknowledgements
This work is financially supported by the National Basic Research Program of China (2009CB939901), the Chinese Academy of Sciences (XDB01020300), the National Natural Science Foundation of China (11079004), the Fundamental Research Funds for the Central University (WK 2060190020), and an A*STAR SERC grant in Singapore (no. 1121202012).Notes and references
- C. Wood, Rep. Prog. Phys., 1988, 51, 459–539 CrossRef CAS.
- L. E. Bell, Science, 2008, 321, 1457–1461 CrossRef CAS PubMed.
- T. M. Tritt, Annu. Rev. Mater. Res., 2011, 41, 433–448 CrossRef CAS.
- T. M. Tritt and M. A. Subramanian, MRS Bull., 2006, 31, 188–198 CrossRef.
- G. J. Snyder and E. S. Toberer, Nat. Mater., 2008, 7, 105–114 CrossRef CAS PubMed.
- J. R. Sootsman, D. Y. Chung and M. G. Kanatzidis, Angew. Chem., Int. Ed., 2009, 48, 8616–8639 CrossRef CAS PubMed.
- K. Biswas, J. Q. He, I. D. Blum, C. I. Wu, T. P. Hogan, D. N. Seidman, V. P. Dravid and M. G. Kanatzidis, Nature., 2012, 489, 414–418 CrossRef CAS PubMed.
- R. J. Mehta, Y. L. Zhang, C. Karthik, B. Singh, R. W. Siegel, T. Borac-Tasciuc and G. Ramanath, Nat. Mater., 2012, 11, 233–240 CrossRef CAS PubMed.
- H. L. Liu, X. Shi, F. F. Xu, L. L. Zhang, W. Q. Zhang, L. D. Chen, Q. Li, C. Uher, T. Day and G. J. Snyder, Nat. Mater., 2012, 11, 422–425 CrossRef CAS PubMed.
- K. Biswas, J. Q. He, Q. C. Zhang, G. Y. Wang, C. Uher, V. P. Dravid and M. G. Kanatzidis, Nat. Chem., 2011, 3, 160–166 CrossRef CAS PubMed.
- C. Xiao, J. Xu, K. Li, J. Feng, J. L. Yang and Y. Xie, J. Am. Chem. Soc., 2012, 134, 4287–4293 CrossRef CAS PubMed.
- C. Xiao, J. Xu, B. X. Cao, K. Li, M. G. Kong and Y. Xie, J. Am. Chem. Soc., 2012, 134, 7971–7977 CrossRef CAS PubMed.
- C. Xiao, X. M. Qin, J. Zhang, R. An, J. Xu, K. Li, B. X. Cao, J. L. Yang, B. J. Ye and Y. Xie, J. Am. Chem. Soc., 2012, 134, 18460–18466 CrossRef CAS PubMed.
- M. S. Dresselhaus, G. Chen, M. Y. Tang, R. G. Yang, H. Lee, D. Z. Wang, Z. F. Ren, J. P. Fleurial and P. Gogna, Adv. Mater., 2007, 19, 1043–1053 CrossRef CAS.
- W. G. Zeier, Y. Z. Pei, G. S. Pomrehn, T. Day, N. Heinz, C. P. Heinrich, G. J. Snyder and W. Tremel, J. Am. Chem. Soc., 2013, 135, 726–732 CrossRef CAS PubMed.
- M. L. Liu, I. W. Chen, F. Q. Huang and L. D. Chen, Adv. Mater., 2009, 21, 3808–3812 CrossRef CAS.
- H. R. Yang, L. A. Jauregui, G. Q. Zhang, Y. P. Chen and Y. Wu, Nano Lett., 2012, 12, 540–545 CrossRef CAS PubMed.
- M. Ibáñez, R. Zamani, A. LaLonde, D. Cadavid, W. H. Li, A. Shavel, J. Arbiol, J. R. Morante, S. Gorsse, G. J. Snyder and A. Cabot, J. Am. Chem. Soc., 2012, 134, 4060–4063 CrossRef PubMed.
- Y. Y. Wang, N. S. Rogado, R. J. Cava and N. P. Ong, Nature, 2003, 423, 425–428 CrossRef CAS PubMed.
- P. Limelette, S. Hebert, V. Hardy, R. Fresard, C. Simon and A. Maignan, Phys. Rev. Lett., 2006, 97, 046601 CrossRef CAS.
- G. D. Tang, T. Yang, X. N. Xu, C. P. Tang, L. Qiu, Z. D. Zhang, L. Y. Lv, Z. H. Wang and Y. W. Du, Appl. Phys. Lett., 2010, 97, 032108 CrossRef.
- M. Himmrich and H. Haeuseler, Spectrochim. Acta, Part A, 1991, 47, 933–943 CrossRef.
- L. Shi, C. J. Pei, Y. M. Xu and Q. Li, J. Am. Chem. Soc., 2011, 133, 10328–10331 CrossRef CAS PubMed.
- M. L. Liu, F. Q. Huang, L. D. Chen and I. W. Chen, Appl. Phys. Lett., 2009, 94, 202103 CrossRef.
- H. Kaftelen, K. Ocakoglu, R. Thomann, S. Y. Tu, S. Weber and E. Erdem, Phys. Rev. B: Condens. Matter Mater. Phys., 2012, 86, 014113 CrossRef.
- N. E. Holden, Table of the Isotopes, in CRC Handbook of Chemistry and Physics, CRC Press, Boca Raton, FL, 86th edn, 2005 Search PubMed.
- K. M. Whitaker, S. T. Ochesenbein, A. L. Smith, D. C. Echodu, B. H. Robinson and D. R. Gamelin, J. Phys. Chem. C, 2010, 114, 14467–14472 CAS.
- W. W. Li, K. Jiang, J. Z. Zhang, X. G. Chen, Z. G. Hu, S. Y. Chen, L. Sun and J. H. Chu, Phys. Chem. Chem. Phys., 2012, 14, 9936–9941 RSC.
- V. I. Fitsul, Heavily Doped Semiconductors, Plenum Press, New York, 1969 Search PubMed.
- D. T. Morelli, V. Jovovic and J. P. Heremans, Phys. Rev. Lett., 2008, 101, 035901 CrossRef CAS.
- A. Shakouri, Annu. Rev. Mater. Res., 2011, 41, 399–431 CrossRef CAS.
- J. R. Szczech, J. M. Higgins and S. Jin, J. Mater. Chem., 2011, 21, 4037–4055 RSC.
- G. Zhang, W. Wang and X. Li, Adv. Mater., 2008, 20, 3654–3656 CrossRef CAS.
- M. Zhou, J.-F. Li and T. Kita, J. Am. Chem. Soc., 2008, 130, 4527–4532 CrossRef CAS PubMed.
- C. Z. Wu, F. Feng, J. Feng, J. Dai, L. L. Peng, J. Y. Zhao, J. L. Yang, C. Si, Z. Y. Wu and Y. Xie, J. Am. Chem. Soc., 2011, 133, 13798–13801 CrossRef CAS PubMed.
- J. Callaway, Phys. Rev., 1959, 113, 1046–1051 CrossRef CAS.
- L. D. Zhao, J. Q. He, C. I. Wu, T. P. Hogan, X. Y. Zhou, C. Uher, V. P. Dravid and M. G. Kanatzidis, J. Am. Chem. Soc., 2012, 134, 7902–7912 CrossRef CAS PubMed.
- Y. S. Zhang, E. Skoug, J. Cain, V. Ozolin, D. Morelle and C. Wolverton, Phys. Rev. B: Condens. Matter Mater. Phys., 2012, 85, 054306 CrossRef.
Footnote |
| † Electronic supplementary information (ESI) available. See DOI: 10.1039/c3mh00091e |
| This journal is © The Royal Society of Chemistry 2014 |