Formation and processability of liquid crystalline dispersions of graphene oxide†
Rouhollah
Jalili‡
a,
Seyed Hamed
Aboutalebi‡
b,
Dorna
Esrafilzadeh
a,
Konstantin
Konstantinov
b,
Joselito M.
Razal
a,
Simon E.
Moulton
a and
Gordon G.
Wallace
*a
aIntelligent Polymer Research Institute, ARC Centre of Excellence for Electromaterials Science, Australia. E-mail: gwallace@uow.edu.au
bInstitute for Superconducting and Electronic Materials, University of Wollongong, AIIM Facility, Innovation Campus, North Wollongong, NSW 2522, Australia
First published on 10th September 2013
Abstract
Rational control over the formation and processability, and consequently final properties of graphene oxide liquid crystalline dispersions has been a long-standing goal in the development of bottom-up device fabrication processes. Here we report, the principal conditions through which such levels of control can be exercised to fine-tune dispersion properties for further processing.
Amongst the many remarkable properties of graphene oxide (GO),1 the formation of liquid crystals has recently drawn attention.2–7 The amphiphilicity of GO and the self-assembly properties,3,8–12 more pronounced in the case of ultra-large GO sheets,2,3,10–14 have been utilized to prepare liquid crystalline (LC) dispersions of GO in both water2,7,13 and organic solvents.3 The use of LC GO dispersions for fabrication enables formation of novel self-assembled 3D architectures.3,10,13 Moreover, the use of large GO sheets has enabled the use of a wet-spinning route to produce ultra-strong and electrically conducting graphene fibres.2,3,5,15 However, the ultimate properties of these architectures are critically linked to the initial LC GO dispersion quality and hence necessitate a fundamental understanding in order to facilitate the appropriate processes encountered during fabrication. Therefore, establishing principal guidelines that enable rational control over the formation of a lyotropic liquid crystalline state in GO dispersions to reproducibly engineer LC GO would greatly advance bottom-up soft material self-assembly nanoscience.
The present communication addresses key fundamental issues regarding the formation of LC GO dispersions and their processability. This understanding helped us to fine-tune GO sheet sizes from small to ultra-large, covering more than one order of magnitude in aspect ratio (approximately between 1900 and 46![[thin space (1/6-em)]](https://www.rsc.org/images/entities/char_2009.gif) 000), while still maintaining the liquid crystallinity. We introduce a classical model to explain the underlying nematic phase formation mechanism by means of entropic driven configuration of charged platelets to describe the observed phenomena. We also recognise the profound complications of the underlying forces involved and attempt to provide sound explanations on how the physical properties of GO can be manipulated in designing self-assembled formulations for ordered multifunctional architectures through fibre wet-spinning.
000), while still maintaining the liquid crystallinity. We introduce a classical model to explain the underlying nematic phase formation mechanism by means of entropic driven configuration of charged platelets to describe the observed phenomena. We also recognise the profound complications of the underlying forces involved and attempt to provide sound explanations on how the physical properties of GO can be manipulated in designing self-assembled formulations for ordered multifunctional architectures through fibre wet-spinning.
The drive to understand self-assembly processes resulting in the formation of LC GO phases is critical for in situ fabrication of complex GO architectures. The structure and properties of GO are strongly dependent on interactions between the sheets. Steric hindrance resulting from the repulsive steric interactions among GO sheets can potentially result in configurational, entropy driven excluded-volume effects.2 Excluded volume effects play an important role in the stability of colloidal suspensions.
Solvated GO sheets (i.e. by water or by organic solvents) exhibit a highly charged surface profile which can only approach each other to a defined separation distance. The fundamental insight provided by Onsager's theoretical predictions is that nematic LC formation is entropy-driven.16 The isotropic–nematic transition originates from a competition between two types of entropy, namely orientational entropy and positional entropy. The excluded volume effect is perceived to be large at both low sheet concentration and small sheet aspect ratio (due to the repulsion between neighbouring sheets that are at some angles to one another). In these cases, the orientational entropy dominates and is maximised by the isotropic distribution of the GO sheets. However, above the critical LC concentration, predicted in our previous report,15 or for ultra-high sheet aspect ratio, the GO sheets orientate parallel to each other in order to minimise the volume excluded from the center-of-mass of the approaching sheet, thus maximizing the packing entropy and favoring nematic ordering (Fig. 1). Therefore, although the parallel arrangement of anisotropic sheets leads to a decrease in orientational entropy, it is the increase in positional entropy that governs the formation of nematic LC GO dispersions.
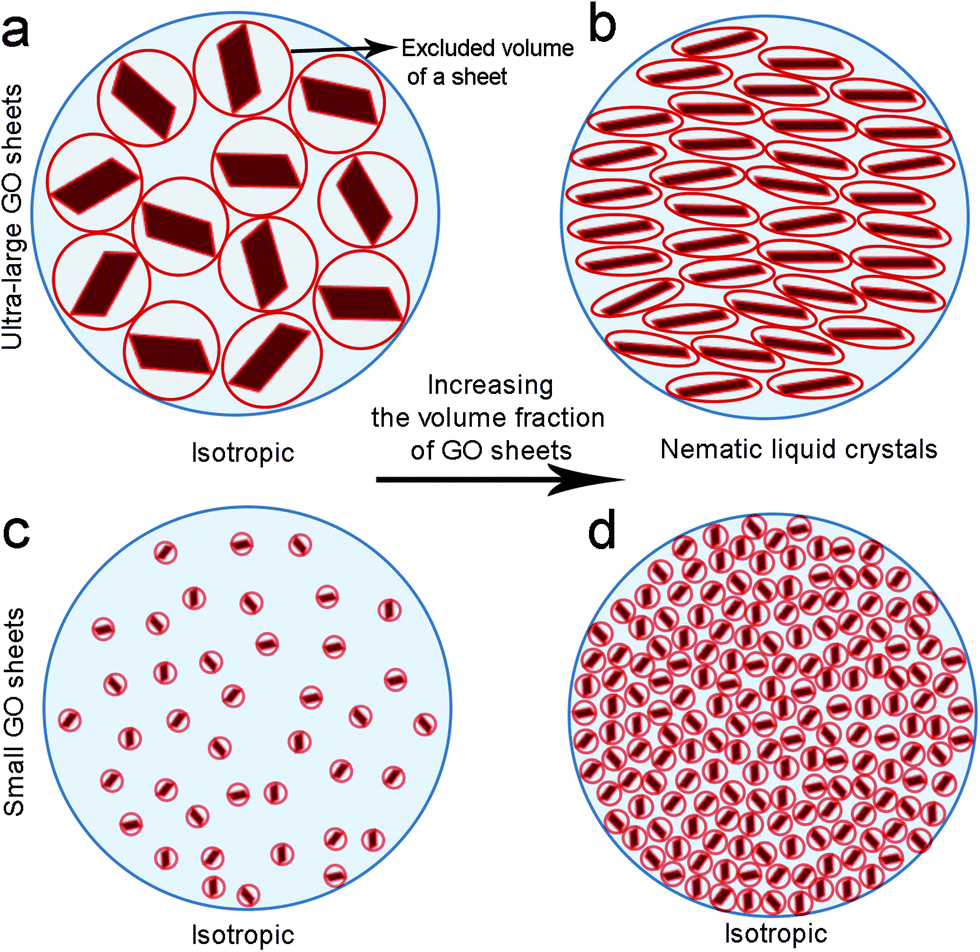 | ||
| Fig. 1 Proposed model for the evolution of LC phases in GO dispersions upon increasing concentration. (a) At extremely low concentrations (low volume fractions, Vf), ultra-large GO sheets are randomly dispersed in the solution exhibiting a large excluded volume. (b) Upon increasing concentration (increasing Vf), the sheets orientate parallel to each other in order to minimize the excluded volume and consequently form a nematic order. This phase transformation frees up some additional space in the dispersion resulting in subsequent gain in entropy. (c) At low concentration regimes, small GO sheets form a fully isotropic phase. (d) Increase in concentration does not induce spontaneous packing of the nematic phase. | ||
However, Onsager only considered completely rigid rods. In contrast, in our system, GO is flexible,2,3,13 a property associated with configurational entropy. In the nematic phase, all GO sheets are more or less parallel to the director, which leads to a considerable loss in configurational entropy. This entropy replaces the orientational entropy for rods and was first derived by Khokhlov and Semenov as an extension of the Lifshitz theory for flexible polymers to stiff polymers.17,18 Furthermore, here we are dealing with very long carbon chains, so the translational entropy per persistence length unit is small.
In contrast to a hard rigid rod, a semi-flexible chain like GO loses much more entropy, mainly because each segment of the chain loses configurational entropy while a rigid particle only loses orientational entropy as a whole. Furthermore, the effects of electrostatic interactions and steric hindrance among sheets are not adequately considered in the theoretical framework. It should also be noted that both these effects can result in a greater gain of packing (or translational) entropy. Another contributing factor which is often neglected is the effect of solvent molecules. Solvent molecules are integral to the structural formation of LC GO dispersions as they disturb the particle interaction as a result of the strong electrostatic repulsion forces following Coulomb's inverse-square law (see ESI†).
To understand these effects on LC formation and to correlate them with the rheological properties and processability, we prepared a range of GO dispersions in water with different lateral sheet sizes (Fig. 2). The critical theoretical sheet size for the transition between the isotropic and the nematic phase was calculated based on eqn (1) which serves as a model system for liquid crystal phases of charged colloidal platelets (Table 1),15
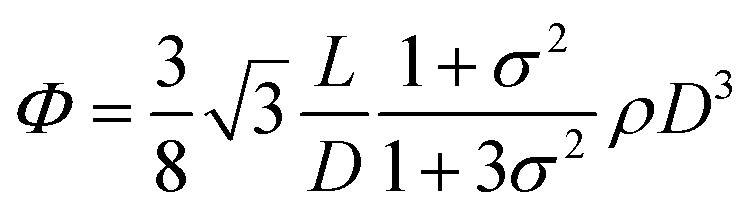 | (1) |
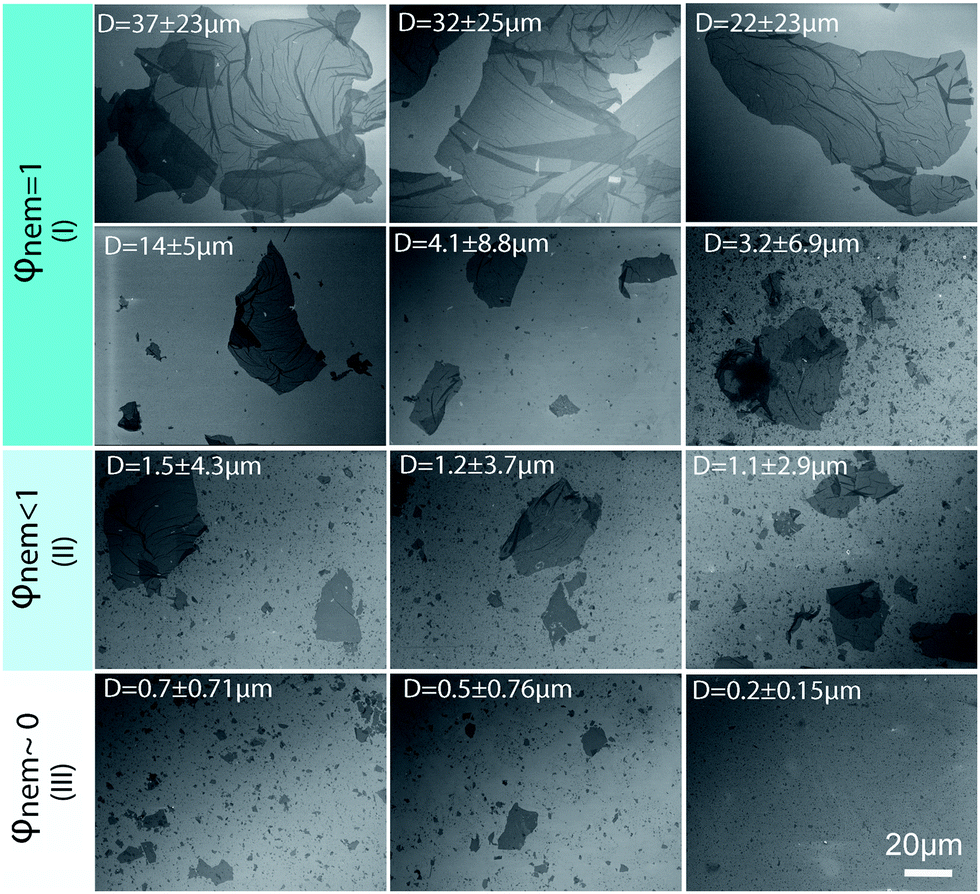 | ||
| Fig. 2 Representative SEM images of GO sheets with different average lateral size as a function of nematic phase volume fraction (φnem) at a GO concentration of 2.5 mg ml−1. Average of the lateral size is indicated in each image. Scale bar is similar for all images. I, II, and III correspond to spinnable, slightly spinnable and non-spinnable GO dispersions, respectively. | ||
| Mean sheet size(μm) | Standard deviation(μm) | Calculated transition between isotropic and nematic phases (mg ml−1) | LC birefringence | Volume fraction of LC GO | Spinnability |
|---|---|---|---|---|---|
| 37 | 23 | 0.05 to 0.09 | Yes | 1 | Yes |
| 32 | 25 | 0.06 to 0.09 | Yes | 1 | Yes |
| 22 | 23 | 0.07 to 0.11 | Yes | 1 | Yes |
| 14 | 5.4 | 0.18 to 0.28 | Yes | 1 | Yes |
| 4.1 | 8.8 | 0.29 to 0.46 | Yes | 1 | Yes |
| 3.2 | 6.9 | 0.37 to 0.59 | Yes | 1 | Yes |
| 1.5 | 4.3 | 0.75 to 1.2 | Yes | 0.95 | Fibres formed and were picked up, but, not uniform fibres |
| 1.2 | 3.7 | 2.2 to 3.6 | Partially | 0.5 | Short fibres formed which were hard to be picked up |
| 1.1 | 2.9 | 2.4 to 3.9 | Partially | 0.3 | Very short fibres formed but cannot be picked up |
| 0.7 | 0.71 | 2.2 to 3.5 | Partially | 0.2 | No |
| 0.5 | 0.76 | 2.7 to 4.2 | No | ∼0 | No |
| 0.2 | 0.15 | 9.1 to 14.6 | No | ∼0 | No |
The dimensionless number density (D3) was reported to be Diso3 = 2.7 and Dnem3 = 4.3 for isotropic and nematic transition concentrations, respectively.15 The sheet thickness (L) was estimated to be 0.81 nm based on AFM measurements, D is the average lateral size, and σ the polydispersity both from SEM images and GO sheet density (ρ) was considered to be 2.2 g cm−3.15
We kept the GO concentration constant for all samples at 2.5 mg ml−1, which we previously showed to form the fully nematic phase and is wet-spinnable.15 When the mean sheet size of the GO sheets was higher than 1.5 μm (I in Fig. 2), the theoretical transition region was found to be lower than the GO concentration, therefore, a fully nematic phase (nematic volume fraction (φnem) of 1) was formed and the dispersions were found to be fully processable and wet-spinnable. At 1.5 μm ≥ mean sheet size ≥0.7 μm (II in Fig. 2), biphasic dispersions were obtained (φnem < 1). GO dispersions at this region were found to be partially spinnable (i.e. short and non-uniform fibres were spun at this region). In the region with sheet sizes smaller than 0.7 μm (III in Fig. 2), the calculated concentration for the formation of nematic phase completely exceeded the GO concentration. As a result, the volume fraction of the LC phase was found to be negligible (φnem ∼ 0) and the dispersions were not found to be spinnable. Fig. 2 presents the representative SEM micrographs of GO sheets in these regions.
We have previously shown that the rheological behaviour of LC GO exhibited that of non-Newtonian liquids with flow curves showing yield values similar to the rheological behavior of either pseudoplastic fluids (shear thinning fluids) or thixotropic fluids. This fundamentally means that upon increasing the shear rate (high rates of deformation), the fluid moves more freely. Therefore, the transition between the isotropic and the nematic phase should also manifest itself through rheological behaviour. At the initial stage, on applying shear to an LC GO dispersion, the water lamellae slide between the layers and inter-locked nematic domains are unlocked resulting in the ordering of the LC domains along the shear field. However, when ordering is achieved, the yield value drops (Fig. 3). To better illustrate this behaviour, the flow curves and schematics of the rheological behaviour of 2.5 mg ml−1 LC GO dispersion are shown in Fig. 3. In contrast, in the case of small GO sheets, there is no yield value as the dispersions show a complete isotropic behavior and flow readily like Newtonian liquids.
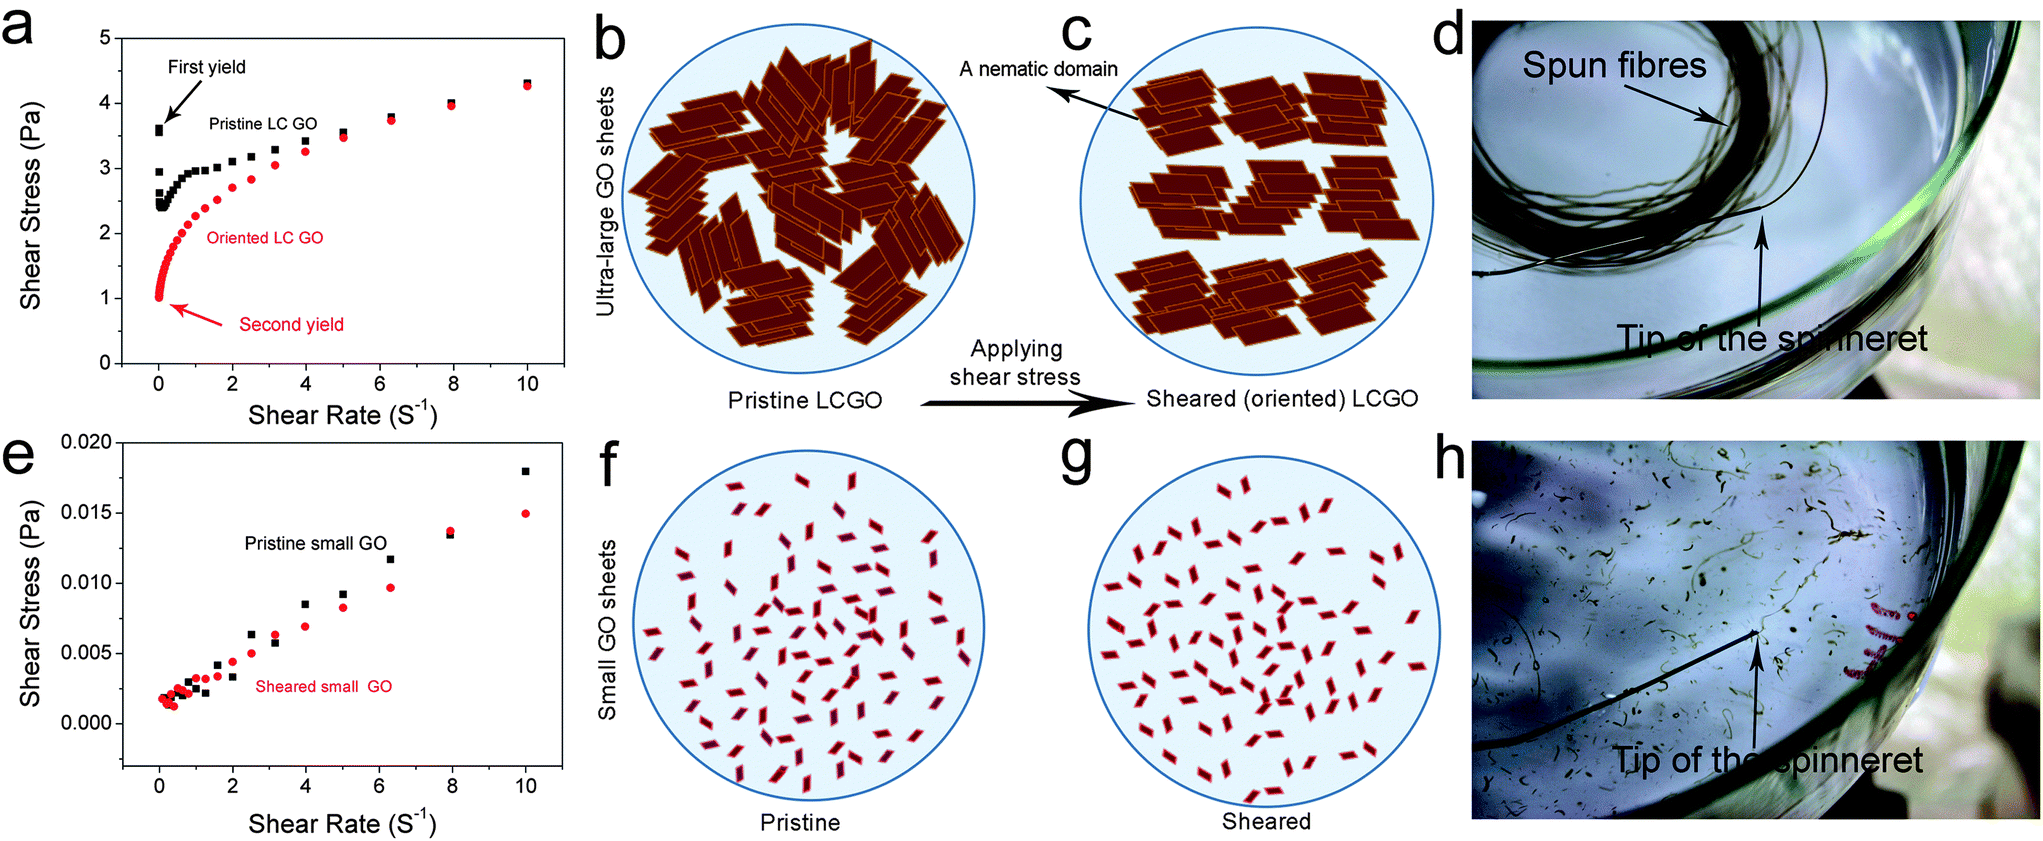 | ||
| Fig. 3 Rheological behaviour of GO dispersions and subsequent orientation and processing. (a) Shear stress vs. shear rate of 2.5 mg ml−1 LC GO dispersions of ultra-large size GO. Upon applying shear stress, nematic domains in pristine LC GO (b) are sheared and oriented along the direction of shear stress (c). This, in turn, results in subsequent (d) wet-spinning of the dispersions of ultra-large GO sheets by forming continuous lengths of fibres. However, in the case of small GO sheets with the same concentration (e), the shear stress vs. shear rate is linear representing a Newtonian behaviour. The dispersion flows readily like water and no orientation is induced as a result of the applied shear (f) and (g). (h) Small GO sheets were found to be non-spinnable. When the GO dispersion exits the spinneret, only segments of GO form, which eventually are dispersed into the coagulation bath. | ||
When the measurement was repeated, the yield value and viscosity of the second ascending curve were significantly lower; however, the flow curve was identical to that on the first descending curve (Fig. S1 and S2†). This confirmed that an orientation of the anisotropic phase took place in the shear field when they were subjected to shear stress.
Fig. 4 and Table S1† present the correlation among the differences between 2 yield and viscosity values of a pristine sample and a sheared (oriented) sample to GO sheet size, theoretical concentration of transition between isotropic and nematic phases, LC formation and spinnability. At a fixed concentration of 2.5 mg ml−1, upon decreasing the sheet size to a critical value of >1.5 μm (first region), the dispersions exhibit fully nematic behaviour with noticeable yield value differences and the dispersions are suitable for wet-spinning. However, decreasing the sheet size further (region II) results in the formation of a biphasic region (co-existence of both nematic and isotropic regions), and consequently a slight difference in the yield value with partial processability resulting in short length fibre spinning. In region (III) (sheet sizes < 0.7 μm), the system does not show any yield and consequently no fibre forming capabilities. This difference in yield and viscosity is of principal importance in a number of industrial processes such as wet-spinning, where the final architecture has to regain viscosity once they are injected into the coagulation bath to preserve the structure of the fibres and the orientation of nematic domains. These data were also confirmed in viscosity measurements of pristine LC GO (2.5 mg ml−1). As the apparent viscosity (η) approaches ∞, the shear rate (![[small gamma, Greek, dot above]](https://www.rsc.org/images/entities/i_char_e0a2.gif) ) approaches 0, which was found to experimentally scale as η = 3.054−0.95 (Fig. S2†).
) approaches 0, which was found to experimentally scale as η = 3.054−0.95 (Fig. S2†).
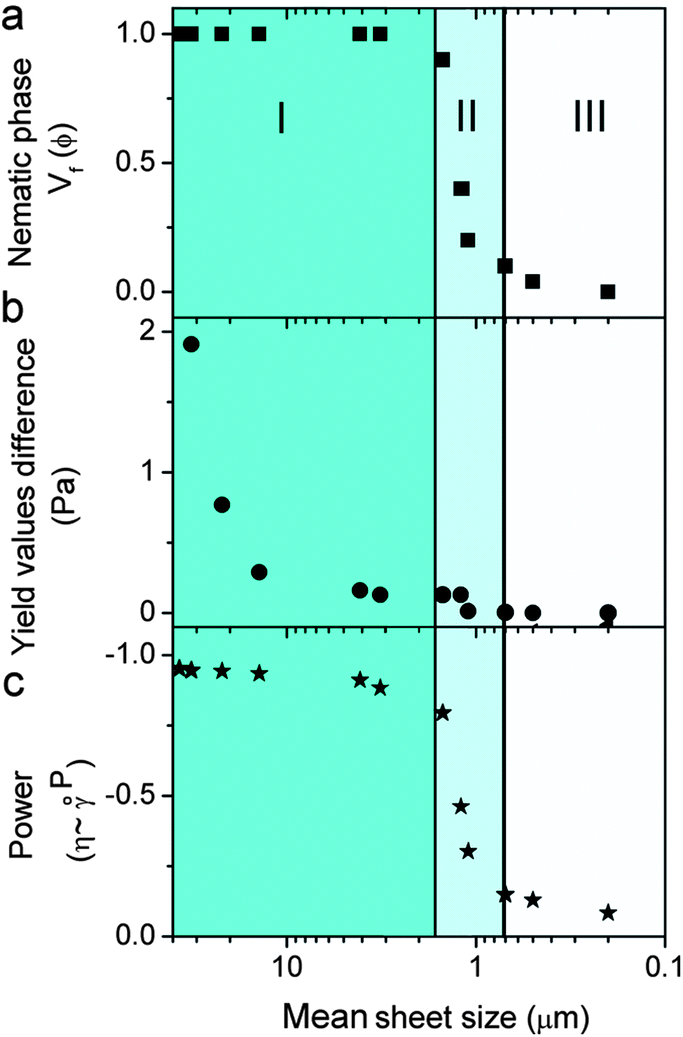 | ||
| Fig. 4 The effect of GO sheet size on (a) measured volume fraction of the nematic phase, (b) difference between yield values from the first and second flow measurements and (c) power (P) of the experimental scale of viscosity as a function of shear rate (η ∼ P). Regions I, II, and III correspond to spinnable, slightly spinnable and non-spinnable GO dispersions, respectively. | ||
It should be noted that the theoretical exponent for pseudoplastic materials has a value of −1. Upon decreasing the GO sheet size to the region in which the dispersions transformed from nematic to biphasic, the exponent value completely deviated from the theoretical value of −1, indicating the loss of plastic component, liquid crystallinity and processability (spinnability).
Now, can we exploit this understanding of LC GO formation to induce spinnability in a fully isotropic GO dispersion? By introducing very small amounts of ultra-large GO sheets into isotropic dispersions (lower than the critical concentration), we are able to systematically control and induce liquid crystallinity in small-sheet GO dispersions (Fig. 5). Equal volumes of two fully isotropic GO dispersions with highly different sheet sizes were mixed. The dispersion with small GO sheets exhibited a concentration of 2.5 mg ml−1 and ultra-large sheet dispersion had a concentration of 0.1 mg ml−1. The mixture (containing only ∼4% wt large GO), although having a much lower concentration compared to the dispersion with small GO sheets (1.3 mg ml−1 compared to 2.5 mg ml−1), exhibited birefringence behavior and partial spinnability (Fig. 5), thus suggesting a facile route to achieve spinnable LC GO dispersions upon the addition of a small amount of large GO sheets. Increasing the mass fraction of large GO to small GO sheets (from 4% wt to 10% wt), resulted in a spinnable LC GO dispersion.
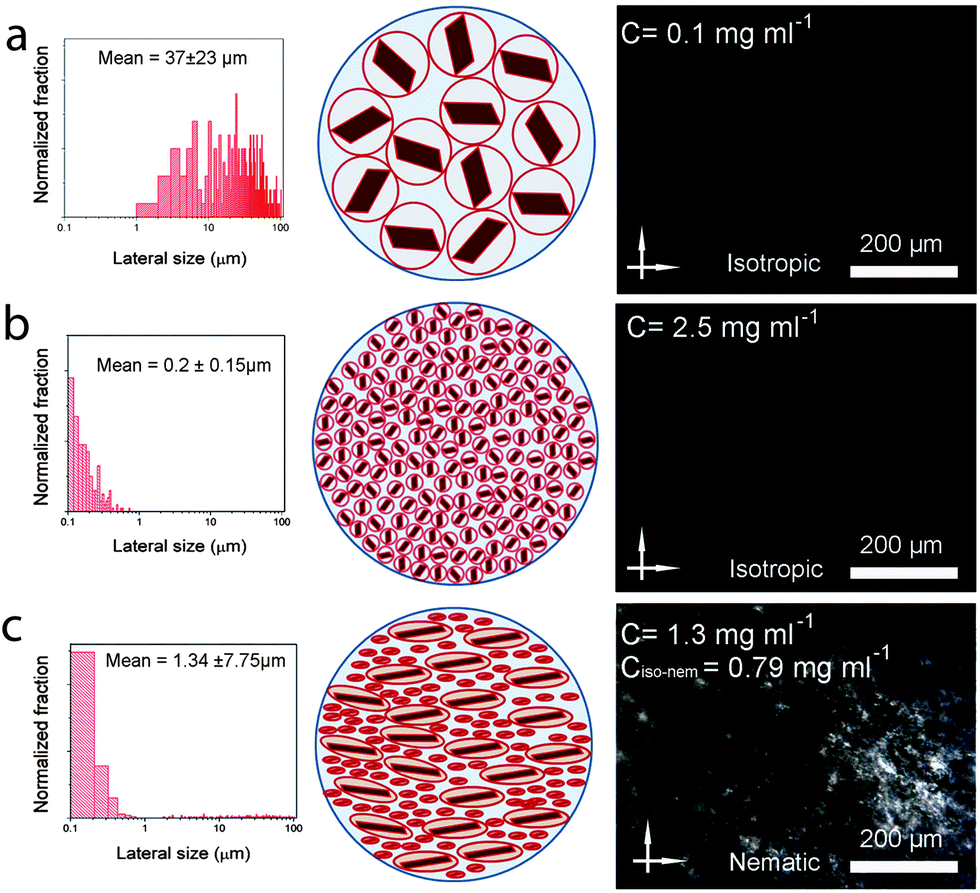 | ||
| Fig. 5 Upon introduction of fully isotropic and non-spinnable GO dispersion containing ultra-large GO sheets (a) to another fully isotropic GO dispersion containing small GO sheets (b), spontaneous formation of the nematic liquid crystalline phase (c) happens as apparent in the schematics and polarized optical micrographs presented in the right side corresponding columns. | ||
Fundamentally speaking, in a colloidal suspension containing GO sheets of significantly different sizes, the bigger sheets generate excluded volume for smaller sheets, giving rise to entropic rearrangement of sheets to form long range ordering resembling liquid crystalline molecules. The presence of ultra-large sheets, therefore, competitively limits the large excluded volume of small GO sheets and promotes nematic phase formation.
Conclusions
In conclusion, the new rheological insight obtained has enabled us to describe the underlying nematic phase formation mechanism in LC GO dispersions by means of entropic driven configuration of charged platelets. We demonstrated the effect of GO sheet size on LC formation, rheological properties and spinnability. This mechanism was supported and validated by the ability to predict the effect of introducing large GO sheets into isotropic small-sheet GO dispersions to systematically manipulate and design fundamentally any GO dispersion to achieve LC GO dispersions and consequently processability.Experimental
Expanded graphite was used as the precursor for ultra-large GO synthesis following previously described methods.2,3 The resultant large GO sheets were dispersed in deionised water by gentle shaking at a concentration of 2.5 mg ml−1. In order to evaluate the effects of GO sheet size on LC behaviour, rheological properties, and fibre spinnability, 2.5 mg ml−1 aqueous GO dispersion was subjected to a bath sonication (Branson B2500R-MTH) to break down the lateral size of the GO sheets. In order to make a range of lateral sizes, aliquots were taken from the GO dispersion while it was under sonication. Lateral size distribution of 256 isolated GO sheets in each group was determined from SEM images and analysed using image analysis software (ImageJ, http://rsb.info.nih.gov/ij/) (Fig. S3 & S4†). Mean GO sheet size was defined as the diameter of an equal-area circle, and then the average was reported.SEM was carried out by first depositing GO sheets from their dispersions on a pre-cleaned and silanised silicon wafer (300 nm SiO2 layer). Silane solution was prepared by mixing 3-aminopropyltriethoxysilane (Aldrich) with water (1:9 vol) and one drop of hydrochloric acid (Sigma-Aldrich). Pre-cut silicon substrates were silanised by immersing in aqueous silane solution for 30 min and then washed thoroughly with Millipore water. GO sheets were deposited onto silanised silicon substrates by immersing a silicon substrate into the GO dispersion (50 μg ml−1) for 5 seconds, then into a second container containing Millipore water for 30 seconds and then air-dried. As-deposited GO sheets were directly examined by scanning electron microscopy (SEM, JEOL JSM-7500FA).
The birefringence of GO dispersions was examined using a polarised optical microscope (POM) (Leica CTR 6000) operated in transmission mode. Following previously reported methods to estimate the volume fraction of liquid crystalline domains in birefringent solutions,15 450 μl of a series of GO dispersions from different lateral sizes were placed in a capillary tube (1.5 mm ID), sealed and then left stationary for two weeks. The volume fraction of the stable birefringent (nematic) phase was then measured by polarised optical microscopy on the last day. The rheological properties of aqueous GO dispersions were investigated using a rheometer (AR-G2 TA Instruments) with a conical shaped spindle (angle: 2°, diameter: 40 mm). Approximately 600 μl of GO dispersions were loaded into the rheometer with great care taken not to shear or stretch the sample. Shear stress and viscosity were measured at shear rates between 0.01 and 10 using logarithmic steps (total 200 points) for two complete (ascending and descending) cycles. The shear rate was kept constant until equilibrium was achieved, then data were recorded. Yield value and viscosity (at the lowest shear rate) were obtained as a function of the GO sheet size.
For evaluating the spinnability of the GO dispersion in a particular GO sheet size, the previously described wet-spinning setup was used,3,19–21 where, GO dispersion is injected at flow rates between 5 and 10 ml h−1 into a rotating Petri dish (between 30 and 60 rpm) that contained 1 M NaOH as a coagulation bath.
Acknowledgements
The authors thank the Australian Research Council (ARC) for financial support and the Australian National Fabrication Facility (ANFF) Materials Node for their provision of research facilities. This work was supported by ARC Discovery Project DP1093952 (KK and SHA) and ARC Federation Fellowship (GGW). Authors would like to thank Asbury Carbons for providing expandable graphite. SEM acknowledges the ARC for his Queen Elizabeth II Fellowship.References
- Y. Zhu, S. Murali, W. Cai, X. Li, J. W. Suk, J. R. Potts and R. S. Ruoff, Adv. Mater., 2010, 22, 3906–3924 CrossRef CAS PubMed.
- S. H. Aboutalebi, M. M. Gudarzi, Q. B. Zheng and J.-K. Kim, Adv. Funct. Mater., 2011, 21, 2978–2988 CrossRef CAS.
- R. Jalili, S. H. Aboutalebi, D. Esrafilzadeh, K. Konstantinov, S. E. Moulton, J. M. Razal and G. G. Wallace, ACS Nano, 2013, 7, 3981–3990 CrossRef CAS PubMed.
- F. Guo, F. Kim, T. H. Han, V. B. Shenoy, J. Huang and R. H. Hurt, ACS Nano, 2011, 5, 8019–8025 CrossRef CAS PubMed.
- Z. Xu, H. Sun, X. Zhao and C. Gao, Adv. Mater., 2013, 25, 188–193 CrossRef CAS PubMed.
- Z. Xu and C. Gao, Nat. Commun., 2011, 2, 571 CrossRef PubMed.
- J. E. Kim, T. H. Han, S. H. Lee, J. Y. Kim, C. W. Ahn, J. M. Yun and S. O. Kim, Angew. Chem., Int. Ed., 2011, 50, 3043–3047 CrossRef CAS PubMed.
- L. J. Cote, J. Kim, Z. Zhang, C. Sun and J. Huang, Soft Matter, 2010, 6, 6096–6101 RSC.
- J. Kim, L. J. Cote, F. Kim, W. Yuan, K. R. Shull and J. Huang, J. Am. Chem. Soc., 2010, 132, 8180–8186 CrossRef CAS PubMed.
- N. Yousefi, M. M. Gudarzi, Q. Zheng, S. H. Aboutalebi, F. Sharif and J.-K. Kim, J. Mater. Chem., 2012, 22, 12709–12717 RSC.
- M. G. Mohsen, A. S. Hamed, Y. Nariman, Z. Q. Bin, S. Farhad, C. Jie, L. Yayun, X. Allison and K. Jang-Kyo, in MRS Proceedings, Cambridge University Press, 2011, pp. mrss11-1344-y1302-1306 Search PubMed.
- S. H. Aboutalebi, A. T. Chidembo, M. Salari, K. Konstantinov, D. Wexler, H. K. Liu and S. X. Dou, Energy Environ. Sci., 2011, 4, 1855–1865 CAS.
- S. H. Aboutalebi, S. Aminorroaya-Yamini, I. Nevirkovets, K. Konstantinov and H. K. Liu, Adv. Energy Mater., 2012, 2, 1439–1446 CrossRef CAS.
- B. Dan, N. Behabtu, A. Martinez, J. S. Evans, D. V. Kosynkin, J. M. Tour, M. Pasquali and I. I. Smalyukh, Soft Matter, 2011, 7, 11154–11159 RSC.
- R. Jalili, S. H. Aboutalebi, D. Esrafilzadeh, L. Shepherd Roderick, C. Jun, A.-Y. Sima, K. Konstantinov, I. Minett Andrew, J. M. Razal and G. G. Wallace, Adv. Funct. Mater., 2013, 10 DOI:10.1002/adfm.201300765.
- L. Onsager, Ann. N. Y. Acad. Sci., 1949, 51, 627–659 CrossRef CAS.
- A. R. Khokhlov and A. N. Semenov, Phys. A, 1981, 108, 546–556 CrossRef.
- I. M. Lifshitz, A. Y. Grosberg and A. R. Khokhlov, Rev. Mod. Phys., 1978, 50, 683–713 CrossRef CAS.
- R. Jalili, J. M. Razal, P. C. Innis and G. G. Wallace, Adv. Funct. Mater., 2011, 21, 3363–3370 CrossRef CAS.
- R. Jalili, J. M. Razal and G. G. Wallace, J. Mater. Chem., 2012, 22, 25174–25182 RSC.
- D. Esrafilzadeh, J. M. Razal, S. E. Moulton, E. M. Stewart and G. G. Wallace, J. Controlled Release, 2013, 169, 313–320 CrossRef CAS PubMed.
Footnotes |
| † Electronic supplementary information (ESI) available: Supporting discussions, Fig. S1 to S5 and Table S1. See DOI: 10.1039/c3mh00050h |
| ‡ These authors contributed equally to this work. |
| This journal is © The Royal Society of Chemistry 2014 |