Direct evidence to support the restriction of intramolecular rotation hypothesis for the mechanism of aggregation-induced emission: temperature resolved terahertz spectra of tetraphenylethene†
Edward P. J.
Parrott
a,
Nicholas Y.
Tan
b,
Rongrong
Hu
c,
J. Axel
Zeitler
*b,
Ben Zhong
Tang
*c and
Emma
Pickwell-MacPherson
*a
aDepartment of Electronic Engineering, The Chinese University of Hong Kong, Shatin, N.T., Hong Kong, China. E-mail: emma@ee.cuhk.edu.hk; Fax: +852 2603 5558; Tel: +852 3943 8260
bDepartment of Chemical Engineering and Biotechnology, University of Cambridge, Pembroke Street, Cambridge CB2 3RA, UK. E-mail: jaz22@cam.ac.uk; Fax: +44 1223 334796; Tel: +44 1223 334783
cDepartment of Chemistry, Institute of Molecular Functional Materials and Division of Biomedical Engineering, The Hong Kong University of Science and Technology, Clearwater Bay, Kowloon, Hong Kong, China. E-mail: tangbenz@ust.hk; Fax: +852 2358 1594; Tel: +852 2358 7375
First published on 28th November 2013
Abstract
In contrast to the traditional fluorescent dyes that exhibit a decrease in fluorescence upon aggregation, Aggregation-Induced Emission (AIE) molecules are a family of fluorophors which exhibit increased fluorescence upon aggregation. Consequently, AIE molecules represent an interesting new material with potential applications in fluorescent chemo/biosensors, light emitting devices and medical diagnostics. Numerous mechanisms have been proposed to explain this phenomenon, including E–Z isomerization, and restriction of intramolecular rotations (RIR). However, there has not been any direct experimental evidence to support either one of these hypotheses. Here we use terahertz time-domain-spectroscopy (THz-TDS) and solid-state computational simulations of an AIE molecule to link the increase in intensity of intramolecular rotation and rocking modes to the measured fluorescence and reveal direct evidence supporting the RIR hypothesis. This is the first time that terahertz spectroscopy has been used to directly probe such molecular motions in AIE materials and in doing so we have found conclusive evidence to fully explain the AIE mechanism.
Introduction
Organic luminescent materials play a major role in applications ranging from fluorescent sensors1,2 to imaging applications,3,4 due to advantages such as low cost, ease of fabrication, flexibility, high sensitivity and selectivity. These materials are normally used in either the solid state or in aqueous media, however efficient emission from these aggregated states is often difficult as many compounds quench their own fluorescence in the condensed phase due to non-radiative decay pathways.5–7 Many chemical, physical and engineering solutions have been proposed to alleviate this issue, but these have met with only limited success.8–10In 2001, a novel system was reported by one of the present authors in which the aggregation of the luminescent molecule enhanced the intensity of the emitted light.11 These molecules, including tetraphenylethene (TPE) and hexaphenyl silole (HPS), are non-emissive when dissolved in good solvents but become highly emissive when aggregated in poor solvents or in the solid state. This phenomenon was called aggregation-induced emission (AIE).12 Since this discovery, several mechanisms have been proposed by different research groups, including restriction of intramolecular rotations (RIR), conformational planarization, J-aggregate formation, hydrophobic effects, E/Z isomerisation and twisted intramolecular charge transfer.13–16 Despite some indirect experimental and computational evidence in support of the RIR hypothesis, there lacks direct evidence to support or refute the proposed mechanisms.12,15,17–20 It is imperative that detailed mechanistic studies of the AIE phenomenon are undertaken to benefit and direct further exploration of high-tech applications, such as using AIE compounds in chemical,21 chirality22 or gamma ray23 sensing applications.
Terahertz time-domain spectroscopy (THz-TDS) has been used to study the material, chemical and electrical properties of a variety of sample systems, including crystalline polymorphs,24–27 glasses,28 carbon nanotubes29–32 and proteins.33,34 Electromagnetic radiation at a frequency of 1 THz (1012 Hz, 4.1 meV) is low enough in energy to probe the electronic structure of materials, the low frequency intermolecular interactions, and also some low energy intramolecular modes. Therefore, it is sensitive to small structural changes in crystalline structures and the relaxation dynamics in condensed matter, and can measure the frequency-dependent conductivity of materials in a non-contact manner. In addition, it is non-ionising due to its low photon energy when compared to other measurement techniques such as X-ray and UV-vis spectroscopy. Previous research has demonstrated that low frequency rotational modes of phenyl groups, for example in methamphetamine hydrochloride,35 occur at terahertz frequencies. It is also well established that the unit cell contracts as the temperature decreases, similar to aggregation. Furthermore, strong temperature dependence is observed in the solution state for AIE molecules, which is expected to be due to a correlation between molecular rotations and fluorescence.12,36 Consequently, we expect that a temperature dependent THz-TDS study in the solid state of a simple AIE molecule (TPE) could provide a direct measurement to test the validity of the RIR hypothesis as the dominant fluorescence enhancement mechanism for these molecules.
Experimental methods
Tetraphenylethene (TPE) was prepared according to the literature method.37 Single crystals of TPE were obtained by evaporating solvent slowly from its dichloromethane–methanol (1![[thin space (1/6-em)]](https://www.rsc.org/images/entities/char_2009.gif) :1 v/v) solution.
:1 v/v) solution.
For the THz-TDS measurements, TPE was co-mixed with polyethylene (PE) powder and compressed into pellets approximately 3 mm thick containing 300 mg of material with a TPE:PE ratio of 1:4. An additional 240 mg pellet of pure PE was used as a reference. Variable temperature experiments were performed under vacuum using a continuous flow liquid-nitrogen cooled cryostat (Janis ST-100, Janis Research) and temperature controller (Lakeshore 331, Lakeshore Cryotronics Inc). Terahertz spectra were obtained, with 5 K steps between 80 and 130 K, and 10 K steps between 130 and 290 K, according to methods previously reported.38 The use of a silicon beam stop to block the reflected pump beam resulted in a small post peak pulse that was removed using linear modelling techniques.39
Single crystal X-ray intensity data were collected at 100 K and room temperature on a Bruker-Nonices Smart Apex CCD diffractometer with graphite monochromated Mo-Kα radiation. Processing of the intensity data was carried out using the SAINT and SADABS40 routines and the structure and refinement were conducted using the SHELXTL41 suite of X-ray programs (version 6.10). The newly determined 293K structure has been deposited into the CDCC (no. 973505), whereas the 100 K structure has been previously published in ref. 42. The room temperature structure is provided as ESI.†
Computational Density Functional Theory (DFT) calculations for solid state TPE at 110 K and 290 K were performed using the academic version of CASTEP,43 with standard norm-conserving pseudo-potentials and the PBE functional.44 All calculations used the following parameters: k-point separation of 0.05 Å−1, plane wave basis cutoff of 1200 eV, electronic convergence tolerance of ΔE <1 × 10⁻¹³ eV per atom. In addition, we used the semi-empirical dispersion correction (d-DFT) scheme first formulated by Grimme45,46 to account for the London-type dispersion forces that are expected to dominate the intermolecular behaviour. Geometry optimizations were performed to the following tolerances: energy <5 × 10⁻⁸ eV per atom, ionic forces <3 × 10⁻⁵ eV Å−1 and ionic displacement <1 × 10⁻⁵ Å. In order to incorporate the dispersion correction in the phonon mode calculations, the finite displacement phonon calculation method was employed,47 using a displacement amplitude of 1 × 10⁻² Å.
Photoluminescence (PL) measurements of TPE pellets were performed by exciting the same pellets as used for THz-TDS measurements with an Omnichrome 325 nm He–Cd laser. The PL signal was measured by a SPEX 500 monochrometer and a photomultiplier tube (TE177RF003 Hamamatsu, Japan) at temperatures between 20 and 290 K (Expander DE202, APD Cryogenics, PA).
Results and discussion
THz-TDS measurements
Fig. 1(a) shows the evolution of the absorption coefficient (α) for TPE as a function of temperature over the measured frequency range (0.1–2.2 THz). For clarity, example line plots taken at 280 K and 80 K (Fig. 1(b)) are also plotted, to highlight the main features of the high and low temperature spectra. To test whether isomerisation of the structure was a factor in the fluorescence,48 terahertz spectra were obtained both with and without UV illumination. No difference (to within experimental error) was observed between the illuminated and non-illuminated terahertz spectra at any of the temperatures measured (an example of this is shown in the ESI†). At least three spectral features can be identified at both high and low temperatures. These are a shoulder at 1.0 THz and peaks at 1.55 and 1.87 THz in the high temperature spectrum, and a peak at 1.2 THz, a shoulder at 1.73 THz, and a sharp peak at 1.94 THz in the low temperature spectrum. In addition, a further small peak can be observed at 1.52 THz in the low temperature spectrum. Integration of the areas under the absorption features shows that the high temperature spectrum has a 38% higher absorption in this frequency region when compared to the low temperature spectrum. The change in composition and intensity of spectral features suggests a change in the structure of the supramolecular arrangement with temperature. To explore this possibility, we calculated the vibrational modes for both the low and high temperature structures of TPE using the software package CASTEP, based upon crystal structures that were calculated from single crystal X-ray diffraction experiments.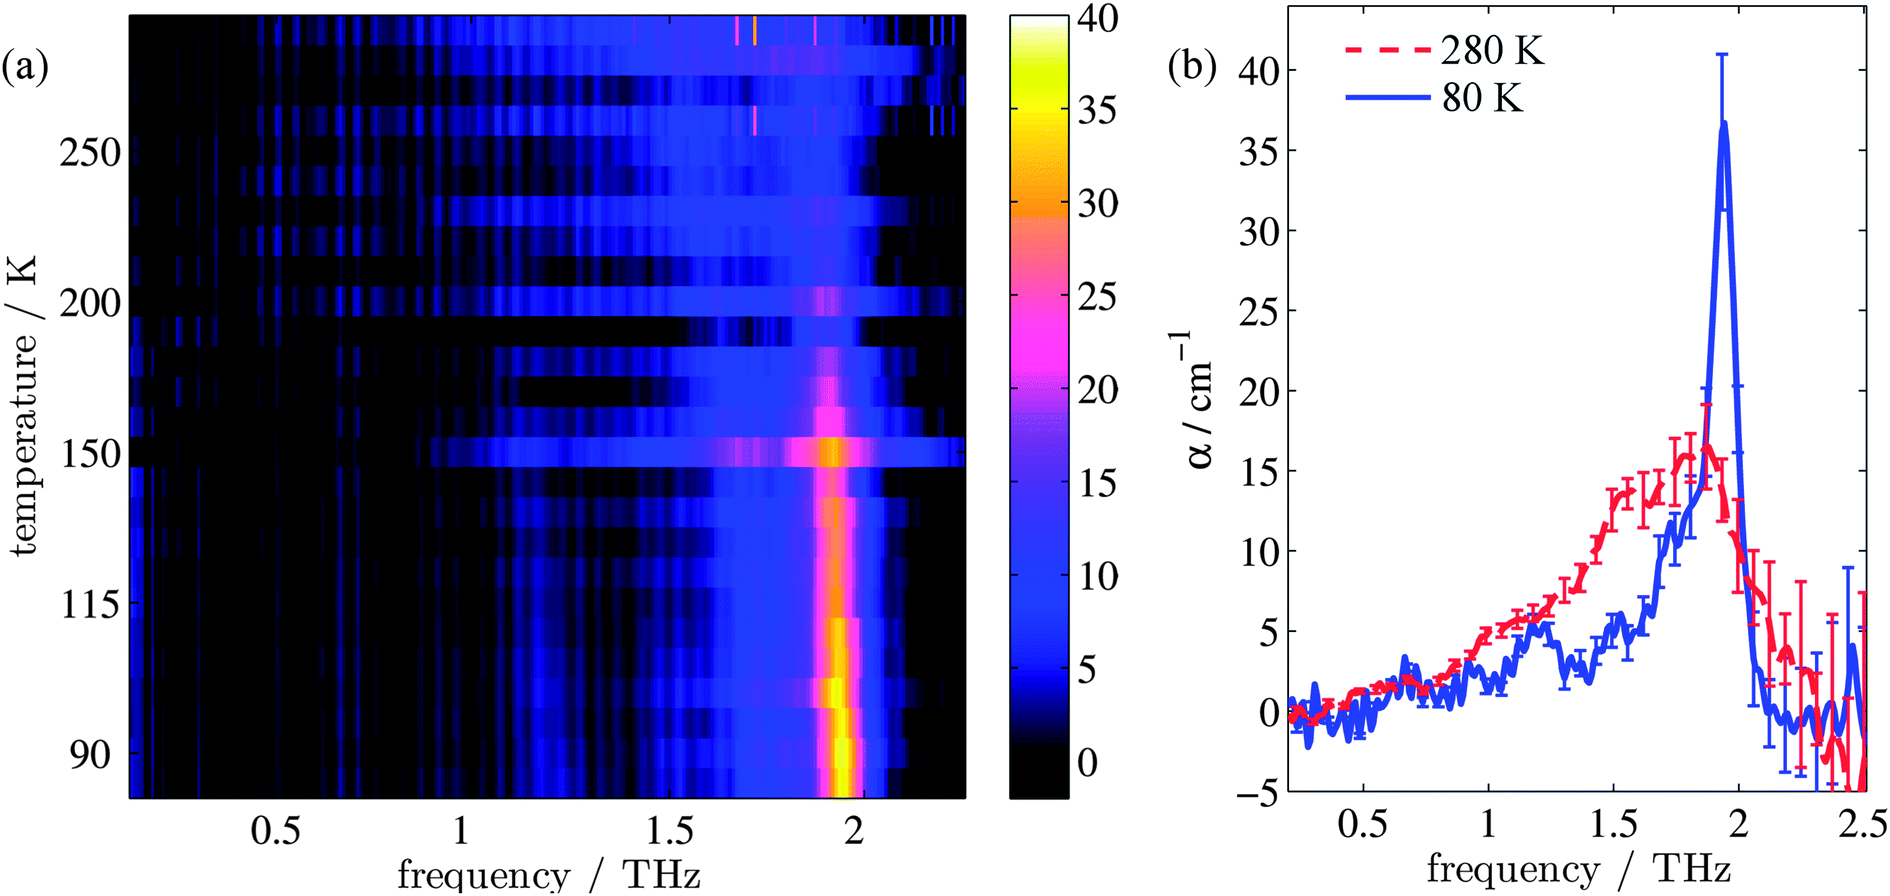 | ||
| Fig. 1 (a) Image map of the change in absorption coefficient for TPE with temperature. (b) shows representative absorption spectra for TPE at the high (red dashed line) and low (blue solid line) temperatures. | ||
Calculation of the vibrational modes
Analysis of the high and low temperature unit cells revealed small changes in the torsion angles of the four phenyl groups between the two structures (see ESI Table 1†). These changes ranged between 0.60° and 4.00° in magnitude, with the smallest change observed for the ph2 moieties. Furthermore, the orientation of the two molecules within the unit cell is observed to change. Fig. 2(a) and (b) shows the differences in the two unit cells by displaying planes generated by the C![[double bond, length as m-dash]](https://www.rsc.org/images/entities/char_e001.gif) C-Ph1 bonds.
C-Ph1 bonds.
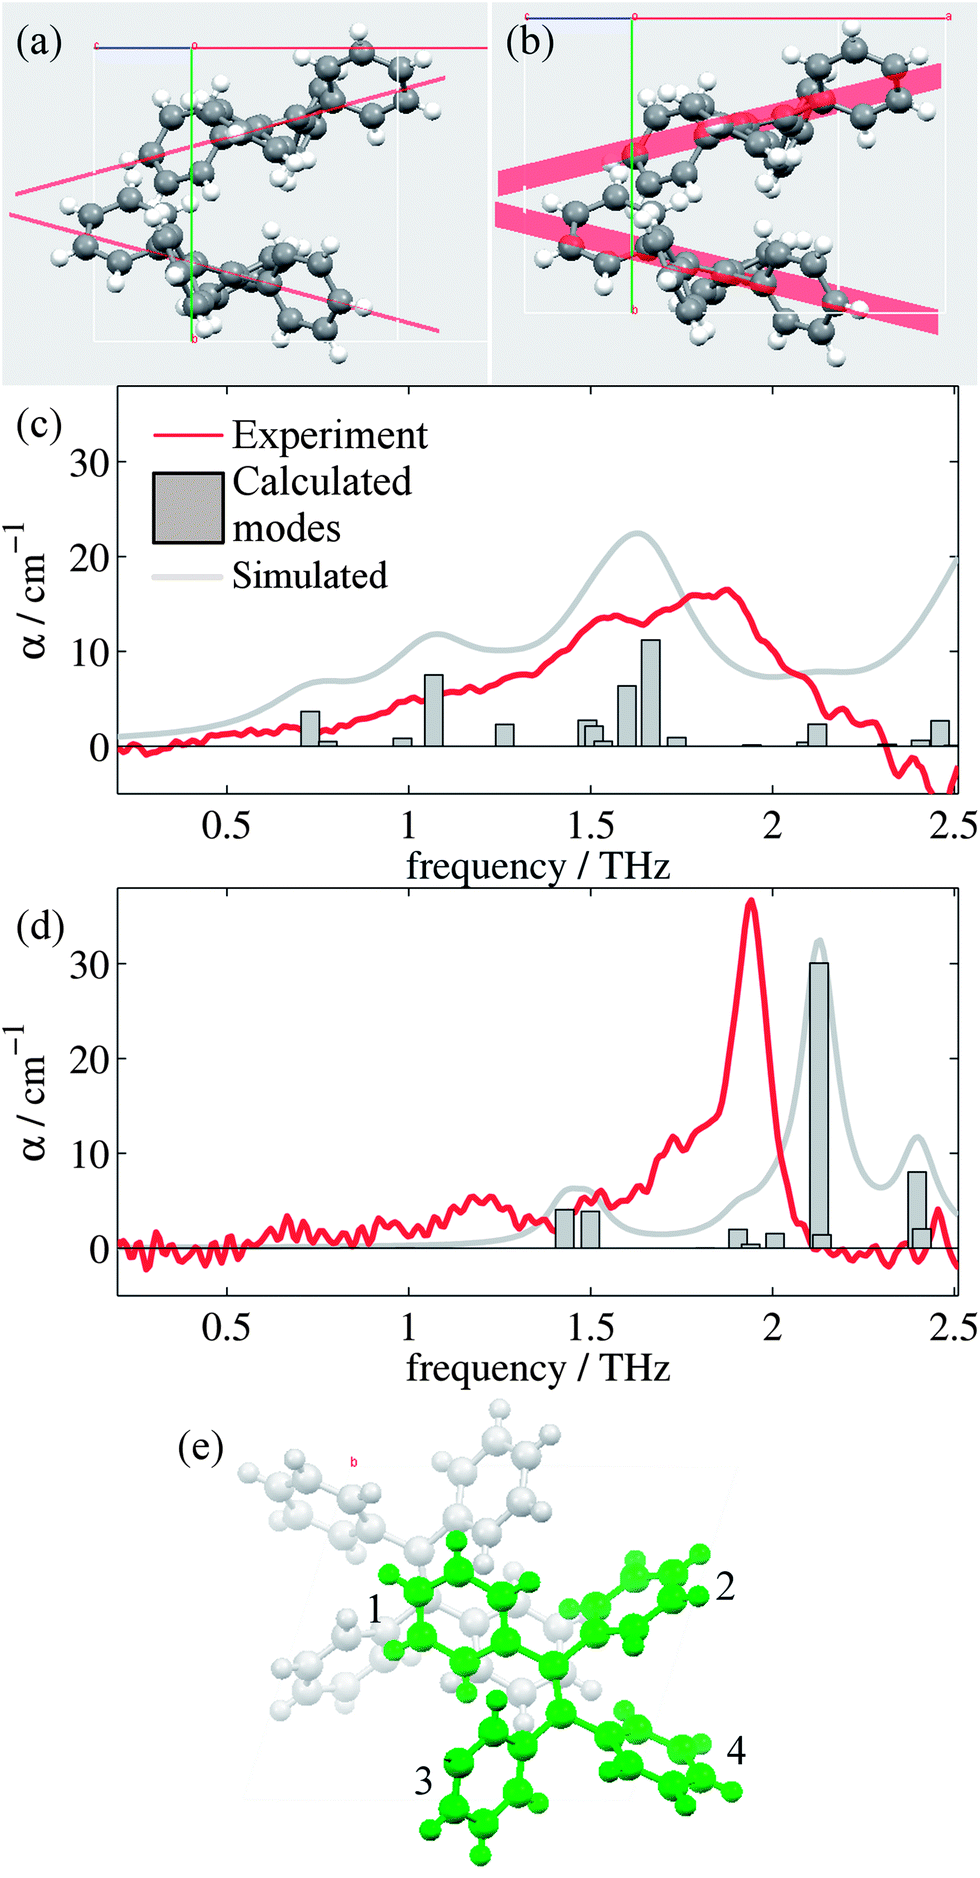 | ||
| Fig. 2 Plane orientations for the (a) high temperature and (b) low temperature structures viewed along the c axis, with the CC-Ph1 plane highlighted in red. Comparison of the predicted CASTEP vibrational intensities from the (c) high temperature and (d) low temperature structures, respectively. The simulated spectra use Lorentzian line shapes with linewidths of 5 and 2 cm−1 respectively. (e) Low temperature unit cell viewed along the crystallographic b-axis with the two molecules represented in different colours. The phenyl numbering is used to assign the vibrational features in the subsequent discussion. | ||
d-DFT enabled geometry optimizations were performed for both the high and low temperature structures. Initially, the unit cell was not fixed, and the resulting crystal structure parameters found are detailed in ESI Table 2.† The two experimental structures optimized to very similar final structures; so we determined the suitability of the d-DFT derived structure by comparing the rms Cartesian displacement for the experimental and optimized structures.49 The high temperature structure had an rms Cartesian displacement of 0.29 Å (max displacement was 0.58 Å) suggesting a temperature effect that cannot be modelled by the geometry optimization.49,50 In contrast, the low temperature structure only had an rms displacement of 0.11 Å, well within the typical displacement observed for these geometry optimizations.49 Therefore, it was decided to fix the unit cell dimensions for the high temperature structure and perform phonon calculations on the resulting optimised structure (note that the d-DFT corrections were still used for these calculations). Given the close agreement with the experimental structure, the non-unit-cell-fixed structure was used for the phonon calculations of the low temperature structure.
Fig. 2(c) and (d) show the mode frequencies and intensities predicted by CASTEP for the high and low temperature structures, respectively, as well as simulated spectra and the measured absorption spectra from our measurements. ESI Table 3† details the vibrational modes calculated for each structure in this region along with descriptions of the significant modes, which are intramolecular rotations and vibrations of the phenyl (ph) groups. Whilst being superficially symmetric, the TPE molecule is actually asymmetric in the solid state, as each of the ph groups has different sets of nearest neighbour interactions and consequently different equilibrium positions and angles. There are small offsets in the frequency of some of the modes which is common in these calculations,51 and the relative intensities and positions of the vibrational modes agree more closely for the low temperature structure than the high temperature structure. This is not surprising, given the limitations we have observed when optimizing and performing phonon calculations on the high temperature structure, as the current CASTEP implementation does not account for the temperature dependent structural evolution observed for TPE; consequently the optimized high temperature structure is not as accurate as the low temperature version. However, the overall trend of the two structures is reproduced satisfactorily, with the shoulder and peaks being reproduced in both the high and low temperature simulations with approximately the correct relative intensities. Closer analysis of the types of vibrational modes (ESI Table 3†) suggest that whilst at high temperatures the modes are dominated by movements of ph1 and ph4 groups, at low temperatures the motions are dominated by the movements of the ph2 group (and to a smaller extent the ph1 group), in particular that of the large vibrational mode at 2.13 THz. It should be noted that whilst these modes are intramolecular in nature, their form and intensity is strongly affected by the intermolecular interactions (in this case London dispersion forces). Thus, calculations that do not perform dispersion corrections,52 or those that consider the single TPE molecule in the gas phase may well be of limited practical use when studying these systems.
TPE structure evolution during unit cell contraction
The changes in relative intensities of the vibrational modes found using theoretical modelling are also seen in our THz-TDS measurements. In these next sections we carefully analyse the THz measurement data and relate the spectral changes to the transitions occurring in the TPE molecule. From Fig. 1(a) we see that the terahertz data has interesting features between 1.45 and 2.05 THz: as the temperature is increased, the low temperature peak at 1.94 THz loses intensity and shifts to 1.87 THz, and similarly the 1.73 THz peak shifts to 1.55 THz. We hypothesize that the terahertz spectra of the high and low temperature structures can be broadly modelled using these two peaks, which themselves will be a superposition of multiple low/high frequency modes predicted by the computational models in the previous section. As the peaks are relatively close in frequency (compared with their widths) their spectral lines will overlap and so we have fitted the data with two Lorentz oscillator functions (over the region 1.45–2.05 THz). Results of this fitting are shown for four of the temperatures in Fig. 3(a)–(d) (the rest are given in the ESI†).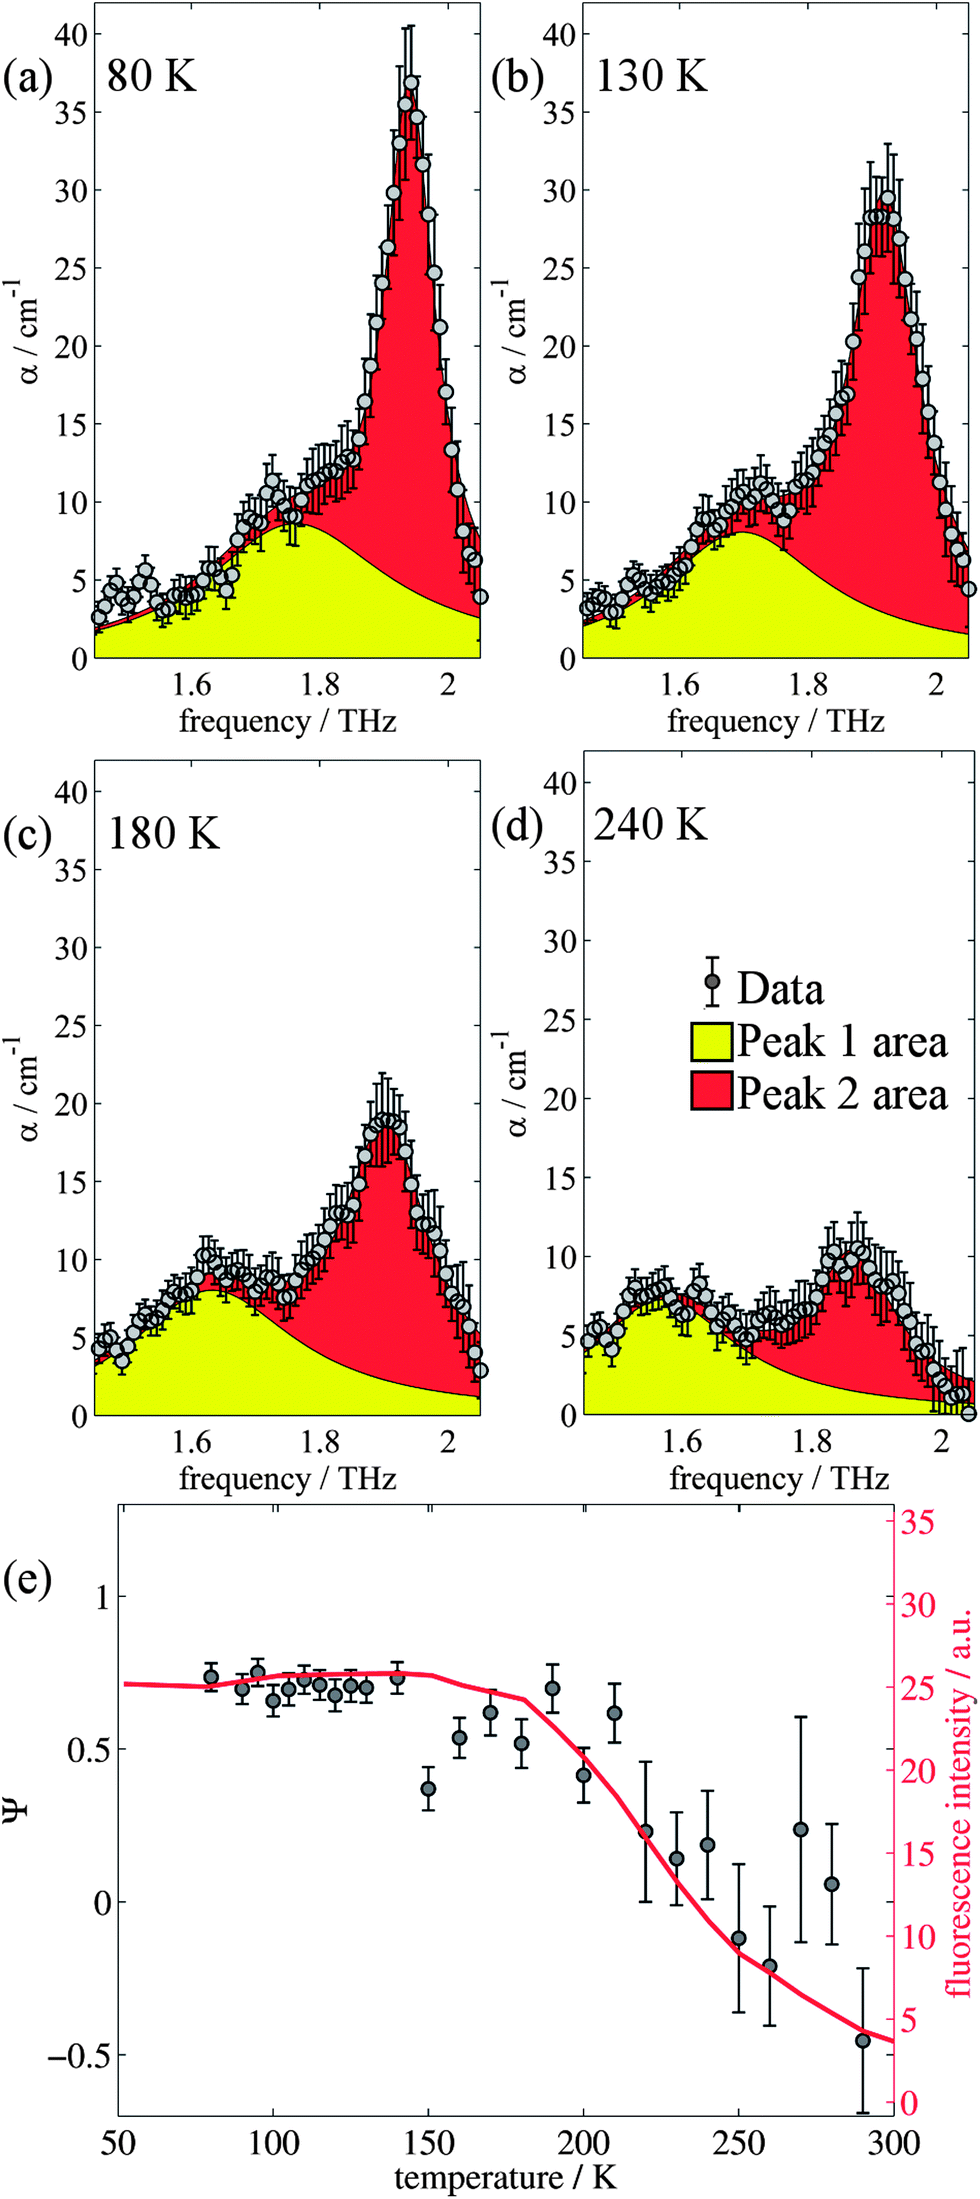 | ||
| Fig. 3 (a)–(d) Two Lorentz function fits to the data for 80 K, 130 K, 180 K, and 240 K respectively between 1.45 and 2.05 THz. (e) Comparison of PL measurements and the relative change in peak size as measured by THz-TDS as a function of temperature. | ||
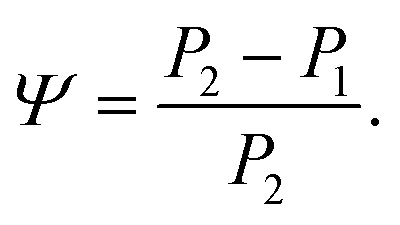
From the fits we extract the relative heights of the two spectral features (independently of each other), which we denote as P1 and P2. At low temperatures, the spectrum has a large P2 component and a relatively small P1 component, whereas at high temperatures, the spectrum has P1 and P2 components that are more similar in intensity. Consequently, the ratio of these values is a way to estimate the relative strengths of the vibrational modes in these regions at a particular temperature. Eqn (1) defines a strength ratio, Ψ, such that:
 | (1) |
Ψ is plotted in Fig. 3(e) for measurements between 80 and 290 K along with the fluorescence intensity measured at the same temperatures. The observed similarity in the evolution of this relative measure of the two features and that of the photoluminescence (PL) fluorescence intensity with temperature is marked. There are some outliers, noticeably at 150 K and also at 270 and 280 K but these can be attributed in part to baseline measurement issues (the former) and difficulties in accurately fitting the function at higher temperatures due to the broadness and overlapping nature of the response. Despite this, there appears to be a compelling correlation between the relative peak intensity and therefore the change in vibrational modes, and the fluorescence of TPE due to the AIE phenomenon. The observation that the fluorescence intensity does not further increase below 150 K is counter intuitive – as the lower temperature decreases separation and thus increased intensity would be expected. Why does the intensity not increase further? We address this question in the next section by examining P2 in more detail.
Uneven conversion of vibrational modes?
Closer inspection of the large low temperature peak (P2) at 1.94 THz reveals a further shoulder at 1.88 THz that increased in intensity with increasing temperature whilst the original main peak decreased in intensity, until the 1.88 THz feature became the dominant mode (at high temperatures). From our observations in the previous section, we deduce that this is due to the conversion of the dominant vibrational mode in this region from the low temperature to the high temperature version; furthermore the vibrational analysis in ESI Table 3† suggested that the vibrations tentatively assigned to this feature are dominated by the ph4 moiety at high temperatures yet display mostly ph2 (and some ph4) character at low temperatures. We therefore performed similar analysis to that done previously, but this time fitted two Lorentz functions to the data between 1.82 and 2.05 THz to observe how this peak changes with temperature. We chose to model this peak using two discrete functions as the high and low temperature structures predicted only a small number of vibrations closely spaced in frequency. Results of this fitting are shown for four of the temperatures in Fig. 4(a)–(d) (the rest are given in the ESI†).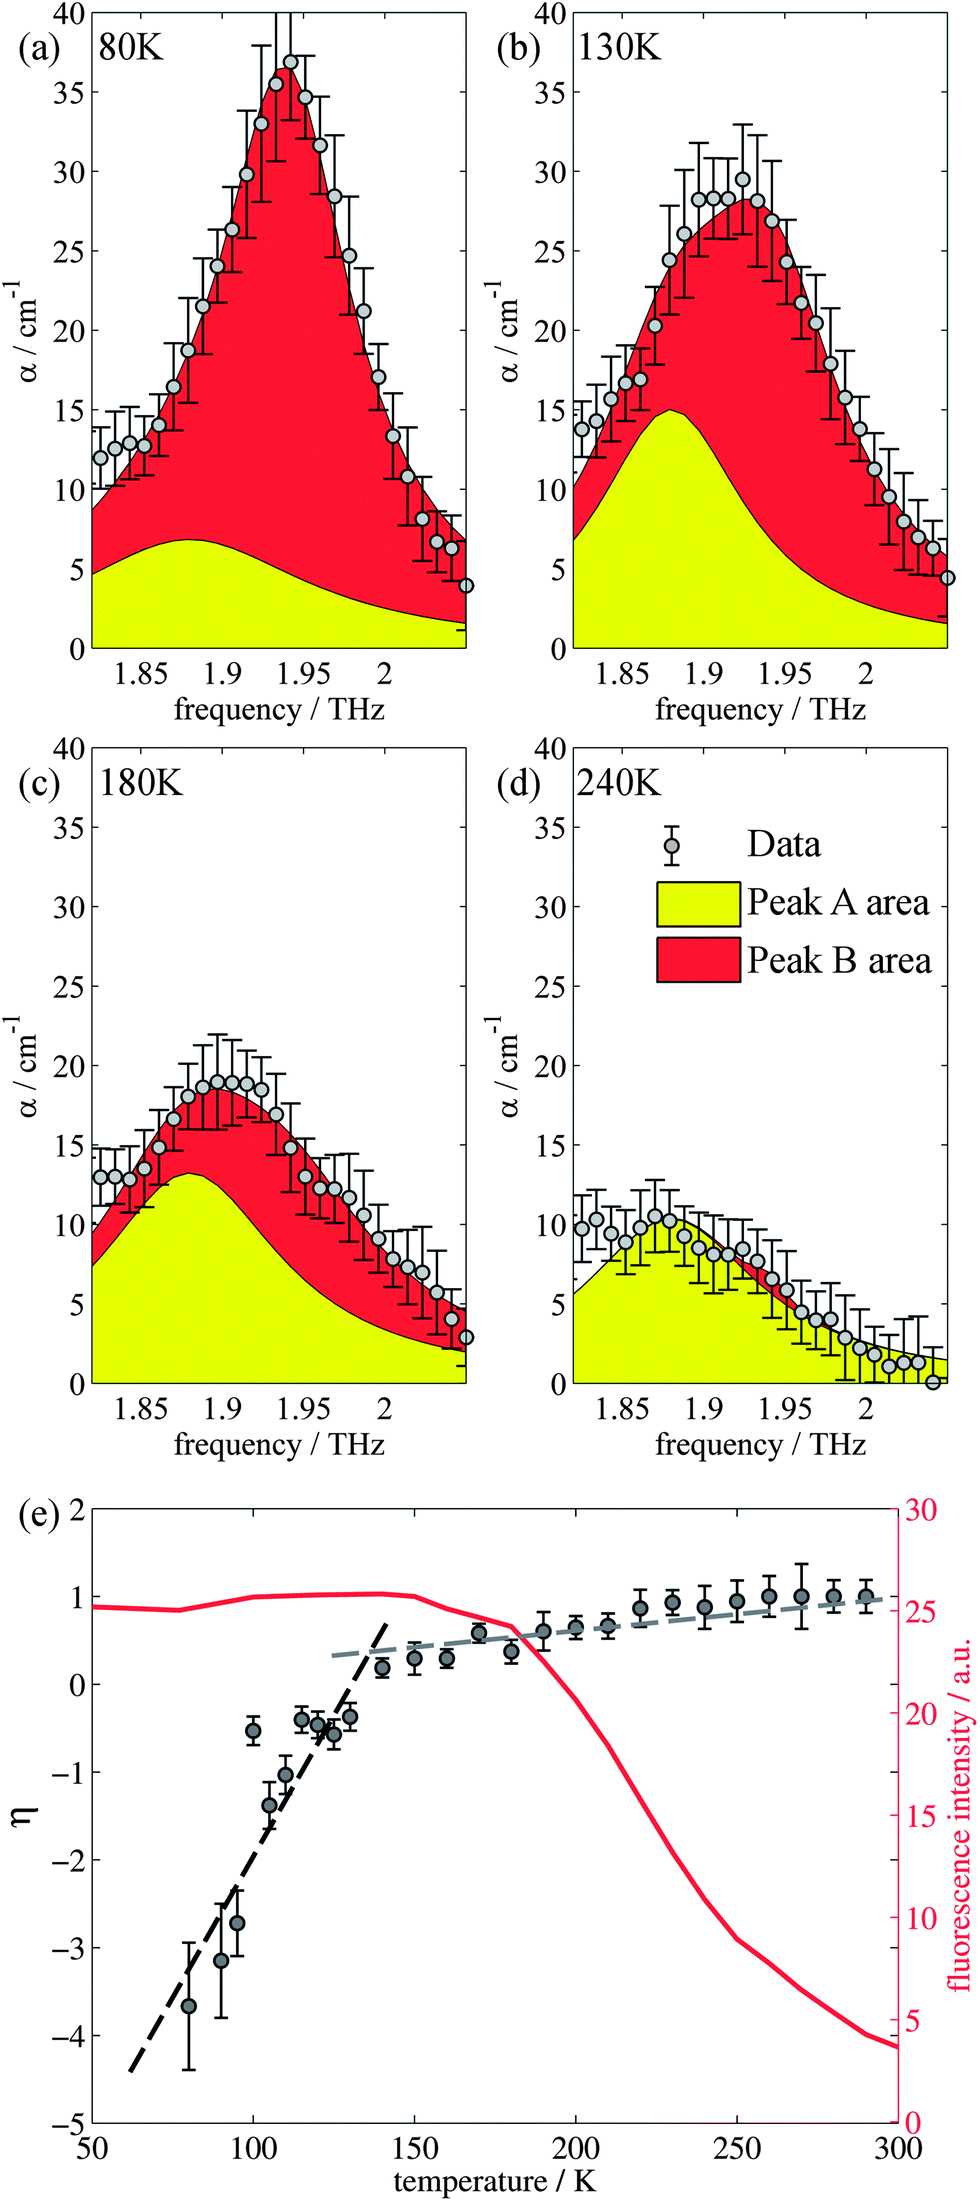 | ||
| Fig. 4 (a)–(d) Two Lorentz function fits to the data for 80 K, 130 K, 180 K, and 240 K respectively between 1.8 and 2.05 THz. (e) Relative change in peak size as measured by THz-TDS as a function of temperature. The PL data is plotted for comparison. | ||
The use of two vibrational modes to fit this peak worked well. In particular it was able to accurately reproduce the asymmetric peak shape observed for the intermediate temperatures (for example at 130 K as shown in Fig. 4(b)). Following a similar theory as in the previous section, we can use a measure of the ratio of the two peak heights to estimate the relative strengths of the high (Pa) and low (Pb) temperature modes:
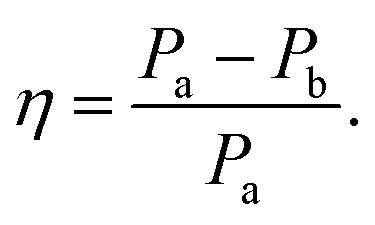 | (2) |
The evidence that the high temperature and low temperature structures are different and not merely a unit cell expanded by different amounts has already been mentioned when the vibrational mode calculations were first introduced. Therefore to understand the results from the terahertz measurements it is useful to return to this observation. Firstly, the unit cell contraction from high to low temperatures is asymmetric, from 9.8370, 9.5017 and 10.7087 Å (a, b, c) for the high temperature structure and 9.7771, 9.1722 and 10.7780 Å (a, b, c) for the low temperature structure, implying that the majority of this compression would occur along the b axis. However, the rms Cartesian displacement of the atoms in the unit cell is very different for the optimized high and low temperature unit cells. When the unit cell is allowed to relax, the resultant low temperature structure is very close to the experimental result (a small rms displacement of 0.11 Å), whereas the high temperature structure alters a lot (a relatively large rms displacement of 0.29 Å). This is indicative of a subtle temperature dependent structural change. Yet the evolution of the terahertz dependent vibrational modes suggests that this structural change is a gradual change, as evidenced by the evolution of particular vibrational features. Whilst a consideration of the overall spectrum reveals a structural evolution consistent with the PL changes, the evolution of a particular vibrational mode has a different temperature dependency.
The two temperature structures differ in the strength and distribution of the London dispersion forces within the unit cell. These intermolecular forces serve to dampen or restrict the intramolecular modes; consequently when the TPE crystal is cooled the force distribution restricts the intramolecular motions of the ph1 moiety (in particular); these are the dominant terahertz features at high temperatures. As a result, the energy losses from the intramolecular rotations of ph1 are quenched. Instead, further energy losses are dominated by rotational modes of the ph2 (and ph4) moieties that are less strong than the ph1 dominated modes. It is the quenching of the ph1 dominated rotations that result in the observed increase in fluorescence, which is consistent with the RIR hypothesis. However, energy losses associated with the modes dominated by the ph2 (and ph4) group remain, a result that appears to be due, in part, to the subtle structural change of the unit cell with temperature. Consequently, there is a point where, despite more contraction of the unit cell further suppressing the ph1 dominated modes, the ph2 (and ph4) dominated modes act to suppress any further fluorescence enhancement, due to their relative freedom, resulting in the plateau in fluorescence intensity observed below 150 K. Again, this observation from the terahertz and the crystal structures provides experimental evidence to support the RIR hypothesis, as we see that if the intramolecular modes are not restricted by intermolecular forces then the fluorescence does not increase.
What is particularly significant about both the terahertz spectral evolution observed herein and the computational calculations undertaken is that it is revealing subtle structural changes which are insufficient to be termed a “phase change”. Despite this, these changes are enough to significantly alter the fluorescent behaviour of the molecule. To our knowledge, previous terahertz spectral studies of this type have focused on following phase changes and dehydration kinetics;25,53,54 this is the first demonstrating the sensitivity to subtle structural evolution that has clearly observable consequences to the material behaviour.
Conclusions
This work represents the first direct evidence of a restriction of intramolecular modes being the dominant mechanism of emission enhancement in AIE molecules. These low frequency modes fall into the terahertz frequency range and so we were able to follow the terahertz spectral evolution of this material with temperature, where we observed a change in the features present in the terahertz spectrum, in particular a 38% increase in the integrated terahertz spectral intensity at high temperature compared to low temperature. The fact that no change was observed upon UV illumination suggested that isomerisation was not occurring, as this would change the TPE spectra. Using structures determined from single crystal X-ray studies at both room and low temperatures, we performed computational simulations of the vibrations using CASTEP and found evidence of a subtle structural evolution with temperature (that hampered the high temperature phonon mode calculations) that predicted the observed change in the terahertz spectra. Furthermore, we observed that the relative heights of two spectral regions appeared to change between low and high temperature, and when the ratio between these was compared with the observed fluorescence intensity we observed a correlation. Using terahertz spectroscopy and computational modelling we found that it is the restriction of intramolecular modes dominated by phenyl group 1 causing the increase in fluorescence intensity, which we believe is the first time such a subtle structural evolution has been quantitatively measured using terahertz spectroscopy. Finally, study of the calculated vibration modes and crystal structures revealed that further enhancement of the AIE effect was hindered by the relative freedom of the phenyl 2 (and 4) group within the low temperature structure, which we hypothesised results from the intermolecular forces felt by the TPE molecule. There remains, however, a complex interplay between an optimum stacking arrangement to restrict intramolecular rotation, and π–π stacking interactions that would lead to other non-radiative energy loss processes.5,55 Nevertheless, these results suggest that the restriction of intramolecular modes, brought about by the subtle temperature-dependent structural evolution, is the dominant enhancement mechanism for the fluorescence behaviour of TPE in the solid state.Acknowledgements
The authors would like to thank Lixia Zhang and Jiannong Wang for their help with the fluorescence measurements, Herman H. Y. Sung and Ian D. Williams for the single crystal structure data, and X. W. Wan and F. Thomas for preliminary discussions. In addition the authors would like to acknowledge the useful comments of the reviewers, and D. Tomerini and A. D. Burnett for useful discussions regarding the computational aspects. This work was partially supported by the RPC grant of HKUST (RPC11SC09), the Research Grants Council of Hong Kong (616611 HKUST2/CRF/10 and N_HKUST620/11), the University Grants Committee of HK (AoE/P-03/08), HKUST project of merit (FSGRF13EG33) and CUHK Direct Grant (4055001). N. Y. T. would like to acknowledge the Agency for Science, Technology and Research for PhD funding.Notes and references
- M. Wang, D. Zhang, G. Zhang, Y. Tang, S. Wang and D. Zhu, Anal. Chem., 2008, 80, 6443–6448 CrossRef CAS PubMed.
- T. Sanji, K. Shiraishi, M. Nakamura and M. Tanaka, Chem.–Asian J., 2010, 5, 817–824 CrossRef CAS PubMed.
- S. Kim, H. E. Pudavar, A. Bonoiu and P. N. Prasad, Adv. Mater., 2007, 19, 3791–3795 CrossRef CAS.
- C.-K. Lim, S. Kim, I. C. Kwon, C.-H. Ahn and S. Y. Park, Chem. Mater., 2009, 21, 5819–5825 CrossRef CAS.
- J. B. Birks, Photophysics of aromatic molecules, Wiley, London, 1970 Search PubMed.
- S. M. Borisov and O. S. Wolfbeis, Chem. Rev., 2008, 108, 423–461 CrossRef CAS PubMed.
- U. Lemmer, S. Heun, R. F. Mahrt, U. Scherf, M. Hopmeier, U. Siegner, E. O. Göbel, K. Müllen and H. Bässler, Chem. Phys. Lett., 1995, 240, 373–378 CrossRef CAS.
- J. Wang, Y. Zhao, C. Dou, H. Sun, P. Xu, K. Ye, J. Zhang, S. Jiang, F. Li and Y. Wang, J. Phys. Chem. B, 2007, 111, 5082–5089 CrossRef CAS PubMed.
- L. Chen, S. Xu, D. McBranch and D. Whitten, J. Am. Chem. Soc., 2000, 122, 9302–9303 CrossRef CAS.
- S. Hecht and J. M. J. Frechet, Angew. Chem., Int. Ed., 2001, 40, 74–91 CrossRef CAS.
- J. Luo, Z. Xie, J. W. Y. Lam, L. Cheng, H. Chen, C. Qiu, H. S. Kwok, X. Zhan, Y. Liu, D. Zhu and B. Z. Tang, Chem. Commun., 2001, 1740–1741 RSC.
- J. Chen, C. C. W. Law, J. W. Y. Lam, Y. Dong, S. M. F. Lo, I. D. Williams, D. Zhu and B. Z. Tang, Chem. Mater., 2003, 15, 1535–1546 CrossRef CAS.
- Q. Peng, Y. Yi, Z. Shuai and J. Shao, J. Am. Chem. Soc., 2007, 129, 9333–9339 CrossRef CAS PubMed.
- S. Yin, Q. Peng, Z. Shuai, W. Fang, Y.-H. Wang and Y. Luo, Phys. Rev. B: Condens. Matter Mater. Phys., 2006, 73, 205409 CrossRef.
- Z. Li, Y. Dong, B. Mi, Y. Tang, M. Häussler, H. Tong, Y. Dong, J. W. Y. Lam, Y. Ren, H. H. Y. Sung, K. S. Wong, P. Gao, I. D. Williams, H. S. Kwok and B. Z. Tang, J. Phys. Chem. B, 2005, 109, 10061–10066 CrossRef CAS PubMed.
- K. Kokado and Y. Chujo, J. Org. Chem., 2011, 76, 316–319 CrossRef CAS PubMed.
- X. Fan, J. Sun, F. Wang, Z. Chu, P. Wang, Y. Dong, R. Hu, B. Z. Tang and D. Zou, Chem. Commun., 2008, 381, 2989–2991 RSC.
- N. B. Shustova, B. D. McCarthy and M. Dincă, J. Am. Chem. Soc., 2011, 133, 20126–20129 CrossRef CAS PubMed.
- Y. Xu, L. Chen, Z. Guo, A. Nagai and D. Jiang, J. Am. Chem. Soc., 2011, 133, 17622–17625 CrossRef CAS PubMed.
- Q. Wu, C. Deng, Q. Peng, Y. Niu and Z. Shuai, J. Comput. Chem., 2012, 33, 1862–1869 CrossRef CAS PubMed.
- M. Nakamura, T. Sanji and M. Tanaka, Chem.–Eur. J., 2011, 17, 5344–5349 CrossRef CAS PubMed.
- N.-N. Liu, S. Song, D.-M. Li and Y.-S. Zheng, Chem. Commun., 2012, 48, 4908–4910 RSC.
- Z. Liu, W. Xue, Z. Cai, G. Zhang and D. Zhang, J. Mater. Chem., 2011, 21, 14487 RSC.
- J. A. Zeitler, P. F. Taday, D. A. Newnham, M. Pepper, K. C. Gordon and T. Rades, J. Pharm. Pharmacol., 2007, 59, 209–223 CrossRef CAS PubMed.
- J. A. Zeitler, P. F. Taday, K. C. Gordon, M. Pepper and T. Rades, ChemPhysChem, 2007, 8, 1924–1927 CrossRef CAS PubMed.
- K. L. Nguyen, T. Friscić, G. M. Day, L. F. Gladden and W. Jones, Nat. Mater., 2007, 6, 206–209 CrossRef CAS PubMed.
- E. P. J. Parrott, J. A. Zeitler, L. F. Gladden, S. N. Taraskin and S. R. Elliott, J. Non-Cryst. Solids, 2009, 355, 1824–1827 CrossRef CAS PubMed.
- E. P. J. Parrott, J. A. Zeitler, G. Simon, B. Hehlen, L. F. Gladden, S. N. Taraskin and S. R. Elliott, Phys. Rev. B: Condens. Matter Mater. Phys., 2010, 82, 140203 CrossRef.
- C. Kang, I. H. Maeng, S. J. Oh, J.-H. Son, T.-I. Jeon, K. H. An, S. C. Lim and Y. H. Lee, Appl. Phys. Lett., 2005, 87, 041908 CrossRef.
- C. Kang, I. H. Maeng, S. J. Oh, S. C. Lim, K. H. An, Y. H. Lee and J.-H. Son, Phys. Rev. B: Condens. Matter Mater. Phys., 2007, 75, 1–5 Search PubMed.
- E. P. J. Parrott, J. A. Zeitler, J. McGregor, S.-P. Oei, H. E. Unalan, W. I. Milne, J.-P. Tessonnier, D. S. Su, R. Schlögl and L. F. Gladden, Adv. Mater., 2009, 21, 3953–3957 CrossRef CAS.
- E. P. J. Parrott, J. A. Zeitler, J. McGregor, S.-P. Oei, H. E. Unalan, S.-C. Tan, W. I. Milne, J.-P. Tessonnier, R. Schlögl and L. F. Gladden, J. Phys. Chem. C, 2009, 113, 10554–10559 CAS.
- A. G. Markelz, S. Whitmire, J. R. Hillebrecht and R. Birge, Phys. Med. Biol., 2002, 47, 3797–3805 CrossRef CAS.
- Y. Sun, Y.-T. Zhang and E. Pickwell-Macpherson, Biophys. J., 2011, 100, 225–231 CrossRef CAS PubMed.
- P. M. Hakey, D. G. Allis, W. Ouellette and T. M. Korter, J. Phys. Chem. A, 2009, 113, 5119–5127 CrossRef CAS PubMed.
- R. Hu, E. Lager, A. Aguilar-Aguilar, J. Liu, J. W. Y. Lam, H. H. Y. Sung, I. D. Williams, Y. Zhong, K. S. Wong, E. Peña-Cabrera and B. Z. Tang, J. Phys. Chem. C, 2009, 113, 15845–15853 CAS.
- Y. Dong, J. W. Y. Lam, A. Qin, J. Liu, Z. Li, B. Z. Tang, J. Sun and H. S. Kwok, Appl. Phys. Lett., 2007, 91, 011111 CrossRef.
- R. Li, J. A. Zeitler, D. Tomerini, E. P. J. Parrott, L. F. Gladden and G. M. Day, Phys. Chem. Chem. Phys., 2010, 12, 5329–5340 RSC.
- O. Hirsch, P. Alexander and L. Gladden, Microelectron. J., 2008, 39, 841–848 CrossRef PubMed.
- G. M. Sheldrick, SADABS, University of Göttingen, Germany, 1996.
- G. M. Sheldrick, Acta Crystallogr., Sect. A: Found. Crystallogr., 2008, 64, 112–122 CrossRef CAS PubMed.
- G. Hua, Y. Li, A. M. Z. Slawin and J. D. Woollins, Dalton Trans., 2007, 1477–1480 RSC.
- S. J. Clark, M. D. Segall, C. J. Pickard, P. J. Hasnip, M. I. J. Probert, K. Refson and M. C. Payne, Z. Krist., 2005, 220, 567–570 CrossRef CAS.
- J. P. Perdew, K. Burke and M. Ernzerhof, Phys. Rev. Lett., 1996, 77, 3865–3868 CrossRef CAS.
- S. Grimme, J. Comput. Chem., 2006, 27, 1787 CrossRef CAS PubMed.
- E. R. McNellis, J. Meyer and K. Reuter, Phys. Rev. B: Condens. Matter Mater. Phys., 2009, 80, 205414 CrossRef.
- G. J. Ackland, M. C. Warren and S. J. Clark, J. Phys.: Condens. Matter, 1997, 9, 7861–7872 CrossRef CAS.
- N.-W. Tseng, J. Liu, J. C. Y. Ng, J. W. Y. Lam, H. H. Y. Sung, I. D. Williams and B. Z. Tang, Chem. Sci., 2012, 3, 493–497 RSC.
- J. van de Streek and M. a. Neumann, Acta Crystallogr., Sect. B: Struct. Crystallogr. Cryst. Chem., 2010, 66, 544–558 CAS.
- A. D. Bond, K. a. Solanko, J. van de Streek and M. a. Neumann, CrystEngComm, 2011, 13, 1768 RSC.
- M. D. King, W. D. Buchanan and T. M. Korter, Phys. Chem. Chem. Phys., 2011, 13, 4250–4259 RSC.
- N. B. Shustova, T.-C. Ong, A. F. Cozzolino, V. K. Michaelis, R. G. Griffin and M. Dincă, J. Am. Chem. Soc., 2012, 134, 15061–15070 CrossRef CAS PubMed.
- H. Liu and X.-C. Zhang, Chem. Phys. Lett., 2006, 429, 229–233 CrossRef CAS PubMed.
- M. Franz, B. M. Fischer and M. Walther, J. Mol. Struct., 2011, 1006, 34–40 CrossRef CAS PubMed.
- B. Valeur and M. N. Berberan-Santos, Molecular Fluorescence: Principles and Applications, Wiley-VCH, Weinheim, 2nd edn, 2012 Search PubMed.
Footnote |
| † Electronic supplementary information (ESI) available: Evidence of the insensitivity of the terahertz measurements to UV illumination, a crystallographic information file (CIF) for the high temperature TPE structure, tables indicating the torsional angles, crystal structure parameters and the full vibrational assignments for the low and high temperature TPE structures, and the full fitting results for the Lorentz fitting functions in Fig. 3 and 4. CDCC973505. For ESI and crystallographic data in CIF or other electronic format see DOI: 10.1039/c3mh00078h |
| This journal is © The Royal Society of Chemistry 2014 |