
 Open Access Article
 This Open Access Article is licensed under a
 Creative Commons Attribution 3.0 Unported Licence
Visualizing oil displacement with foam in a microfluidic device with permeability contrast†
Charles A.
Conn
,
Kun
Ma
,
George J.
Hirasaki
and
Sibani Lisa
Biswal
*
Department of Chemical and Biomolecular Engineering, Rice University, Houston, TX, USA. E-mail: biswal@rice.edu; Fax: +1 7133485478
First published on 31st July 2014
Abstract
Foam mobility control and novel oil displacement mechanisms were observed in a microfluidic device representing a porous media system with layered permeability. Foam was pre-generated using a flow-focusing microfluidic device and injected into an oil-wet, oil-saturated 2-D PDMS microfluidic device. The device is designed with a central fracture flanked by high-permeability and low-permeability zones stratified in the direction of injection. A 1![[thin space (1/6-em)]](https://www.rsc.org/images/entities/char_2009.gif) :1, 1% blend of alpha olefin sulfonate 14–16 (AOS) and lauryl betaine (LB) surfactants produced stable foam in the presence of paraffin oil. The oil saturation and pressure drop across the microfluidic device were measured as a function of time and the injected pore volume, indicating an increase in apparent viscosity for foam with an accompanying decrease in oil saturation. In contrast to the control experiments, foam was shown to more effectively mobilize trapped oil by increasing the flow resistance in the fracture and high-permeability zones and by diverting the surfactant solution into adjacent low-permeability zones. The foam was observed to separate into gas-rich and aqueous-rich phases depending on matrix permeability, suggesting that it is not appropriate to treat foam as a homogeneous dispersion of gas and liquid.
:1, 1% blend of alpha olefin sulfonate 14–16 (AOS) and lauryl betaine (LB) surfactants produced stable foam in the presence of paraffin oil. The oil saturation and pressure drop across the microfluidic device were measured as a function of time and the injected pore volume, indicating an increase in apparent viscosity for foam with an accompanying decrease in oil saturation. In contrast to the control experiments, foam was shown to more effectively mobilize trapped oil by increasing the flow resistance in the fracture and high-permeability zones and by diverting the surfactant solution into adjacent low-permeability zones. The foam was observed to separate into gas-rich and aqueous-rich phases depending on matrix permeability, suggesting that it is not appropriate to treat foam as a homogeneous dispersion of gas and liquid.
1. Introduction
Poor sweep and recovery in gas flooding and enhanced/improved oil recovery (EOR/IOR) arises from gravity override, viscous fingering, and channeling through reservoir heterogeneities.1 Because the displacing fluid (gas) often has a significantly lower viscosity than the displaced fluid (oil), it tends to flow through high-permeability zones and bypass trapped oil in adjacent low-permeability zones.2 Poor sweep is common in the case of a fractured porous medium, which can have fracture-matrix permeability contrast ratios of 1000 or more, depending on fracture penetration and orientation.3 One strategy to improve EOR/IOR performance is to utilize foam, a dispersion of gas in continuous liquid, which lowers the mobility ratio (M):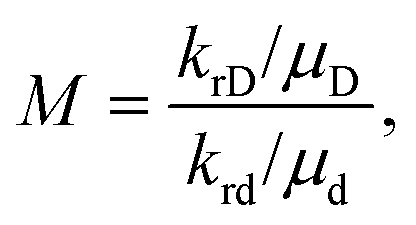 | (1) |
There are several mechanisms by which foam is generated in porous media: snap-off, lamellae division, and leave-behind are the classic examples. Liontas et al. recently showed evidence of an additional foam generation mechanism whereby bubbles impinging on other bubbles moving through a pore throat can pinch off new bubbles.4 The goal of a foam injection strategy is to generate foam that creates flow resistance in the high-permeability regions and diverts injected fluid to adjacent low-permeability regions that harbor trapped oil.
Foam has shown improved sweep and recovery in a number of laboratory- and field-scale experiments.5,6 In heterogeneous systems there is particular interest in the interaction between the fractures and the matrix.7–11 Porous media micromodels in silicon,12,13 glass,11,14 PDMS,2 and other polymer devices15,16 have been used to better understand multiphase fluid transport at the pore-level scale. Micromodel systems allow real-time, in situ observation of relevant fluid transport in complex systems involving multiple phases, pore geometries,17–19 and fractures.11,20Fig. 1 shows a reservoir section analogous to the micromodel used in this work, along with a micrograph of the porous media microfluidic device.
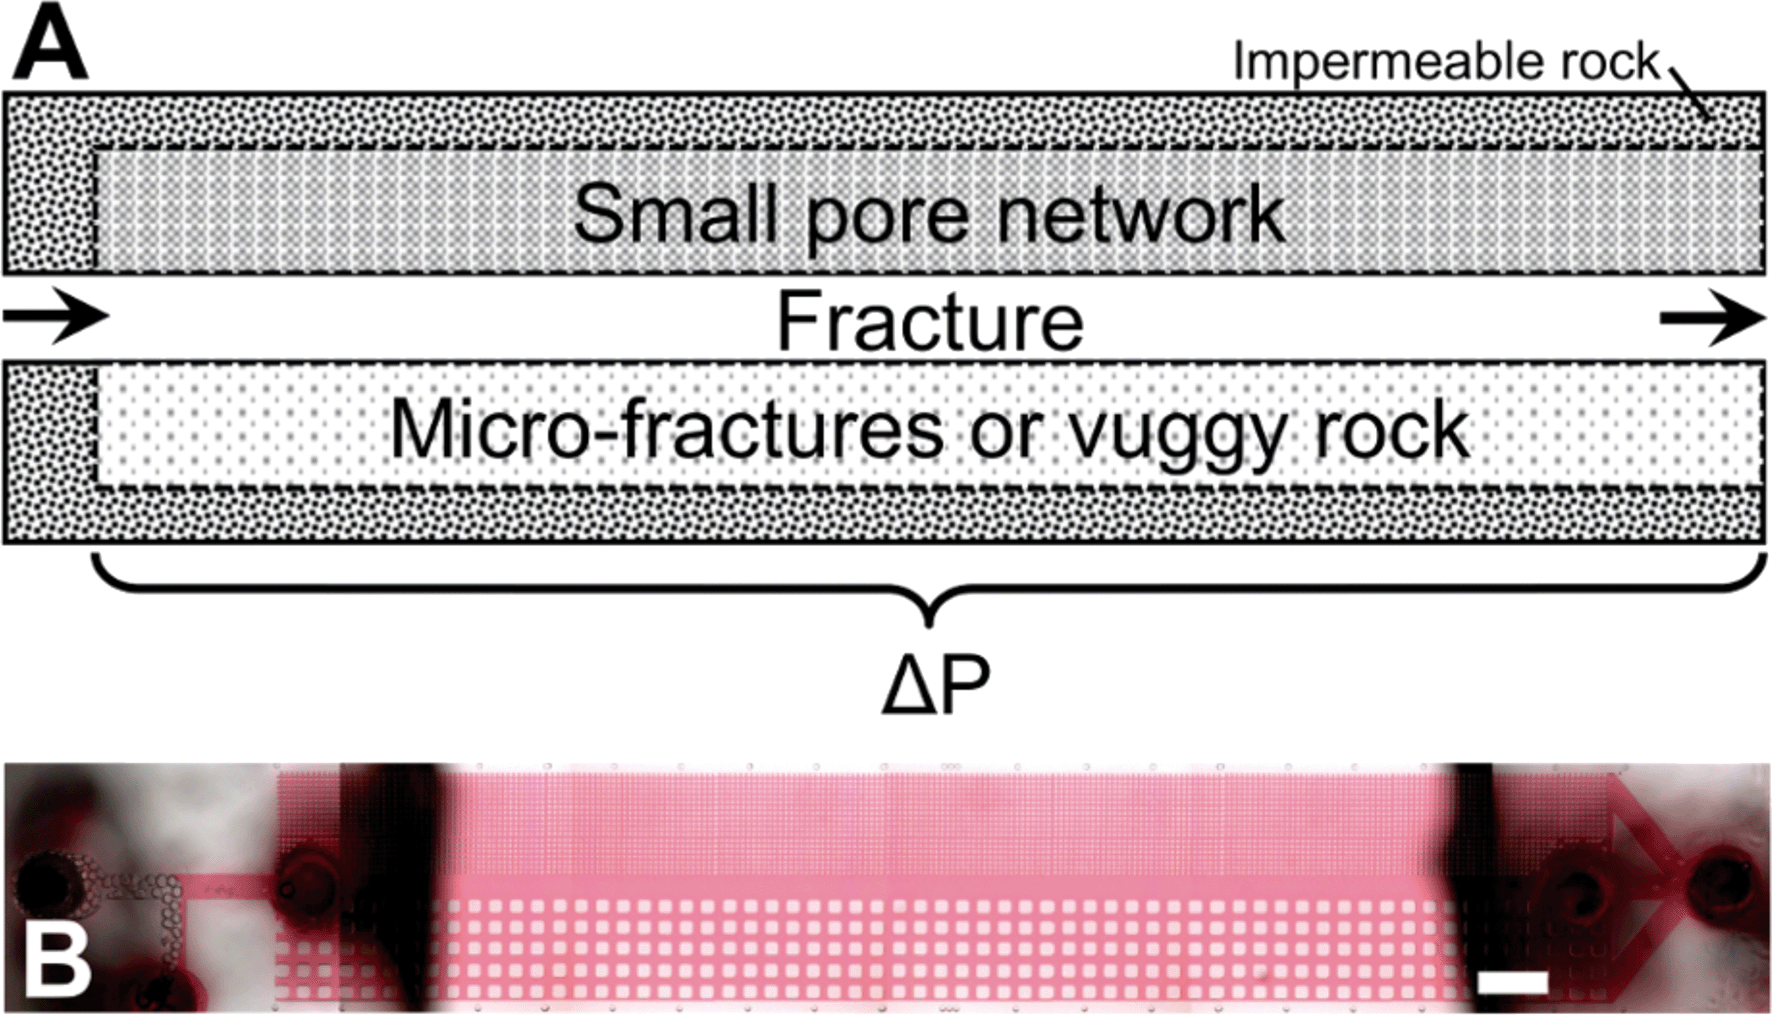 | ||
| Fig. 1 A) Conceptual schematic of an analogous reservoir section. B) Stitched-image micrograph of the PDMS micromodel used in this work, saturated in oil (pink). Scale bar is 1 mm. | ||
In foam studies, the confined geometry of microfluidic devices allows well-controlled foam generation with tunable foam texture (bubble size), foam quality (gas fraction), and flow rates (pore-volume throughput). Ma et al. have previously demonstrated improved mobility control when using foam in the displacement of water from a water-wet micromodel.2 Though several studies have examined binary wetting/non-wetting fluid systems in porous media, it is still unclear how a multi-phase (oil/water/gas) system behaves, especially in fractured systems. As yet there is no complete and rigorous understanding of the mechanisms that govern foam transport in porous media; hence, we provide direct visual observations of relevant foam transport and oil displacement phenomena in porous media. This paper extends the understanding of foam behavior in porous media with (1) a multi-phase (oil/water/gas) system, (2) an oil-wet microfluidic device, (3) different parallel permeability layers, and (4) stable foam in the presence of oil.
2. Materials and methods
2.1. Design and fabrication of the microfluidic device
Two microfluidic devices were used in this work: one to pre-generate foam and the other to observe fluid transport and oil displacement in porous media. Microfluidic devices were prepared via a standard soft lithography process.21 Approximately 4 mL SU-8 50 photoresist was deposited on a fresh 100 mm test-grade silicon wafer (University Wafer) and spin-coated to a thickness of 50 μm.22 The photoresist was cured in a pattern (designed in AutoCAD LT 2010) with UV light via a maskless lithography machine (Intelligent Micro Patterning SF-100, 5 × 5 μm per pixel) and developed using propylene glycol methyl ether acetate (Spectrum Chemical). Poly(dimethyl siloxane) (Slygard 184 PDMS in a 1:10 crosslinker to elastomer ratio) was deposited on this master pattern and cured in an oven at 80 °C for 1 h, peeled off, cut, and hole-punched for tubing (Uni-Core 45 μm, Harris). PDMS stamps and PDMS-coated glass microscope slides (spin-coated at 5000 RPM for 30 s) were then exposed to oxygen plasma (Harrick Plasma) for 20 s and irreversibly bonded. Polyethylene tubing (PE/3, Scientific Commodities) was added and secured with epoxy (extra fast setting, Hardman). Porous media micromodels were flushed with a dyed paraffin oil (CAS 8012-95-1, VWR) and allowed to rest for 24+ hours to undergo hydrophobic recovery in the presence of oil.23 Paraffin oil was chosen as a model oil because it does not significantly swell PDMS and has a moderate viscosity of 25 cP. At the conditions used in these experiments, the PDMS did not deform under pressure or swell due to solvent imbibition. Foam-generating devices used uncoated glass slides (no PDMS) and were immediately flushed with DI water following bonding to retain hydrophilicity.2
2.2. Experimental procedures
Foam was pre-generated via a flow-focusing microfluidic design, which produced monodisperse bubbles in series prior to injection into porous media. Adjusting the supplied fluid flow rates (syringe pump or gas pressure regulator) allowed tunable foam quality and texture (volumetric gas:liquid ratio and bubble size).24 A flow-focusing design squeezed the gas and surfactant solution through an orifice at sufficient shear rates to pinch off bubbles. These bubbles flowed single-file to the transfer tubing connecting the foam generator and micromodel. The transfer tubing diameter, tubing length, surfactant, and injected fluid flow rates were designed for minimal foam destruction en route to the porous media micromodel.
The gas and liquid flow rates were set low enough that pressure drops were representative of the values observed in actual reservoir systems and with a gas to liquid ratio and total flow rate both high enough to ensure that the foam did not phase-separate or undergo significant gravity drainage in the transfer tubing. Typical flow rates were 0.05–1.00 mL h−1. Injected fluids included single-phase water (water flood control), surfactant solution (surfactant flood control), single-phase gas (air flood control), water/gas co-injection (analogous to WAG), and foam. We framed the water/gas co-injection as a water-alternating-gas (WAG) experiment because at the microscale, air and water injected without surfactant phase-separated into alternating slugs. Simulations have shown that the apparent viscosity resulting from WAG injection approaches the apparent viscosity of co-injection as the WAG slug size decreases.25 Inversely, in this paper, co-injection creates micro-slugs; however, this distinction emphasizes the phase separation observed at the pore scale and its effect on oil displacement.
Because the bubbles had a characteristic diameter larger than the micromodel channel depth (squished disks), individual bubbles could be distinguished and quantified, with the caveat that this system cannot represent the true “bulk” foam that may be found in large-aperture natural fractures because the fracture in this micromodel is more akin to a thin slit. In the high-permeability matrix, the pore-throat was twice the channel depth (105 μm), and in the low-permeability matrix, the pore-throat was half the channel depth (20 μm). Both matrix regions had tapered-corner square grains arranged in a square lattice (Fig. 2). Permeabilities are much higher than those found in reservoir rock, however they are typical of EOR micromodel experiments. High permeabilities are the result of a grain spacing chosen to allow fluids to be visualized at a scale that can both distinguish fluid phases in the narrow pore throats and also capture the overall behavior and interaction of all three permeability zones simultaneously.26,27 To minimize capillary end effects, which cause liquid retention in porous media immediately before an increase in permeability, the micromodel is long in the direction of flow, and data from the region near the outlet were not analyzed.28
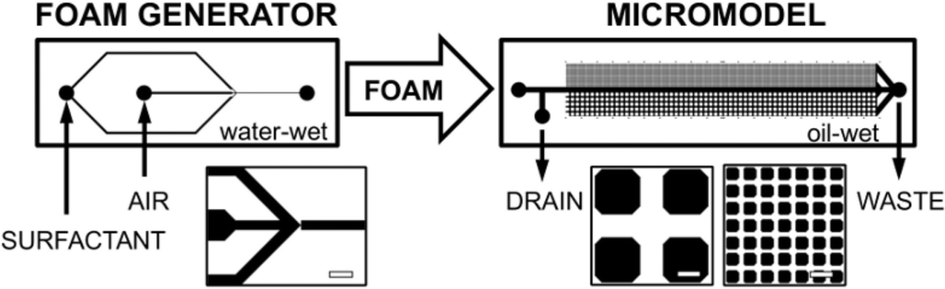 | ||
| Fig. 2 Schematic of experimental set-up. A water-wet PDMS flow-focusing microfluidic device pre-generated foam that was transferred to an oil-wet PDMS porous media micromodel pre-saturated with oil. Close-ups show the flow-focusing geometry, high-permeability, and low-permeability matrix samples. Scale bars are 100 μm. | ||
Prior to the experiment, pre-generated foam and dyed paraffin oil (Oil Red O, saturated, filtered 0.45 μm) were injected from opposite ends of the micromodel so that both substrates flowed out the drain until stable foam developed in the transfer tubing. Oil injection at this time provided a slight backpressure so that surfactant could not adsorb onto the porous media before the experiment commenced. “Stable foam” was defined by a lack of visible liquid separation in the transfer tubing and the observation of consistent bubble sizes at the entrance. Data collection began when the drain tubing was clamped and the outlet was opened to atmospheric pressure. The output was collected using a glass vial. A new micromodel was used for every experiment involving surfactant to eliminate possible alterations of the surface wettability due to surfactant adsorption. Each experiment lasted approximately 15 minutes.
The surfactant solution comprised a 1:1 mixture of 1% alpha olefin sulfonate 14–16 (AOS) and 1% lauryl betaine (LB), both adjusted to the ionic strength of seawater with NaCl. This surfactant was chosen because it showed good foam stability even in the presence of paraffin oil, but it was not optimized for low interfacial tension with the oil. Interfacial tensions (IFTs) between the three phases were measured using a pendant drop method (CAM 200, KSV)29 and found to be γgw = 19.00 ± 0.13 mN m−1, γgo = 21.76 ± 0.02 mN m−1 for oil–air, and γow = 1.16 ± 0.01 mN m−1, where the subscripts g, w, o, represent the air, surfactant solution, and oil phases, respectively. The addition of red dye (Oil Red O) to the oil phase was not observed to affect the surfactant-oil interfacial tension.
Pressure data were recorded using a pressure transducer with a 0–3.2 psi diaphragm (P61, Validyne). Additional holes were punched in the micromodel at the porous media entrance and exit, and polyethylene tubing was inserted and secured with epoxy. Because trapped bubbles can result in signal lag, the pressure tubing and transducer chambers were flushed with paraffin oil until air ceased to exit the bleed valve screw holes and then sealed. Pressure data were recorded via MATLAB script every 0.1 s for the duration of each experiment. The total pressure drop across the 20 cm micromodel was typically 0–1.8 psi (max 2.9 psi ft−1), with foam floods exhibiting the highest pressures.
2.3. Analysis
The oil saturation was determined via image processing of recorded video in MATLAB with the assumption of a 2-D fluid system. Each pixel was assumed to represent a single-phase fluid volume (no vertical fluid overlap in the 50 μm channel depth), with pink pixels representing oil. For each low-permeability, high-permeability, and fractured section, the fraction of oil present was calculated by dividing the current oil pixel count by the initial oil pixel count when completely saturated with oil (immediately prior to experimentation). Pink pixels representing oil were identified by subtracting the video's green channel from the red channel and applying a threshold cutoff. This procedure corrected for brightness and gave a good contrast compared to the background. The appropriate threshold value was selected by comparing the original and threshold images, to produce the best visual interpretation of the remaining oil. Minor errors in quantifying oil saturation may have arisen from the curved fluid interfaces, which displayed light-refracted “rainbow” artifacts (pink pixels that are not oil) or thick lamellae (more prominent in gas/oil interfaces), and from poorly distinguishing the oil's pink color (this error was minimized by maintaining identical microscope illumination and contrast settings across experiments). Despite these uncertainties, the quantified oil saturation values showed good agreement with visual interpretations of the remaining oil.3. Experimental results
3.1. Overview of oil displacement
In contrast to all control floods (water flood, gas flood, and WAG), foam was the only injection that effectively displaced oil from the low-permeability zone. Oil displacement and injected sweep comparisons for the water flood, WAG, and foam cases after 4 min are shown in Fig. 3. Without the mobility control provided by foam, oil (red) was displaced only from the most permeable regions: the fracture and the high-permeability zone. Water flooding was unable to overcome the capillary entry pressures of the matrix regions except at high flow rates. Foam provided good sweep and displacement of oil in both high-permeability and low-permeability zones. The trends in total oil saturation were similar to the trends in core and sandpack experiments in the literature;30,31 however, the micromodel experiments in this work could resolve the source of produced oil in a heterogeneous system.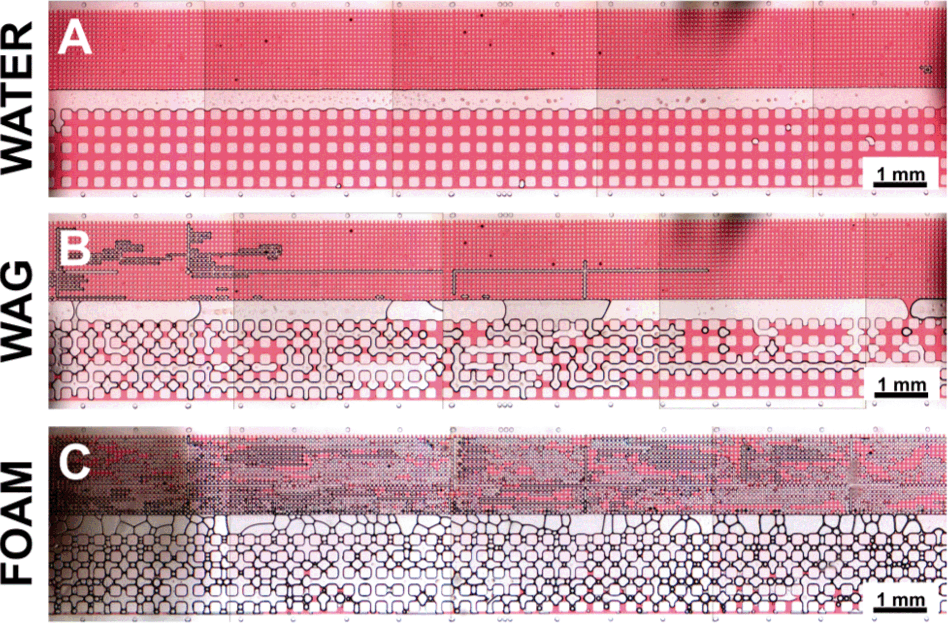 | ||
| Fig. 3 Stitched-image comparisons of A) water flooding, B) water/air flooding without surfactant (WAG), and C) foam flooding at 4 min. Areas of red indicate unswept oil. The liquid flow rate and gas pressure were set to 0.05 mL h−1 and 200 mbar, respectively. | ||
Traditional experiments cannot directly show how oil is displaced differently in each permeability zone and how different sweep profiles emerge using different injection schemes. Fig. 4 shows oil saturation vs. time (or pore volume) in each permeability region. Water flooding displaced oil only from the fracture. WAG flooding resulted in better recovery, but oil tended to be mobilized only when water slugs increased resistance in the most permeable regions; otherwise, injected fluids streamed past the trapped oil. Foam flooding displaced oil best in all regions and was the only injection scheme able to effectively displace oil from the low-permeability matrix. This experiment showed direct visual details of multi-phase fluid transport during the foam displacement of trapped oil in an oil-saturated, oil-wet system with stratified permeability zones. Videos illustrating oil displacement using water, foam, and WAG injection strategies are provided in ESI.†
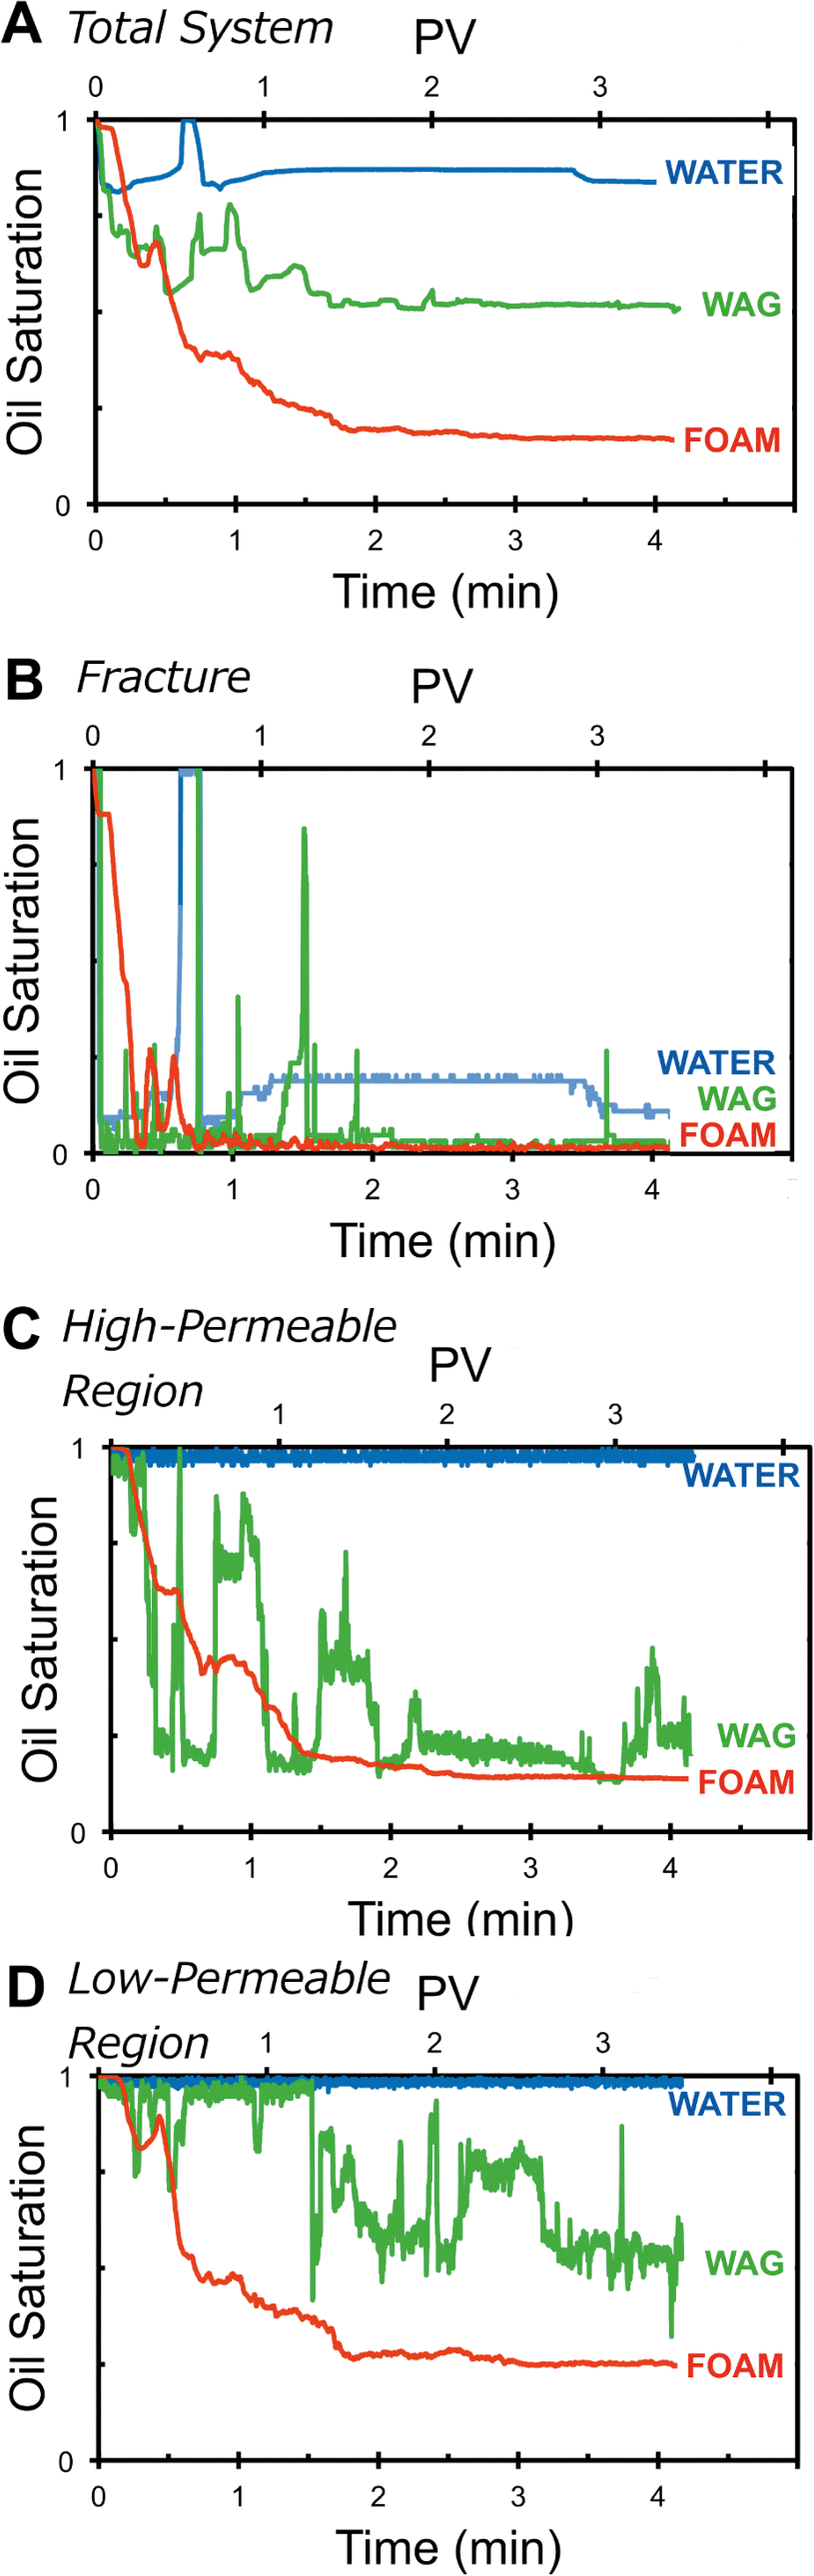 | ||
| Fig. 4 Oil saturation measured as a function of time (bottom axis) and pore volume (PV, top axis) for various regions of the micromodel. A) The overall micromodel, B) the fracture region, C) the high permeable matrix, and D) the low permeable matrix. Foam is best able to reduce oil saturation in the low-permeable region. | ||
3.2. Fracture zone
In all experiments, the fracture was swept immediately and completely, as it was the most permeable zone. In the water flooding control experiment, only oil in the fracture was displaced: the rest remained trapped in the porous matrix. After the initial waterfront passed through the fracture, the trailing water stream would “thin” from the edges of the fracture in some experiments as oil was imbibed due to the micromodel's oil-wet surface (the increase in fracture oil saturation from 1 to 3 PV for the water flooding case is due to oil-favorable wettability). For WAG, spikes in the fracture oil saturation are due to slugs of oil entering the microscope's limited field of view from upstream. In general, there was no oil in the fracture after the initial injection front passed, though oil occasionally entered the fracture from the matrix due to local pressure fluctuations.3.3. High-permeability zone
The high-permeability region flooded after the fracture. The capillary entry pressure for the pore throats in the high-permeability region must be exceeded to displace the oil. For the water flooding experiments, this process required higher flow rates; otherwise, water streamed only through the fracture. The WAG injection streamed gas through the fracture until an occasional slug of water passed through, which then increased the local pressure enough to divert some fluid into the high-permeability matrix. Though WAG injection ultimately improved the displacement of oil from the high-permeability region, it came at the cost of wasting large volumes of injected fluid. Water and air phase-separated into streams in the high-permeability region and bypassed much of the adjacent oil. Residual oil lamellae were abundantly observed along the flow direction. Foam was the most efficient at displacing oil from the high-permeability region, resulting in only 13.7% oil saturation after 4 minutes, compared to 97.6% for water flooding and 24.2% for WAG.3.4. Low-permeability zone
The low-permeability matrix was the most difficult region to sweep and represented the most interesting zone to consider for EOR applications. In the water flooding control experiment, no oil was displaced from the low-perm region. Even at extremely high flow rates, which would be unrealistic in an actual reservoir, water could displace oil only from microfractures, which are defect regions with slightly wider pores (see Fig. 5). WAG flooding occasionally pushed into the low-permeability region but was also constrained to those microfractures and the few pores immediately downstream, bypassing most of the oil. This phenomenon illustrates just how sensitive the non-wetting fluid path is to capillary effects. A marginally wider pore spacing can allow fluid to bypass adjacent oil. Furthermore, this micromodel represents permeability contrasts at the lower limit: in real heterogeneous (or fractured) reservoirs, higher permeability contrasts would exacerbate this problem.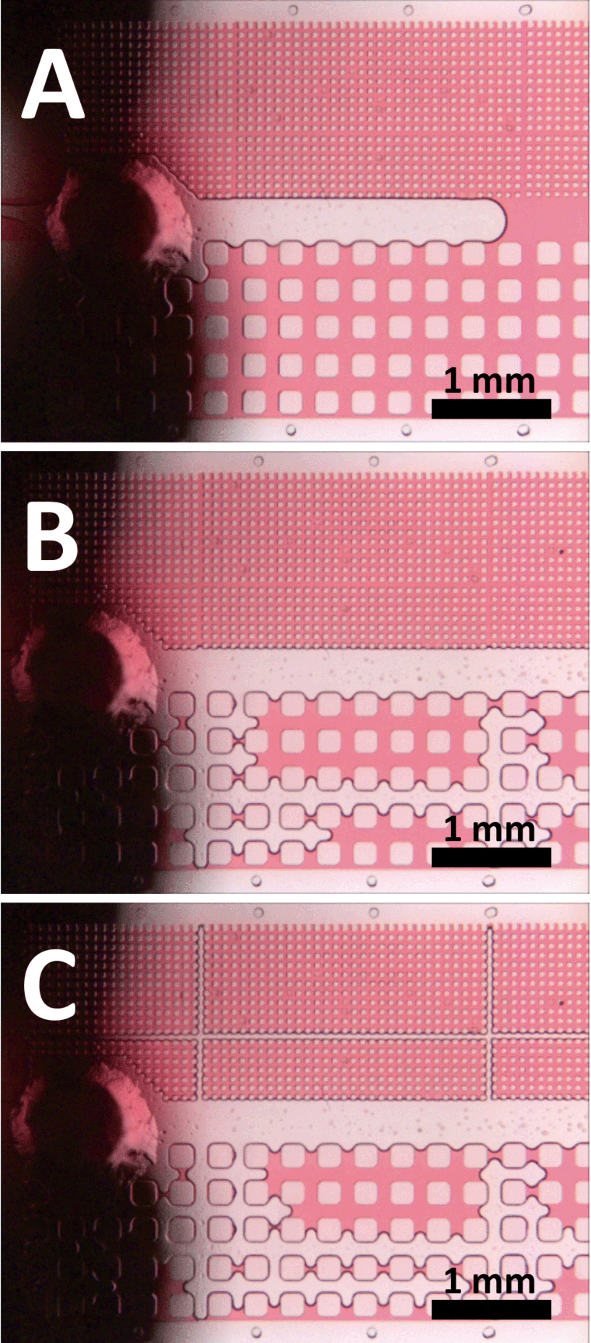 | ||
| Fig. 5 Time series A) 5 s, B) 10 min and C) 15 min of the water flooding control experiment, showing the displacement of each permeability zone as the injection flow rate was increased and pressure exceeded the capillary entry pressure (see videos). No oil could be displaced from the low-permeability region with water flooding except in the in the region which has slightly wider pore throats (C). | ||
Foam injection swept the most oil from the low-permeability region; however, foam phase-separation was observed, suggesting that the majority of low-permeability oil displacement occurred due to the liquid fraction of the foam. Foam left only 25.1% oil saturation remaining in the low-perm region after 4 min (~3.2 PV). Foam clearly showed superior oil displacement in the least permeable region, where most trapped oil is expected to remain after secondary recovery (water flooding).
Foam was shown to mobilize significantly more oil than both water flooding and gas flooding (only 25.1% oil saturation after 4 min vs. 53.0% for WAG and 98.3% for water flooding). These trends are consistent with similar micromodel and core32 studies, as well as with current understandings of foam behavior.33 These microscale observations at the pore-length scale help elucidate the mechanisms responsible for the large differences observed in recovery for water floods, gas floods, WAG, and foam floods on the macro-scale. Additionally, we demonstrate superior performance by foam compared to water/air co-injection under the same conditions as the foam injection but without surfactant (analogous to WAG).
4. Discussion
4.1. Minimum capillary entry pressure
Fluid transport in our micromodel is dominated by the capillary entry pressure (CEP), the critical pressure drop needed for fluid to move through a constriction (pore) and overcome interfacial tension:34| PC = γ(1/R2 + 1/R1), | (2) |
 | (3) |
 | (4) |
| Pore throat | Porosity | Permeability | Measured critical displacement pressure for air | Measured critical displacement pressure for surfactant | |
|---|---|---|---|---|---|
| Fracture | 380 × 50 μm | — | 223 darcy | <0.01 psi | <0.01 psi |
| High-permeability | 105 × 50 μm | 39.7% | 47 darcy | 0.13 psi | 0.02 psi |
| Low-permeability | 20 × 50 μm | 27.5% | 24 darcy | 0.23–0.46 psi | 0.03–0.60 psi |
A control experiment with increasing water flow rates (increasing a pressure drop across the micromodel) demonstrated critical displacement pressure intuitively: as an oil-filled micromodel was injected with water, the fracture was swept first, then the high-permeability region, and finally the low-permeability region at extremely high pressure drops. Air floods behaved similarly to water floods but required higher critical displacement pressures.
Fig. 5 shows a time series of the water flood control experiment. Note that the low-permeability matrix is invaded only in a grid pattern of slightly wider pores. The relationship between fluid transport and capillary entry pressure is emphasized by the flooding of these microfractures before the rest of the low-permeability pores are swept. Pore-throat size irregularities necessitated denoting critical displacement pressures in Table 1 as a range for the low-permeability region instead of the single critical displacement pressure expected for a homogeneous matrix. In more heterogeneous porous media, we would also expect a range of critical displacement pressures due to the variety of pore sizes and capillary entry pressures.
Foam promotes local pressure gradients orthogonal to the dominant flow direction so that as bubble trains in the fracture build up pressure,34 fluid can push into adjacent low-perm regions that were previously inaccessible to single-phase injected fluids incapable of creating such pressure gradients. Higher local pressure gradients mean that more pores' capillary entry pressures are exceeded, allowing fluid to mobilize and ultimately displace more trapped oil.
In actual reservoir systems, the absolute pressure is higher, and hence, a compressible fluid such as gas will be denser. Density has a notable effect on reservoir sweep efficiency such as gravity override. Since our system is two-dimensional in the horizontal plane we expect gravity-related effects to be negligible. Interfacial tension, velocity, and surface wettability are all independent of density; hence capillary-dominated phenomena should exhibit similar behavior even at higher absolute pressures with denser invading fluid.
Periodic, cyclical pressure behavior developed when both large and small bubbles flowed through the fracture: a bubble train of small bubbles in the fracture increased resistance to flow (increased the apparent gas viscosity) and slowed down the fluid velocity within the fracture to divert fluid just upstream of the bubble train into the matrix. At this point, localized pressure gradients were highest, and it was most likely that the pressure would increase enough to exceed the critical capillary entry pressure required to enter the matrix. Recorded videos showed that fluid movement in the matrix was correlated with slow-moving bubble trains (indicating pressure build-up) in the adjacent fracture (see foam flood videos in ESI†). This mechanism helps to explain how foam can mobilize fluids in low-permeability zones adjacent to high-permeability zones.
Though single-pore pressure drops are difficult to measure in situ, the overall pressure behavior can give insight into pore-scale phenomena. Foam flooding showed an increased pressure drop across the entire micromodel compared to water flooding, gas flooding, and water-and-gas co-injection without surfactant (WAG). Fig. 6 shows that a greater pressure drop occurred for foam flooding than for WAG flooding. Control experiments had identical injection conditions to the foam case (i.e., the only difference between foam and WAG experiments was the lack of surfactant).
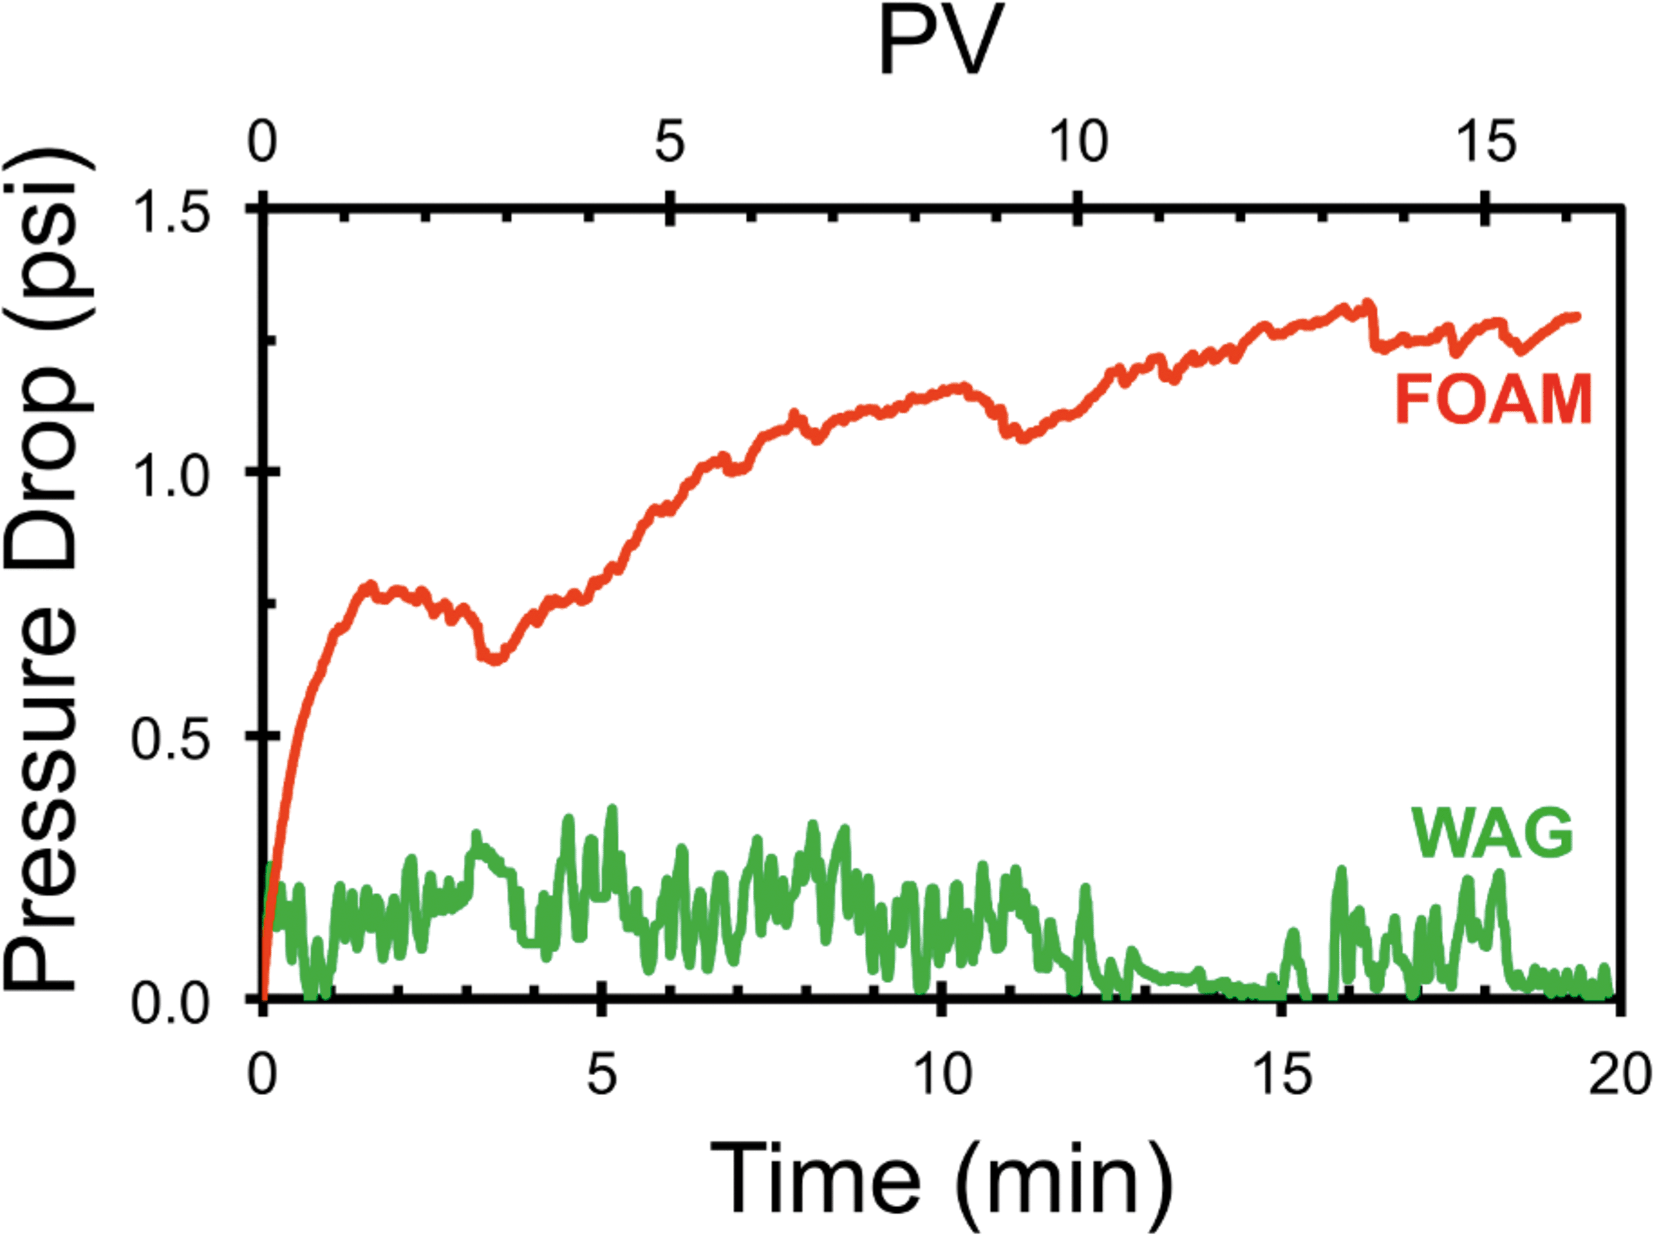 | ||
| Fig. 6 Measured pressure drop across the micromodel for foam compared to water-and-air co-injection without surfactant (WAG). Foam had a higher apparent viscosity than observed when using the same injection conditions without surfactant. | ||
In general, the measured pressure drop increased as phase interfaces built up between pressure taps; even in single-phase flooding, it was observed that the measured pressure spiked when an injected stream was made discontinuous by oil. The lowest pressure drops were observed when a continuous single-phase fluid spanned both pressure taps, even when flowing at high velocity. The highest pressure drops were observed with foam, in which gas trapped in bubbles reduced the gas-phase relative permeability, and lamellae caused resistance, which increased the apparent viscosity. The result was a decrease in the mobility ratio and improved sweep efficiency and oil displacement.
Sweep effectiveness is related to the viscosity of the displacing phase: a higher viscosity results in a lower mobility ratio and better overall sweep. Though foam is a dispersion of separate phases, it is sometimes treated as a single phase with an effective (“apparent”) viscosity. The apparent viscosity μapp of a fluid moving through porous media is given by:
 | (5) |
When comparing foam and gas flood experiments, note that for foam, (1) the measured pressure drop will be higher; (2) the gas velocity will be slower (due to bubble blocking); and (3) the relative permeability will either decrease or stay the same but cannot increase (due to multi-phase competition for flow paths). These factors all contribute to an increase in the injected-phase apparent viscosity, which helps to explain the mechanisms of mobility control with foam.
4.2. Foam phase separation
Previous studies have indicated that foam could effectively control surfactant transport in layered sandpacks with a significant contrast in permeability.33 In this paper, we demonstrate fine control of fluid transport at the pore level and with a much smaller permeability contrast between layers since the fracture is only 2.5 times more permeable than the high-perm matrix. At the center of the micromodel, we observed that the initial foam front in the low-perm region was surfactant solution only, with no gas bubbles. To understand why no gas entered the low-permeability matrix initially, the upstream “entry” region of the micromodel was observed during the beginning of a foam sweep, shown in Fig. 7.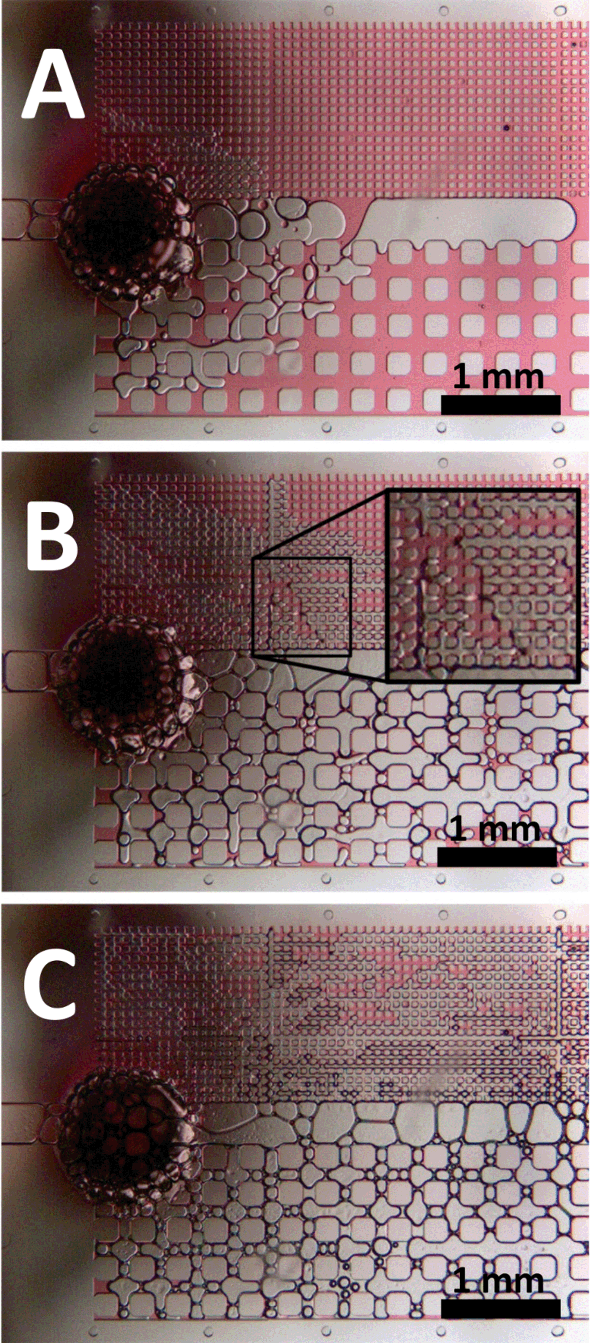 | ||
| Fig. 7 Time series A) 15 s, B) 30 s and C) 4 min 30 s of foam phase-separating at the entrance to the micromodel. The liquid portion of foam (surfactant) was diverted into the low-permeability matrix due to resistance from bubbles in the fracture and high-permeability regions. The image inset in B shows oil and surfactant but no gas in the low-permeability region. Bubbles are distinguished by their thick, dark lamellae. Pressure gradients between the fracture and matrix were highest at the micromodel entrance, where most fracture/matrix fluid exchange occurred. The dark hole is the upstream pressure tap. | ||
At the entrance to the micromodel, the foam phase-separated. Surfactant solution invaded the low-perm microfractures and then continued through the low-permeability matrix. The pressure gradient from the fracture into the matrix was highest at the micromodel entrance. Downstream, there was no pressure gradient between the fracture and matrix; the dominant pressure gradients in all layers were parallel to the fracture in the direction of flow. There was no driving force to push fluid from the fracture into the matrix or to push oil from the matrix into the fracture. In a sense, this arrangement of stratified permeability layers (in the direction of flow) makes it difficult to establish pressure gradients between the fracture and matrix. In the absence of bubbles causing local pressure gradients and diverting flow, there would be no mechanism to mobilize fluids between the fracture and matrix. Fractures oriented in the direction of the prevailing pressure drop may reduce the amount of gas that enters the porous matrix due to selective entry of the liquid portion of foam. The lower CEP needed for liquid to enter the matrix and the high-permeability pathways for gas both encourage foam phase-separation in heterogeneous systems. Oil in the low-permeability region tended to persist as oil globules spanning many networked pores after the initial displacement front passed. Stegemeier has previously discussed the necessary conditions needed to mobilize such oil ganglia: the pressure across the length of the globule must exceed the restraining capillary pressure of the downstream pore, which depends on pore size and interfacial tension.36,37 Note that the aqueous-oil interfacial tension (IFT) in this work was not optimized for low tension, so oil displacement was realized by the mechanism of exceeding the local pore capillary entry pressures rather than by significantly decreasing IFT. These results suggest that foam EOR/IOR could also improve surfactant flood efficiency because bubble resistances can cause local pressure increases that exceed the surfactant capillary entry pressures.
4.3. Foam quality
Foam quality, typically represented by gas fraction, was observed to differ in the high- and low-permeability zones. High-permeability regions were more gas-rich, with surfactant solution limited to thin lamellae between bubbles. Low-permeability regions were more liquid-rich, with gas preferentially occupying only the most permeable pore paths (microfracture defects). Furthermore, the initial sweep of the low-perm region was dominated almost entirely by the surfactant phase, and air could only invade pores previously swept by the surfactant solution.Fig. 8 shows the center of the micromodel during a foam flood. The low-permeability matrix was mostly filled with surfactant solution along with some gas bubbles, distinguished by thicker dark lamellae. The adjacent fracture contained dry foam, with liquid found only in the lamellae between bubbles, as evidenced by the characteristic polyhedral bubble shapes. In such systems with heterogeneous permeability zones, foam may dry out in the high-permeability regions as the liquid portion is redirected to the low-permeability regions because the surfactant solution requires a lower capillary entry pressure to enter small pores.
 | ||
| Fig. 8 Micrograph of the middle section of the micrograph showing the liquid-rich low-perm matrix with dry (polyhedral) foam in the adjacent fracture. Differences in capillary entry pressures for the liquid and gas portions of foam resulted in wetter low-perm regions, as the surfactant solution can invade small pores more readily than gas. | ||
This difference in CEPs between the liquid and gas components of the foam results in zones with small pores becoming liquid-rich. Gas, immobilized in bubbles, cannot invade the next pore until the local pressure gradient increases enough to overcome the gas CEP, while lower pressure gradients are sufficient to mobilize the liquid portion of the foam.
4.4. Foam generation
An important factor in the viability of foam EOR is the ability for foam to regenerate in the reservoir even at slow velocities and low pressure drops far from the injection well. Gas mobility control is known to depend on foam texture.38,39 Snap-off is believed to be the dominant foam generation mechanism in porous media,12 but it requires fluid to move from a low-permeability region to a high-permeability region: a sudden decrease in capillary number downstream of a pore throat. Most experiments in the literature have demonstrated snap-off in water-wet systems. Note that our system is oil-wet and that there is no such permeability step change due to the limiting depth dimension of our micromodel; as a result, we only observed foam bubbles generated in situ by lamellae division, in contrast to the foam generation mechanism believed to be dominant in actual 3D reservoirs.Studying snap-off in 2D porous media is inherently problematic because both the liquid and gas phases compete to occupy the same pore throats, and significant wetting-phase mobility cannot occur unless it spans pore throats, causing snap-off.40 Hence, some 2D systems may actually create more favorable conditions for snap-off than one would see in a comparable 3D system. However, Rossen notes that in 3D porous media, the two phases can have interconnected pore networks for flow. This paper may shed light on the possible arrangement of liquid-filled and gas-filled pores in actual porous media during foam transport: an interconnected pore network with high CEP may transport the liquid phase, while another pore network with lower CEP may preferentially transport the gas phase. Foam generation may tend to occur where these two networks intersect. When the liquid phase “contests” a gas-filled pore throat, it creates lamellae and generates foam.
5. Conclusion
These experiments demonstrated oil displacement via water, air, and foam flooding in 2D model heterogeneous porous media with stratified permeability regions and a central fracture. Foam improved the total oil displacement and sweep efficiency compared to water flooding, gas flooding, surfactant flooding, and water/gas co-injection under the same injection conditions. Furthermore, visual micromodel analysis showed the permeability section from which the mobilized oil originated, as well as how injected fluids invaded each zone to recover the oil. Foam effectively displaced trapped oil in the low-permeability region by bubble resistances in the fracture and high-permeability zones, increasing local pressure gradients into the matrix sufficiently to overcome the low-permeability capillary entry pressure. Foam caused a higher pressure drop and higher apparent viscosity due to the trapping of bubbles. The injected foam quality (air/water ratio) changed in porous media depending on the matrix permeability due to differences in the capillary entry pressure for the injected gas and liquid. The liquid portion of the injected foam required lower pressure gradients than the gas portion to invade small pores, so low-permeability regions become liquid-enriched. High-permeability regions became gas-rich as bubbles were immobilized and lamellae drained. This phase separation of the injected foam suggests that foam should not be treated as a homogeneous phase in heterogeneous porous media.Acknowledgements
We acknowledge the US Department of Energy for partial financial support (Award No. DE-FE0005902). We also acknowledge the financial support of the Abu Dhabi National Oil Company (ADNOC), the Abu Dhabi Oil R&D Sub-Committee, the Abu Dhabi Company for Onshore Oil Operations (ADCO), the Zakum Development Company (ZADCO), the Abu Dhabi Marine Operating Company (ADMA-OPCO), and the Petroleum Institute (PI) of the United Arab Emirates (UAE). Special thanks to Dr. Jose Lopez-Salinas for assistance in estimating micromodel permeability.References
- L. W. Lake, Enhanced Oil Recovery, Prentice Hall Incorporated, 1989 Search PubMed.
- K. Ma, R. Liontas, C. A. Conn, G. J. Hirasaki and S. L. Biswal, Soft Matter, 2012, 8, 10669–10675 RSC.
- S. K. Matthäi and M. Belayneh, Geophys. Res. Lett., 2004, 31, L07602 CrossRef.
- R. Liontas, K. Ma, G. J. Hirasaki and S. L. Biswal, Soft Matter, 2013, 9, 10971–10984 RSC.
- G. J. Hirasaki, R. E. Jackson, M. Jin, J. B. Lawson, J. Londergan, H. Meinardus, C. A. Miller, G. A. Pope, R. Szafranski and D. Tanzil, NAPL Removal: Surfactants, Foams, and Microemulsions, 2000, pp. 3–163 Search PubMed.
- A. Skauge, M. G. Aarra, L. Surguchev, H. A. Martinsen and L. Rasmussen, Foam-Assisted WAG: Experience from the Snorre Field, Society of Petroleum Engineers, 2002 Search PubMed.
- M. A. Fernø, G. Ersland, A. Haugen, E. Johannesen, A. Graue, J. Stevens and J. Howard, Impacts From Fractures On Oil Recovery Mechanisms In Carbonate Rocks At Oil-Wet And Water-Wet Conditions - Visualizing Fluid Flow Across Fractures With MRI, Society of Petroleum Engineers, 2007 Search PubMed.
- Å. Haugen, M. Fernø, A. Graue and H. Bertin, SPE Reservoir Eval. Eng., 2012, 15, 218–228 Search PubMed.
- Å. Haugen, M. A. Fernø, Ø. Bull and A. Graue, Energy Fuels, 2010, 24, 3020–3027 CrossRef.
- A. Marciniak-Czochra and A. Mikelic, 2013, arXiv:1303.3496 [physics].
- J. Wan, T. K. Tokunaga, C.-F. Tsang and G. S. Bodvarsson, Water Resour. Res., 1996, 32, 1955–1964 CrossRef CAS.
- A. R. Kovscek, G.-Q. Tang and C. J. Radke, Colloids Surf., A, 2007, 302, 251–260 CrossRef CAS PubMed.
- N. S. K. Gunda, B. Bera, N. K. Karadimitriou, S. K. Mitra and S. M. Hassanizadeh, Lab Chip, 2011, 11, 3785–3792 RSC.
- N. K. Karadimitriou, V. Joekar-Niasar, S. M. Hassanizadeh, P. J. Kleingeld and L. J. Pyrak-Nolte, Lab Chip, 2012, 12, 3413–3418 RSC.
- P. Wägli, A. Homsy and N. F. de Rooij, Sens. Actuators, B, 2011, 156, 994–1001 CrossRef PubMed.
- T. W. de Haas, H. Fadaei and D. Sinton, Lab Chip, 2012, 12, 4236–4239 RSC.
- C. Zhang, M. Oostrom, J. W. Grate, T. W. Wietsma and M. G. Warner, Environ. Sci. Technol., 2011, 45, 7581–7588 CrossRef CAS PubMed.
- M. Buchgraber, M. Al-Dossary, C. M. Ross and A. R. Kovscek, J. Pet. Sci. Eng., 2012, 86–87, 27–38 CrossRef CAS PubMed.
- R. A. Dawe, A. Caruana and C. A. Grattoni, Transp. Porous Media, 2011, 86, 601–616 Search PubMed.
- E. R. Rangel-German and A. R. Kovscek, Water Resour. Res., 2006, 42, W03401 CrossRef.
- Y. Xia and G. M. Whitesides, Annu. Rev. Mater. Sci., 1998, 28, 153–184 CrossRef CAS.
- G. C. Kini, J. Lai, M. S. Wong and S. L. Biswal, Langmuir, 2010, 26, 6650–6656 CrossRef CAS PubMed.
- D. Bodas and C. Khan-Malek, Sens. Actuators, B, 2007, 123, 368–373 CrossRef CAS PubMed.
- S. L. Anna, N. Bontoux and H. A. Stone, Appl. Phys. Lett., 2003, 82, 364–366 CrossRef CAS PubMed.
- K. Ma, R. Farajzadeh, J. L. Lopez-Salinas, C. A. Miller, S. L. Biswal and G. J. Hirasaki, Transp. Porous Media, 2014, 102, 325–348 CrossRef CAS PubMed.
- B. J. Kirby, Micro- and Nanoscale Fluid Mechanics: Transport in Microfluidic Devices, Cambridge University Press, 2010 Search PubMed.
- R. Remsburg, Thermal Design of Electronic Equipment, CRC Press, 2000 Search PubMed.
- D. D. Huang and M. M. Honarpour, J. Pet. Sci. Eng., 1998, 19, 103–117 CrossRef CAS.
- J. Drelich, C. Fang and C. L. White, Encyclopedia of Surface and Colloid Science, 2002, vol. 3, pp. 3158–3163 Search PubMed.
- P. P. van Lingen, Quantification and reduction of capillary entrapment in cross-laminated oil reservoirs, Delft University of Technology, 1998 Search PubMed.
- M. Simjoo and P. Zitha, Effects of Oil on Foam Generation and Propagation in Porous Media, Society of Petroleum Engineers, 2013 Search PubMed.
- H. H. Al-Attar, J. Pet. Sci. Eng., 2011, 79, 101–112 CrossRef CAS PubMed.
- R. Li, W. Yan, S. Liu, G. Hirasaki and C. Miller, SPE J., 2010, 15, 934–948 CAS.
- G. J. Hirasaki and J. B. Lawson, SPEJ, Soc. Pet. Eng. J., 1985, 25, 3833–3845 Search PubMed.
- M.-H. Hui and M. J. Blunt, J. Phys. Chem. B, 2000, 104, 3833–3845 CrossRef CAS.
- J. C. Moulu, J. Phys., Lett., 1985, 46, 97–103 CrossRef CAS.
- G. L. Stegemeier, Improved Oil Recovery by Surfactant and Polymer Flooding, 1977, pp. 55–91 Search PubMed.
- A. H. Falls and G. J. Hirasaki, SPE Reservoir Eng., 1988, 3, 884–892 CAS.
- A. R. Kovscek and C. J. Radke, in Foams: Fundamentals and Applications in the Petroleum Industry, American Chemical Society, 1994, vol. 242, pp. 115–163 Search PubMed.
- W. R. Rossen, Colloids Surf., A, 2008, 322, 261–269 CrossRef CAS PubMed.
Footnote |
| † Electronic supplementary information (ESI) available. See DOI: 10.1039/c4lc00620h |
| This journal is © The Royal Society of Chemistry 2014 |