 Open Access Article
Creative Commons Attribution 3.0 Unported Licence
A microfluidic-based platform for tumour spheroid culture, monitoring and drug screening†
K.
Kwapiszewska
*,
A.
Michalczuk
,
M.
Rybka
,
R.
Kwapiszewski
and
Z.
Brzózka
Institute of Biotechnology, Department of Microbioanalytics, Faculty of Chemistry, Warsaw University of Technology, Noakowskiego 3, 00-664 Warsaw, Poland. E-mail: karina.kwapiszewska@gmail.com
First published on 2nd April 2014
Abstract
The development of novel cellular models that can replace animals in preclinical trials of drug candidates is one of the major goals of cell engineering. Current in vitro screening methods hardly correspond with the in vivo situation, whereas there is a lack of assays for more accurate cell culture models. Therefore, development of automated assays for 3D cell culture models is urgently required. In this work, we present a SpheroChip system: a microfluidic-based platform for long-term 3D cell culture and analysis. The system is compatible with commercially available microplate readers and provides continuous, in situ monitoring of tumour spheroids cultured on a chip. The microfluidic chip consists of cell culture microchambers and hemispherical microwells connected with a concentration gradient generator. HT-29 and Hep-G2 cells were successfully cultured as tumour spheroids in the SpheroChip, and metabolic activity of cells was monitored for up to two weeks by in situ fluorimetric measurements. Cellular response to an anticancer drug was observed using the SpheroChip. The experimental setup provided the unique possibility of observing dynamic changes in metabolic activity of one culture during sequencing days after drug dosage. According to this new approach, unknown phenomena of cellular response to the anticancer drug were observed, such as increase of metabolic activity shortly after drug dosage. Moreover, the influence of a second dose of a drug was evaluated. The SpheroChip system can be used by researchers working on drug screening, evaluation of anticancer procedures and chemoresistance phenomena.
Introduction
Nowadays, the drug development sector faces a quandary between the throughput and accuracy of accessible in vitro screening assays. A majority of the applied tests were based on a monolayer (2D) cell culture, which is an easy to handle model suitable for automation and is favorably used in High Throughput Screening (HTS) systems.1 However, the 2D culture lacks essential interactions present in vivo, which strongly limits the prediction of the effect of a drug on humans.2 Therefore, increasing attention has been paid to the development of three-dimensional cellular models.3 3D cellular models mimic spatial cell-to-cell interactions present in vivo, which have been proven to influence intracellular pathways.4 Thus, application of 3D models for drug screening leads to results that can predict an in vivo situation more accurately.3Among 3D cellular models, spheroids have gained increasing interest. Tumour spheroids are considered as the best cellular models for cancer research developed so far.5 There are several factors which make the morphology and physiology of the tumour spheroid similar to a tumour in vivo, i.e. the network of cell–cell interactions, the three-dimensional structure, the presence of a natural extracellular matrix and nutrients, metabolites and oxygen gradients.6 The tissue structure determines the growth rate of a tumour as well as the response to anticancer drugs.7 Despite numerous advantages of the spheroid model known for decades, its widespread use for drug screening is still limited. There are a number of methods of spheroid cultivation,5,8 among which there has been increasing participation of microfluidic-based methods.9–22 However, quantitative determination of cellular response in the 3D arrangement is still problematic and not fully satisfying.3,23,24 Microfluidic devices have mostly been used for spheroid formation9–14,16,20,21,25,26 and/or cultivation.9–13,20–22,26 A few of them were used for spheroid analysis18,21,22,24 and none utilized the instrumental method in situ. There is no microfluidic solution for spheroid formation, long-term culture and automated analysis on chip combined in one device. Moreover, there is only one spheroid-based solution compatible with microplate readers, utilizing a hanging drop cultivation method.27
In this work, we propose a microfluidic-based bioanalytical platform for long-term cultivation and observation of tumour spheroids. Our SpheroChip system is suitable for dual type analysis: (1) microscopic observations of the cellular morphology and (2) fluorescent staining as well as fluorimetric measurements in situ using commercially available microplate readers. We applied a simple spheroid formation and cultivation method, which was successfully used in our previous work.28 We improved a cell culture zone by changing the shape of the microwells. In a SpheroChip, the microwells for spheroid formation are hemispherical. This was possible due to application of a clean room independent fabrication method, which was developed by us and can be easily adapted in small laboratories.28,29 Cell culture zones were grouped into microchambers. The dimensions and arrangement of the microchambers were identical to the wells of a standard 384-well plate. Therefore, the SpheroChip can be applied in widely accessible instruments. Two human cell lines (HT-29 colon carcinoma and Hep-G2 liver carcinoma) were successfully cultured as spheroids using the SpheroChip.
The design of the SpheroChip system provided effective medium exchange and precise control over the spheroid environment. It is a significant advancement over existing methods, i.e. the hanging drop method, whose principle disables total medium exchange. Moreover, the applied protocol made possible the continuous monitoring of metabolic activity of cultured cells. This enabled a novel approach to drug activity evaluation. One population of spheroids could be monitored for several days after drug dosage. Profiles of time-dependent drug sensitivity were plotted for different concentrations of a model anticancer drug, 5-fluorouracil. This provided novel insights into the cellular response to external factors. For example, we observed the effect of acquired resistance to a higher drug concentration and the increase in metabolic activity shortly after drug dosage. The proposed technique can be helpful in revealing the chemoresistance of colon cancer,30 as dynamic changes in cellular activity can be detected. Additionally, the applied protocol enabled monitoring of drug activity within different dosing regimens. There has been no method for quantitative analysis of the response of one population of spheroids to dose sequencing of a drug so far. The study of the effect of dosing is highly required, but still missing in drug development prior to clinical trials.1 To sum up, in this paper we present a novel bioanalytical platform that can provide novel insights into tumour physiology and mechanisms of response to anticancer drugs.
Experimental
Fabrication
The microfluidic chip was fabricated in PDMS (Sylgard 184, Dow Corning) according to a previously described protocol.28,29 The first master was micromilled in a poly(methyl methacrylate) (PMMA) slab using a CNC micromilling machine (Minitech Machinery Co.). The second master was obtained by replica moulding in PDMS. PDMS was prepared by mixing the pre-polymer and the curing agent in the weight ratio of 9![[thin space (1/6-em)]](https://www.rsc.org/images/entities/char_2009.gif) :
:![[thin space (1/6-em)]](https://www.rsc.org/images/entities/char_2009.gif) 1. The PDMS mixture was poured over the PMMA structure and cured for 3 h at 70 °C. The PDMS replica was peeled off and placed in an oven set to 100 °C for 48 h of thermal aging, and thus the second master was obtained. The second master was used for replica moulding in 9
1. The PDMS mixture was poured over the PMMA structure and cured for 3 h at 70 °C. The PDMS replica was peeled off and placed in an oven set to 100 °C for 48 h of thermal aging, and thus the second master was obtained. The second master was used for replica moulding in 9![[thin space (1/6-em)]](https://www.rsc.org/images/entities/char_2009.gif) :
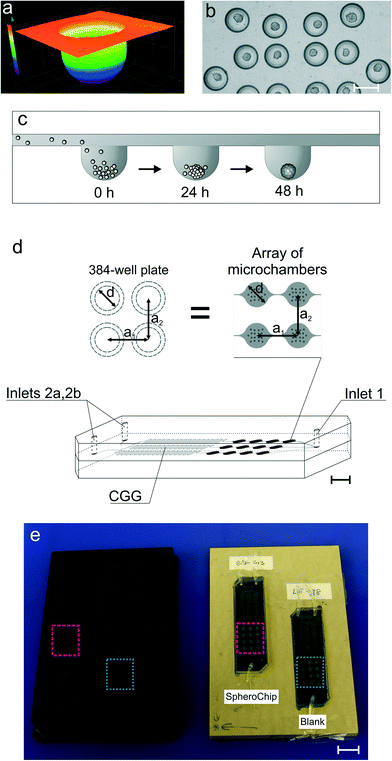
:![[thin space (1/6-em)]](https://www.rsc.org/images/entities/char_2009.gif) 1 PDMS. Up to 20 sequential moulding steps could be performed using one thermally aged master. A replica of the second master was peeled off from the mould and cut to an appropriate shape. Thus, a bottom layer of the chip was obtained. A cover layer was made of a plane PDMS slab, which contained drilled ports for tubing. Both layers were connected by bonding using oxygen plasma treatment (Plasma Preen System Inc. II 973). The chip was cut to a bottom layer shape and tubing was connected. The resulting chip is presented in Fig. 1.
1 PDMS. Up to 20 sequential moulding steps could be performed using one thermally aged master. A replica of the second master was peeled off from the mould and cut to an appropriate shape. Thus, a bottom layer of the chip was obtained. A cover layer was made of a plane PDMS slab, which contained drilled ports for tubing. Both layers were connected by bonding using oxygen plasma treatment (Plasma Preen System Inc. II 973). The chip was cut to a bottom layer shape and tubing was connected. The resulting chip is presented in Fig. 1.
The positioning plate was fabricated in a poly(ether ether ketone) slab using a CNC micromilling machine (Minitech Machinery Co.). Cavities for chip positioning were blackened with pieces of black printed paper.
Chip operation
The microfluidic chips were operated using syringe pumps (NE 1000 New Era Pump Systems Inc.). During incubation or measurements tubing was sealed using PDMS-filled needles.Prior to cell culture, the chips were sterilized by exposure to UV light (Black Ray) for 20 min and then flushed with 70%vol ethyl alcohol (POCh, Poland).28,31,32 To prevent cell attachment, 0.5%weight solution of poly(vinyl alcohol) (PVA, Sigma Aldrich) in DI water was sterilised using a PTFE syringe filter (pores of 0.2 μm, Sigma-Aldrich), introduced to the microchannels and incubated for 1 h. Then, the system was filled with cell culture medium and warmed by placing in a CO2 incubator (HERAcell 150, Thermo Scientific).
Cell culture and observation
Two cell lines were used for the experiments: HT-29 human colon carcinoma cells and Hep-G2 human liver carcinoma cells (both lines were purchased from American Type Culture Collection). The HT-29 culture medium was based on RPMI medium (Sigma-Aldrich) supplemented with 5%vol of fetal bovine serum (Gibco), 1%vol of 25 mM L-glutamine (Sigma-Aldrich) and 0.6%vol of 100 mM penicillin and streptomycin (Sigma-Aldrich). The Hep-G2 culture medium was based on MEME medium (Sigma-Aldrich) supplemented with 10%vol of fetal bovine serum (Gibco), 1%vol of 25 mM L-glutamine (Sigma-Aldrich) and 1%vol of 100 mM penicillin and streptomycin (Sigma-Aldrich). Routine passages of both lines were performed at 80–95% confluence using TrypLE™ Express (Gibco) and phosphate buffered saline (Sigma-Aldrich).The cell suspension was prepared according to a protocol previously described.28,32 The density of the cell suspension was measured using a Countess Cell Counter (Invitrogen). A cell suspension of 1 × 10⁶–5 × 10⁶ cells mL−1 was used as an inoculum for on-chip experiments. The cells were introduced to the microsystem using syringe pumps. The system was sealed and placed for incubation in a CO2 incubator. The medium was exchanged daily at a constant flow rate of 4.5 μL min−1 for 15 minutes.
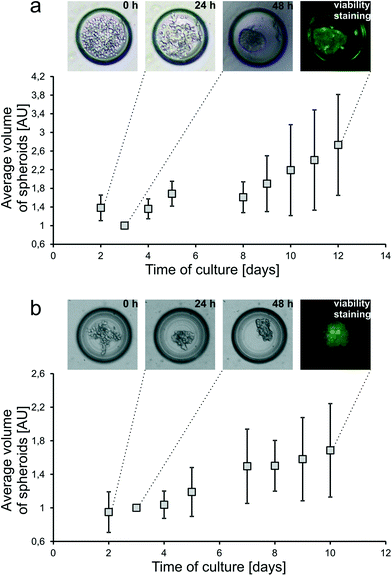
Observations of cell cultures were carried out using an inverted fluorescence microscope coupled with a CCD camera (Olympus). The cellSens image analysis software (Olympus) was used for data acquisition and analysis. Micrographs of the culture progress were taken each day of culture, and the sizes of spheroids (surface areas) were measured. Assuming a spherical shape of spheroids, their volumes were estimated and growth curves were plotted (see Fig. 4).
Spectrofluorimetric measurements
All spectrofluorimetric measurements were carried out using a Varian Cary Eclipse Fluorescence Spectrophotometer equipped with a Microplate Reader (Agilent). alamarBlue (AbD Serotec) was used as a fluorescence indicator of metabolic activity of cells.33 10%vol of alamarBlue was added to the cell culture medium and the mixture was left for incubation with cells. The Petri dish cell culture was incubated for 16 hours with alamarBlue, while the on-chip culture was incubated for 10 minutes (see Metabolic activity monitoring in the Results and discussion section). The medium with 10%vol of alamarBlue incubated for the same time without cells was used as a blank. Measurements were carried out using the following parameters: an excitation wavelength of 552 nm and an emission wavelength of 582 nm. After the measurements, the medium was exchanged in the microfluidic chip.Drug activity evaluation
5-Fluorouracil (5-FU, Sigma-Aldrich) was used as the model anticancer drug.28 Microfluidic chips with compact spheroids of uniform size distribution (48 hours after seeding) were chosen for the drug screening experiments. A solution of 5-FU in HT-29 cell culture medium was introduced to the selected chip via the 2a inlet (see Fig. 1), while pure medium (for no-drug control) was introduced via the 2b inlet. Each stream was introduced at a flow rate of 2 μL min−1, which gives a total flow rate of 4 μL min−1. Drug introduction lasted 15 minutes. After that, the chip was sealed and incubated for 24 hours. Next, the medium was exchanged via the 2a and 2b inlets, and measurements were performed every day. For each concentration of 5-FU, at least three experiments were performed.At the end-point of each culture, a fluorescence-based live/dead cell viability assay using Calcein-AM and Propidium Iodide (Sigma-Aldrich) was performed.
Data analysis
Results of spectrofluorimetric measurements of on-chip cultures were processed according to the following scheme:| Irelative = Imeasured − Iblank | (1) |
| Iav(control) = (∑Irelative(control))/4, | (2) |
| In = (Irelative/Iav(control)) × 100% | (3) |
Computational modelling
Fluid flow in the designed structure was simulated by computer modelling using the MEMS Module of the COMSOL Multiphysics software.Results and discussion
Design
The design of the SpheroChip system (Fig. 1) was meant to meet the following requirements: (1) long-term culture of spheroids; (2) possibility of control over the extracellular environment by total medium exchange; (3) controllable distribution of tested drugs; (4) microscopic observation of the culture; and (5) compatibility with a microplate reader for assay automation. The design of a spheroid culture microchamber was based on our previous chip.28 Each microchamber was 50 μm deep and contained 18 microwells of diameters 200 μm and depths 150 μm (Fig. 1a–c). This design provides isolation of a culture from shear stress caused by medium flow, while diffusion-based mass exchange is fast enough for effective nutrition and waste removal.28 The improvement of the present design lies in the application of hemispherical microwells (Fig. 1a). The microwells were obtained using a ball-end mill in the fabrication process. The hemispherical shape of microwells resulted in more effective aggregation of cells and centred position of resulting spheroids (Fig. 1b). Spheroid culture microchambers were placed in an array of 3 series, each containing 4 microchambers. Each series was connected with a separate outlet of a concentration gradient generator (CGG, Fig. 1d).31 The design of the chip provided uniform cell distribution among the series of microchambers; the standard deviation of average spheroid dimensions in individual microchambers did not exceed 30% (slightly misaligned chips) in the whole chip. Additionally, only those chips with standard deviations less than 20% were chosen for the experiments.The microchambers were also designed as measurement cells for spectrofluorimetric microplate readers. The diameter of the microchambers (2.67 mm) was exactly the same as that of the wells of a 384-well plate. Similarly, off-sets between the microchambers and wells were the same (4.5 mm, see Fig. 1d). An integral element of the system was fitting the positioning plate into a microplate reader. The positioning plate contained two hollows for SpheroChip placement. When chips were fitted to the positioning plate, arrays of microchambers were in positions corresponding to B10 to D13 and J5 to L8 wells of the 384-well plate (Fig. 1e). Thus, each reading corresponded to 18 microwells so a signal from one microchamber was resultant from 18 spheroids.
For suitable positioning of the SpheroChip in the reader, the thicknesses of PDMS layers were considered. The bottom layer, containing microchannels and microchambers, was ca. 3 mm thick. Thus, the microchambers were at an appropriate height in the reader. The cover PDMS layer should be thick enough for tight tubing placement but thin enough for suitable culture oxygenation.28,32 During our preliminary measurements it was found that the thickness of the cover PDMS layer ranging from 2.7 to 8.0 mm does not influence the results of measurements. Therefore, the thickness of the cover layer was set to ca. 5 mm.
Experimental setup
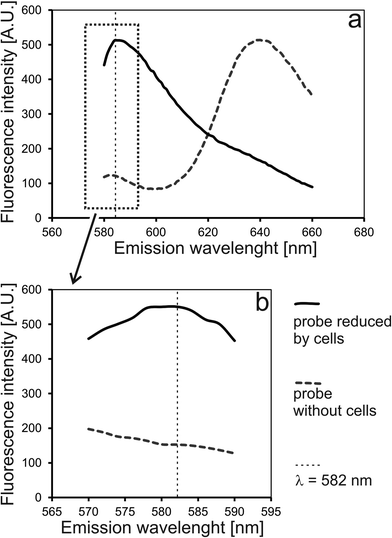
To verify an experimental setup for long-term monitoring of spheroids on-chip, the following issues were addressed: (1) usefulness of a measurement cell; (2) measurement parameters; (3) correctness of chip operation; and (4) suitability of the selected reagent for spheroid monitoring. First, two model solutions were prepared based on alamarBlue mixed with cell culture medium. The first probe was incubated overnight with HT-29 cells on a Petri dish (off-chip reduced reagent). The second probe was incubated for the same time without cells (native reagent).Excitation and emission spectra of these probes were taken in a standard 1 cm2 quartz cuvette as well as in a SpheroChip (Fig. 2). Wavelengths for excitation and emission were set to 552 nm and 582 nm, respectively. It was confirmed that the building material of a SpheroChip measurement cell (PDMS) does not affect the spectra of the used probes within selected parameters (see comparison between a cuvette and a chip in Fig. 2).
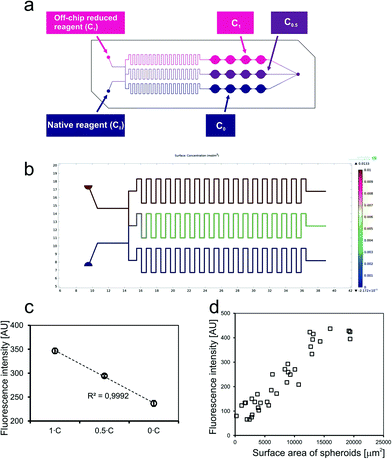
The next experiment was designed to verify the correctness of operation of a concentration gradient generator (CGG). Operation of a CGG structure designed for the SpheroChip was initially modelled using the COMSOL Multiphysics software (Fig. 3b). Total flow rates ranging from 2 to 20 μL min−1 were analyzed and total mixing was observed in the middle channel for each case. A maximal total flow rate for cell-containing SpheroChips was 5 μL min−1, thus this value was selected for laboratory experiment of the CGG performance. The probes described above (native reagent – C0 and off-chip reduced reagent – C1) were introduced into the SpheroChip via CGG inlets at a flow rate of 2.5 μL min−1 each. As a result, three concentrations were expected in the series of microchambers: C1, C0.5 and C0, (see scheme in Fig. 3a). The chip was sealed, placed in a positioning plate and introduced into a microplate reader. The results of the experiment are presented in Fig. 3c. Each point represents an average from 4 microchambers of one series. Error bars correspond to standard deviation. As can be seen, measured values are arranged linearly. This is evidence that operation of the microfluidic chip and detection of cells are consistent with the expected ones.
The last experiment planned to test the experimental setup was verification of the dependence between the amount of cells and fluorescence intensity. Three SpheroChips containing HT-29 spheroids of different diameters were used in this experiment.
The measurement was performed according to the protocol given in the Experimental section. Next, the areas of spheroids stained with Calcein-AM were measured. The average size of spheroids was calculated for each microchamber. The results were plotted on a graph presented in Fig. 3d. It was confirmed that the fluorescence intensity detected in the microchamber was directly proportional to the size of spheroids. Hence, the basic principle of drug-screening experiments was verified and its correctness was confirmed.
Spheroid culture
The principle of spheroid formation and culture is presented in Fig. 1c. First, all microchannels of the system were filled with the cell suspension, and afterwards, cells began to sediment into the microwells (0 h). During the first incubation period (24 h), cell aggregation was observed. At this point unaggregated cells were rinsed with fresh medium flow. During the next 24 hours spheroid compaction occurred (48 h) and it was considered as the starting point of spheroid culture and spheroid-based experiments.In this work, two cell lines were cultured as tumour spheroids inside the SpheroChip: HT-29 human colon carcinoma cells and Hep-G2 human liver carcinoma cells (Fig. 4). Both cell lines were successfully cultured for over one week and spheroid growth was observed. The growth rate of HT-29 cells was higher than that of Hep-G2 cells. The live/dead cell viability assay performed at the end-point of the culture confirmed the viability of the cultured spheroids. Therefore, the designed microfluidic system proved to be suitable for long-term three dimensional culture of different cell lines.
Metabolic activity monitoring
Prior to drug screening experiments, regular cultures of HT-29 spheroids were monitored using the designed experimental setup. It was observed that the incubation time is crucial for the results of measurements. Resazurin is a reagent of alamarBlue and is reduced by metabolically active cells to fluorescent resorufin. Resorufin can be further reduced to nonfluorescent hydroresorufin.33 The effect of over-reduction of alamarBlue was not observed for the Petri dish culture of HT-29 cells during the applied time of incubation (up to 16 hours). On the other hand, the same time of incubation of the cell-containing chip resulted in a lower signal of fluorescence compared to the control without cells. For the confluent Petri dish culture, the ratio of the surface with growing cells to the volume of medium was 0.24 mm−1, whereas for a microchamber of the SpheroChip the ratio was over 10 times higher and came to 3.24 mm−1. Therefore, local resazurin run-down resulted in faster over-reduction in the microfluidic environment. It was confirmed by observation of the fluorescence signal of the cell-containing SpheroChip. Measurements were taken every 2 minutes for the first 40 minutes of incubation with alamarBlue and every 10 minutes for the next 2 hours. It was observed that, in most cases, the signal of fluorescence decreased after 1 hour of incubation. However, for the densest culture, a maximum signal was detected about 20 minutes from start of incubation and after 1 hour decreased to values beyond the reference. Therefore, the incubation time of 10 minutes was selected as optimal for on-chip measurements. Thus, on-chip measurements could be performed much faster than analogous Petri dish ones, where the required incubation periods are counted in hours.Regular on-chip HT-29 spheroid cultures were monitored for 12 days according to the protocol given in the experimental section. It was observed that alterations between individual microchambers of cultures without the drug did not exceed 20%.
Drug screening
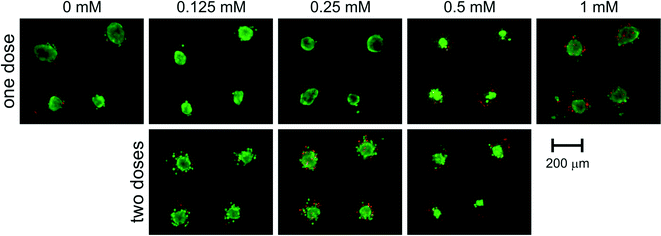
Drug screening experiments were performed according to the following timeline: (day 1) cell seeding; (day 2) measurement, medium exchange; (day 3) measurement, drug dosage; (day 4 to day 11) measurement, medium exchange; and (day 12) measurement, live/dead cell viability staining. Application of a CGG structure provided the possibility of having a control (no drug) culture in each chip subjected to a drug. As all results were compared to a control, it is important to select only perfectly aligned chips with uniformly seeded cells. A very important feature of the SpheroChip system is the possibility of total medium exchange from the spheroids' environment. Based on the results of COMSOL Multiphysics simulations, the time needed for total equalization of the glucose concentration by diffusion in the microwell is less than 20 seconds.28 Therefore, the environment of spheroids' surroundings can be precisely controlled during the experiment. The possibility of dynamic changes in the extracellular environment, depending on the design of the experiment, is one of the unique and highly advantageous features of the presented system. This can be used for considerations of drug concentrations consistent with ADME profiles.1In our study, 5-fluorouracil was dosed in a concentration range of 0.125–1 mM. The same concentrations of 5-FU were applied to Petri dish monolayer cultures (see the ESI†). Petri dish experiments revealed that a 5-FU concentration of 0.25 mM or higher is lethal for monolayer cultured HT-29 cells after at least 72 hours from dosage. On the other hand, viability staining of spheroids (Fig. 6) showed that spheroids are resistant to higher concentrations of 5-FU (up to 1 mM).
The biggest advantage of the presented system is the possibility of continuous, long-term monitoring of the viability of spheroids subjected to an anticancer drug. To present unique possibilities of the presented system, we decided to apply 24 hour incubation of the drug followed by no-drug period of time for recovery. This is to present that by applying certain dosing regimens one can mimic changes in the local drug concentration subjected to distribution and elimination processes in vivo.1 This is an advancement over existing methods, which are based on one dose of a drug, followed by a single analysis step, often connected with the cell culture end. In contrast, the SpheroChip enables continuous observation in situ of the cellular response for a long period of time.
In Fig. 5, the results of fluorescence-based monitoring using a microplate reader are presented. Relatively high error bars could be caused by population alterations combined with inevitable differences in spheroid diameters (up to 20%, see the Metabolic activity monitoring section). It was observed that spheroids subjected to 0.125–0.5 mM of 5-FU demonstrated an increase in metabolic activity 24 hours after dosage. According to the experimental protocol (see the Experimental section), the whole amount of the drug was removed from the cell culture zone prior to introduction of alamarBlue. Therefore, this sudden metabolic activity decrease could not be affected by the presence of the drug in the cell culture medium during measurements. Thus, there should be some inner effects causing the growth in metabolic activity of a spheroid in response to 5-fluorouracil. No literature reporting a similar effect could be found, mostly because the assay procedures apply only an end-point type of analysis.34
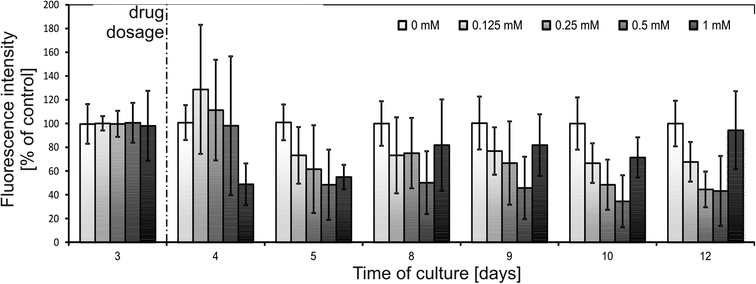 | ||
| Fig. 5 Results of spectrofluorimetric monitoring of HT-29 spheroids exposed to 5-fluorouracil (one dose). Probe “0 mM” was referenced without a drug, which was considered as 100% of a signal. | ||
After the initial increase in 24 hours after drug dosage, metabolic activity decreased in the following days. The signal decreased more rapidly for higher concentrations of the drug. 9 days after drug dosage (12th day of culture) metabolic activity reached 68 ± 16% of a control for 0.125 mM, 45 ± 15% of a control for 0.25 mM and 43 ± 29% of a control for 0.5 mM. These results were in correlation with live/dead staining presented in Fig. 6. Spheroids subjected to 0.125 mM 5-FU maintained their integrity but their growth was limited and thus, the detected signal was lower than that of the control. For concentrations of 0.25 and 0.5 mM spheroid disintegration was observed and was proportional to the concentration applied.
A different response was observed for 1 mM 5-FU (Fig. 5). 24 hours after 1 mM 5-FU dosage spheroids exhibited a strong decrease in metabolic activity to a value of 49 ± 17% of a control (no increase was observed). In the next days the metabolic activity increased and 9 days after drug dosage reached 94 ± 30% of a control.
Microscopic observations confirmed high viability and integrity of these spheroids (Fig. 6). The presence of unaggregated, necrotic cells can lead to a conclusion that the outer layer of spheroids was affected by the drug, while inner cells remained unaffected. Intrinsic or acquired resistance of colon cancer cells to 5-fluorouracil is a phenomenon widely reported in the literature.30,35–39 Moreover, there have been reports on drug resistance of HT-29 cells enhanced by higher drug concentrations.36 However, none of these effects has been satisfyingly explained.30,38,39 Our SpheroChip system provides a novel procedure of drug activity monitoring, and thus can be beneficial for researchers working on chemoresistance of cancer cells. Using the SpheroChip system, one can observe the dynamics of cellular response rather than the viability at the endpoint. This can be useful for studies on mechanisms of cytotoxicity and resistance.
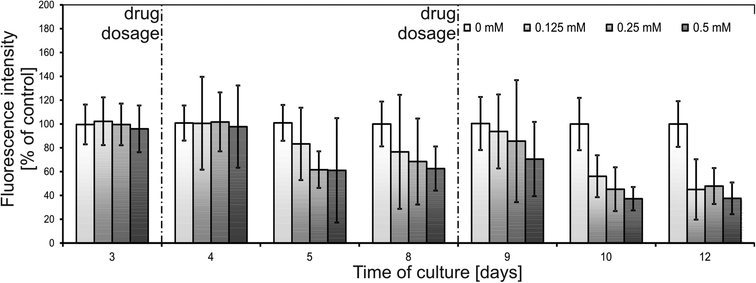
Another advantage of the SpheroChip system is the possibility of observing the spheroids' response to repeated dose of a drug. During an anticancer treatment, the environment around the cancer tumour is dynamic, the concentration of a drug varies according to the ADME profile and the dose of a drug is usually repeated. Unfortunately, these features are mostly ignored in current in vitro tests.1,34 Our motivation was to develop a system that can be used for mimicking in vivo dosing regimens. We verified the effect of dosing on cellular sensitivity to 5-FU. The step of adding a second dose of a drug was added to the protocol described above on the 8th day. Concentrations of 5-FU, which were tested in this regime, ranged between 0.125 and 0.5 mM. The results of spectrofluorimetric monitoring are presented in Fig. 7. Similar to the first dose, the second dose of a drug resulted in an increase in metabolic activity 24 h after dosage (9th day of culture, Fig. 7). In the following days, successive metabolic activity decrease was observed. For a 5-FU concentration of 0.25 mM or 0.5 mM no significant differences were observed between the one- and two-doses treatment: metabolic activity at the endpoint of culture was 48 ± 15% of a control for two doses of 0.25 mM (compared to 45 ± 15% of a control for one dose treatment) and 38 ± 13% of a control for two doses of 0.5 mM (compared to 43 ± 29% of a control for one dose treatment). A slightly stronger effect of a doubly dosed drug was observed for 0.125 mM 5-FU. Metabolic activity for two doses at the endpoint of culture reached 45 ± 25% of a control, compared to 68 ± 14% of a control for one dose treatment. These results are in a good correlation with microscopic observations of the live/dead cell viability assay (Fig. 6). Micrographs of one- or two-dose treated spheroids for 0.25 mM and 0.5 mM are similar. A strong difference can be seen between spheroids subjected to 0.125 mM 5-FU. One dose treatment resulted in small but integral spheroids. On the other hand, two doses of 0.125 mM caused noticeable spheroid disintegration and the presence of apoptotic and necrotic unaggregated cells. Therefore, the morphology of spheroids doubly treated with 0.125 mM 5-FU was similar to those treated once with higher doses of 5-FU. This experiment proved the usefulness of the SpheroChip system for research on the influence of dosing on anticancer therapy effectiveness.
Conclusions
In the presented research we developed and tested a microfluidic-based platform for long-term three-dimensional cell culture and monitoring. The SpheroChip system consists of disposable microfluidic chips for cell culture and a positioning plate, which enables analysis using a commercially available microplate reader. To the best of our knowledge, it is the first microfluidic-based microplate compatible system for in situ spheroid analysis.We performed a series of experiments proving the usability of the system for spheroid culture, monitoring and analysis. Self-assembled spheroids were formed using the simple principle of adherent cell culture on non-adhesive surfaces. Three-dimensional microfluidic structures were fabricated using a simple, clean-room independent method. Resultant hemispherical microwells provided effective formation of spherical aggregates and thus led to high uniformity of spheroids. Two human cell lines, HT-29 colon cancer cells and Hep-G2 hepatocytes, were successfully cultured as spheroids using the SpheroChip. Cellular metabolic activity was monitored continuously using a fluorimetric microplate reader. Application of a concentration generator structure provided no-drug control and two drug concentrations on each microfluidic chip. 5-Fluorouracil was used as a model anticancer drug for HT-29 cells and alterations in metabolic activity depending on drug concentrations could be observed. Moreover, the chemoresistance phenomenon was observed for high drug concentrations. We proposed a novel method of presenting results – we plotted time-dependent changes in metabolic activity rather than standard dose–response curves. The possibility of monitoring one culture for sequential days gives novel insight into drug sensitivity/resistance phenomena. For example, growth of metabolic activity was observed in response to 5-FU after 24 hours, followed by a subsequent decrease – a phenomenon which is impossible to observe by an end-point type of assay. Thus, the proposed system can be particularly beneficial for research on mechanisms of cytotoxicity. Also, repeated doses of a drug could be investigated using the SpheroChip system. It was observed that low concentrations of 5-FU are more effective when the dose is repeated.
To sum up, the presented bioanalytical platform gives novel opportunities for research on three-dimensional cellular models. Compared to the conventional methods, the SpheroChip system enables in situ and instrumental analysis of the three-dimensional cellular model cultured under controllable conditions. Additionally, a time-dependent data plot is possible for each culture, unlike end-point analysis used in conventional methods. The simplicity of fabrication and operation of the chip reduces the cost of experiments which determines the possibility of use in biological laboratories. Moreover, the time of an assay is reduced compared to the macroscale, therefore more experimental data can be obtained. The SpheroChip system provides on-line monitoring of the three-dimensional cellular model, and therefore can be used for novel experimental approaches.
Acknowledgements
This work was financially supported by the Polish Ministry of Science and Higher Education through the “Iuventus Plus” Programme (contract no. 0643/IP1/2011/71) and the Foundation for Polish Science through the START 2013 programme.Notes and references
- J. M. McKim, Comb. Chem. High Throughput Screening, 2010, 13, 188–206 CrossRef CAS.
- K. Ziółkowska, R. Kwapiszewski and Z. Brzózka, New J. Chem., 2011, 35, 979–990 RSC.
- F. Pampaloni and E. H. K. Stelzer, Biotechnol. Genet. Eng. Rev., 2009, 26, 129–150 Search PubMed.
- K. M. Yamada and E. Cukierman, Cell, 2007, 130, 601–610 CrossRef CAS PubMed.
- F. Hirschhaeuser, H. Menne, C. Dittfeld, J. West, W. Mueller-Klieser and L. A. Kunz-Schughart, J. Biotechnol., 2010, 148, 3–15 CrossRef CAS PubMed.
- R. M. Sutherland, Science, 1988, 240, 177–184 CAS.
- C. Fischbach, R. Chen, T. Matsumoto, T. Schmelzle, J. S. Brugge, P. J. Polverini and D. J. Mooney, Nat. Methods, 2007, 4, 855–860 CrossRef CAS PubMed.
- R. Z. Lin and H. Y. Chang, Biotechnol. J., 2008, 3, 1172–1184 CrossRef CAS PubMed.
- L. Wu, D. Di Carlo and L. Lee, Biomed. Microdevices, 2008, 10, 197–202 CrossRef CAS PubMed.
- A. Hsiao, Y. Torisawa, Y. Tung, S. Sud, R. Taichman, K. Pienta and S. Takayama, Biomaterials, 2009, 30, 3020–3027 CrossRef CAS PubMed.
- E. Kang, Y. Choi, Y. Jun, B. Chung and S. Lee, Lab Chip, 2010, 10, 2651–2654 RSC.
- C. Kim, K. Lee, J. Bang, Y. Kim, M. Kim, K. Oh, S. Lee and J. Kang, Lab Chip, 2011, 11, 874–882 RSC.
- S. Agastin, U. Giang, Y. Geng, L. DeLouise and M. King, Biomicrofluidics, 2011, 5, 024110 CrossRef PubMed.
- H. Ota, T. Kodama and N. Miki, Biomicrofluidics, 2011, 5, 034105 CrossRef PubMed.
- S. Yoon, J. A. Kim, S. H. Lee, M. Kim and T. H. Park, Lab Chip, 2013, 13, 1522–1528 RSC.
- K. Alessandri, B. R. Sarangi, V. V. Gurchenkov, B. Sinha, T. R. Kiessling, L. Fetler, F. Rico, S. Scheuring, C. Lamaze, A. Simon, S. Geraldo, D. Vignejevic, H. Domejean, L. Rolland, A. Funfak, J. Bibette, N. Bremond and P. Nassoy, Proc. Natl. Acad. Sci. U. S. A., 2013, 110, 14843–14848 CrossRef CAS PubMed.
- C. S. Shin, B. Kwak, B. Han and K. Park, Mol. Pharmaceutics, 2013, 10, 2167–2175 CrossRef CAS PubMed.
- C. Kim, J. H. Bang, Y. E. Kim, S. H. Lee and J. Y. Kang, Lab Chip, 2012, 12, 4135–4142 RSC.
- T. Das, L. Meunier, L. Barbe, D. Provencher, O. Guenat, T. Gervais and A. Mes-Masson, Biomicrofluidics, 2013, 7, 011805 CrossRef PubMed.
- K. Lee, C. Kim, J. Y. Yang, H. Lee, B. Ahn, L. Xu, J. Y. Kang and K. W. Oh, Biomicrofluidics, 2012, 6, 014114 Search PubMed.
- S. Lee, D. Y. No, E. Kang, J. Ju, D. Kim and S. Lee, Lab Chip, 2013, 13, 3529–3537 RSC.
- T. Kim, I. Doh and Y. Cho, Biomicrofluidics, 2012, 6, 034107 CrossRef PubMed.
- T. Bruns, S. Schickinger, R. Wittig and H. Schneckenburger, J. Biomed. Opt., 2012, 17, 101518 CrossRef PubMed.
- K. Luongo, A. Holton, A. Kaushik, P. Spence, B. Ng, R. Deschenes, S. Sundaram and S. Bhansali, Biomicrofluidics, 2013, 7, 034108 CrossRef PubMed.
- H. Jin, Y. Cho, J. Go, J. Kim and Y. Oh, Lab Chip, 2011, 11, 115–119 RSC.
- Y. Xu, F. Xie, T. Qiu, L. Xie, W. Xing and J. Cheng, Biomicrofluidics, 2012, 6, 016504 CrossRef PubMed.
- Y. Tung, A. Hsiao, S. Allen, Y. Torisawa, M. Ho and S. Takayama, Analyst (Cambridge, U. K.), 2010, 136, 473–478 RSC.
- K. Ziółkowska, A. Stelmachowska, R. Kwapiszewski, M. Chudy, A. Dybko and Z. Brzózka, Biosens. Bioelectron., 2013, 40, 68–74 CrossRef PubMed.
- K. Ziółkowska, K. Żukowski, M. Chudy, A. Dybko and Z. Brzózka, Proc. MicroTAS 2011, 2011, pp. 1164–1166 Search PubMed.
- H. Yao, Z. Duan, M. Wang, A. O. Awonuga, D. Rappolee and Y. Xie, Cancer Genet. Cytogenet., 2009, 190, 81–87 CrossRef CAS PubMed.
- K. Ziółkowska, E. Jędrych, R. Kwapiszewski, J. Łopacińska, M. Skolimowski and M. Chudy, Sens. Actuators, B, 2010, 145, 533–542 CrossRef PubMed.
- K. Ziółkowska, R. Kwapiszewski, A. Stelmachowska, M. Chudy, A. Dybko and Z. Brzózka, Sens. Actuators, B, 2012, 173, 908–913 CrossRef PubMed.
- J. O'Brien, I. Wilson, T. Orton and F. Pognan, Eur. J. Biochem., 2000, 267, 5421–5426 CrossRef CAS.
- A. Astashkina, B. Mann and D. Grainger, Pharmacol. Ther., 2012, 134, 82–106 CrossRef CAS PubMed.
- M. Inaba, T. Tanaka and H. Sawada, Jpn. J. Cancer Res., 1998, 89, 323–327 CrossRef CAS.
- T. Lesuffleur, S. Violette, I. Vesile-Pandrea, E. Dussaulx, A. Barbat, M. Muliers and A. Zweibaum, Int. J. Cancer, 1998, 76, 383–392 CrossRef CAS.
- A. C. Lazaris, N. G. Kawantzas, H. S. Zorzos, N. V. Tsavaris and P. S. Davaris, J. Cancer Res. Clin. Oncol., 2002, 128, 114–118 CrossRef CAS PubMed.
- I. Grivicich, A. Regner, C. Zanomi, L. P. Correa, G. P. Jotz, J. A. P. Henriques, G. Schwartsmann and A. B. da Rocha, Int. J. Colorectal Dis., 2007, 22, 1201–1208 CrossRef PubMed.
- M. Tsuruta, H. Nishibori, H. Hesegava, Y. Ishii, T. Endo, T. Kubota, M. Kitajima and Y. Kitagawa, Oncol. Rep., 2008, 20, 1165–1172 CAS.
Footnote |
| † Electronic supplementary information (ESI) available: See DOI: 10.1039/c4lc00291a |
| This journal is © The Royal Society of Chemistry 2014 |

