
 Open Access Article
 This Open Access Article is licensed under a
 Creative Commons Attribution 3.0 Unported Licence
Online combustion followed by carbon dioxide removal: evaluation of a new approach for the analysis of volatile organic substances by inductively coupled plasma optical emission spectrometry
Helmar
Wiltsche
*,
Farzaneh
Moradi
,
Paul
Tirk
and
Günter
Knapp
Institute of Analytical Chemistry and Food Chemistry, Graz University of Technology, Graz, Austria. E-mail: helmar.wiltsche@tugraz.at
First published on 4th July 2014
Abstract
A novel online combustion system was developed for the quantification of metals (Ag, Cd, Cr, Fe, La, Li, Mg, Ni, Pb, Y, Zn, and Zr) in volatile organic solvents such as acetone, methyl isobutyl ketone (MIBK), chloroform, dichloromethane, tetrachloroethane or trichloro-trifluoroethane. After combusting the sample aerosol in a commercial carbon analyzer oven in an oxygen-rich atmosphere, carbon dioxide and remaining oxygen were removed from the gas stream prior to the introduction into an inductively coupled plasma optical emission spectrometer (ICP-OES). The proposed combustion/carbon removal approach allowed stable operation of the ICP even when introducing highly volatile solvents that otherwise would have immediately extinguished the plasma. Analyte signals in halogenated solvents were found to be significantly higher than in non-halogenated ones and non-linear calibration functions were observed for all investigated analytes below 5 mg kg−1. Though a stable operation of the plasma was possible, the analyte signal intensities obtained in water were, depending on the element and the solvent, between 1.5 and 2800 times higher than in halogenated solvents.
Introduction
The introduction of volatile organic substances (e.g. solvents) into the inductively coupled plasma (ICP) can be troublesome. Reduced plasma stability, structured plasma background from molecular species (e.g. C2 or CN bands), spectral interference by carbon and soot formation on the torch or the injector are some of the problems regularly encountered in ICP-OES when introducing larger quantities of carbon. Several factors contribute to these problems: for pneumatic nebulizers the nebulization efficiency of many organic solvents is much higher than for water because of the differences in density, viscosity and surface tension.1,2 For a crossflow nebulizer and a single pass spray chamber, Kreuning et al.1 reported a nebulization efficiency of 3.8% for water but 49% for chloroform and 89% for diethylether. The decomposition of the organic solvents by the ICP requires also more energy compared to water3 giving rise to a shift of the longitudinal emission maximum.4,5 Moreover, for some elements like As and Se, carbon induced signal enhancement effects (“carbon enhancement effects”) were reported both in ICP-OES and inductively coupled plasma mass spectrometry (ICP-MS).6–10Compared to the introduction of aqueous samples the following changes to the ICP operating conditions are commonly employed: higher radio frequency (RF) power, reduced inner diameter (i.d.) of the injector and/or increased nebulizer gas flow, the use of a cooled spray chamber and the addition of oxygen to the intermediate or the nebulizer gas flow.
Nevertheless, severe disadvantages are associated with the above-mentioned changes of the ICP operating conditions: on the one hand, high RF power increases the ICP's plasma continuum but on the other hand RF generators of contemporary ICP-OES and ICP-MS instruments can rarely provide more than 1700 W. This is rather low when compared to high powered, nitrogen cooled plasma. These sources are reported to tolerate high solvent plasma loads without compromising the stability of the discharge. Greenfield et al.11 used 5.5 kW RF power and a heated spray chamber to analyze samples of organophosphorus compounds dissolved in xylene. They also demonstrated that by changing the outer gas flow (coolant gas) to oxygen and increasing the RF power to 6 kW, C2 and CN molecular bands could be effectively suppressed.12
Another way of improving the ICP's tolerance towards carbon loading is increasing the aerosol speed in the analyte channel by a higher nebulizer gas flow or smaller injector diameter. The main drawback of this approach is the deterioration of the excitation conditions in the analyte channel.
The aforementioned factors result in severe degradation of the attainable method detection limits when analyzing samples of high carbon content. This is especially troublesome for volatile organic samples.
Several authors employed cooling of the spray chamber13 or cryogenic aerosol desolvation5,14,15 to overcome the deleterious effects of organic solvents by avoiding excessive loading of the ICP. This clearly eases the stability problems of the ICP but is usually not sufficient to avoid carbon based interference. The use of membrane-based desolvation units was also extensively studied.16–19 Though satisfying results were obtained by removing solvent vapors with a membrane from the sample aerosol, an extensive study of Botto and Zhu17 revealed several shortcomings of this approach: high RF power (1750 W) and the addition of oxygen were still necessary for the analysis of highly volatile solvents like dichloromethane. Moreover, for some elements that are not commonly suspected to be volatile (e.g. B, Si) – at least when considering aqueous samples – species-dependent losses caused by the membrane were encountered. Another problematic behavior of membrane-based devices as described by Botto and Zhu was the “fouling” – i.e. slow clogging of the pores – of the membrane by non-volatile oil. This fouling becomes particularly troublesome if polymers or other organic solids are dissolved in the solvent as encountered by the authors of this article.
One way of overcoming the problems associated with carbon loading of the ICP without being restricted by the solvent or the composition of the sample is to burn the sample in the presence of oxygen and remove both the evolved carbon dioxide and the remaining oxygen before the introduction of the gas stream into the ICP. The aim of this investigation was to evaluate the feasibility of this approach.
Experimental
Online combustion system
The combustion of organic samples for the subsequent determination of C, N, S, Cl, etc. is a well-established analytical procedure. The online combustion system shown in Fig. 1 comprised a commercial carbon analyzer oven (Multi EA5000, Analytik Jena, Germany) and a separation device for carbon dioxide removal. This setup was installed between the aerosol exit of the spray chamber and the torch of the ICP. The sample aerosol was mixed with additional argon and oxygen in the carbon analyzer oven where the combustion took place at 1050 °C, effectively burning all carbon to CO2. The oven temperature was not optimized as it only needs to be high enough to ensure complete combustion. The instrument manufacturer's recommendation of 1050 °C was used throughout. The flow of argon and oxygen added to the aerosol during combustion was optimized in a way that deposition of soot in the oven was avoided even when introducing MIBK or dichloromethane. Detailed operating conditions of the oven are listed in Table 1. The main component of the combustion oven is the combustion tube consisting of two concentric quartz glass tubes. The sample aerosol is introduced into the inner tube, mixed with Ar and – depending on the experimental conditions – O2 and heated. In this tube the sample undergoes a pyrolysis process in a “fuel-rich” atmosphere. The pyrolysis products leave the inner combustion tube through slots at the bottom and enter a very oxygen-rich atmosphere enclosed by the outer combustion tube. Here the combustion is completed.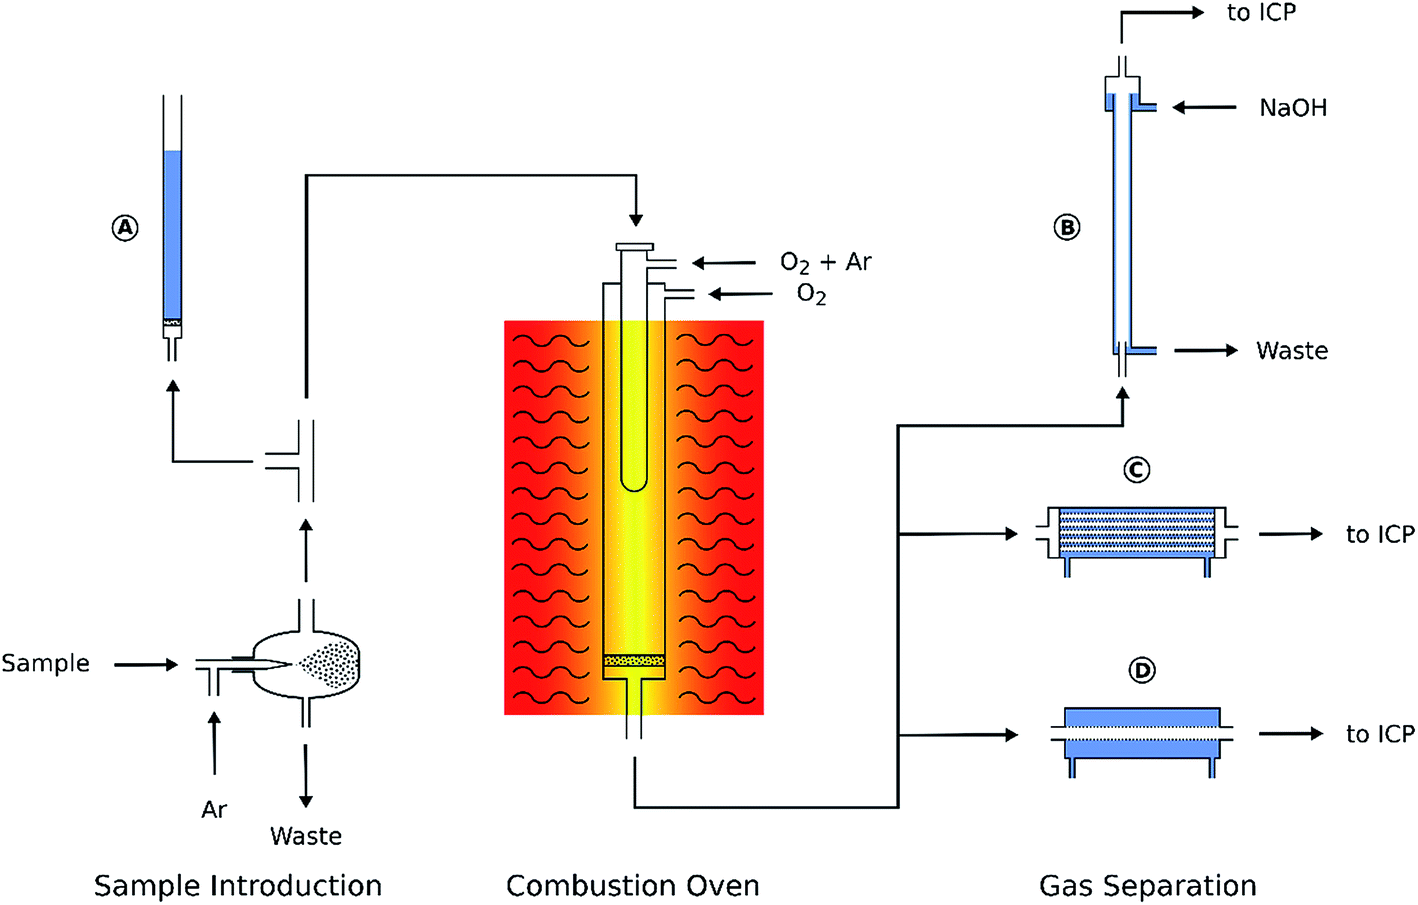 | ||
| Fig. 1 Schematic of the online combustion system. (A) Overpressure safety system, (B) falling-film column, (C) hollow fiber gas exchanger, and (D) PTFE membrane desolvator. | ||
| Instrument and parameter | Value |
|---|---|
| Oven | |
| Multi-purpose combustion tube | |
| Combustion tube temperature | 1050 °C |
| Combustion tube outer gas flow | 0.3 L min−1 O2 |
| Combustion tube inner gas flow (post-combustion phase) | 0.07 L min−1 O2 + 0.13 L min−1 Ar |
| Membrane desolvator | |
| Sweep gas flow | 1.0 L min−1 Ar |
| Membrane temperature | 130 °C |
The polytetrafluoroethylene (PTFE) membrane filter commonly installed at the exit port of the combustion oven had to be removed. Due to the glass frit inside the combustion tube the oven operates at a slight overpressure of about 0.05 bar. For security reasons a T-piece was installed in the aerosol transfer tube connecting the spray chamber to the oven entrance. The third port of the T-piece was connected with a small inner diameter PTFE tube to a water filled glass tube (Fig. 1A). By adjusting the water level inside this tube any inadverted pressure increase inside the combustion oven (e.g. soot deposition on the glass frit) could be detected by the appearance of gas bubbles.
In this work three means of removing the carbon dioxide from the aerosol that left the oven were investigated:
First, a falling-film column was built from a 0.8 m glass tube with an inner diameter of 20 mm. The aerosol entered the vertical column through a glass tube (5 mm i.d.) from the bottom while a thin film of 10 g L−1 NaOH solution was flowing down the column wall (Fig. 1B) and absorbing the CO2 from the gas stream.
In addition, two membrane based gas exchange devices were examined: a hollow fiber gas exchanger (HMM0004 P84HS, Evonik, Austria) containing a 60 cm long fiber bundle of about 48 mm diameter (Fig. 1C). The fibers were installed inside a stainless steel tube that could be flushed with an argon sweep gas stream. The aerosol passed through the hollow fibers and CO2 and O2 were removed by diffusion. The second gas exchange device (Fig. 1D) was a commercial PTFE membrane desolvator (MDX200, Cetac Technologies, USA). The sweep gas exit port of both membrane based gas exchange devices was vented into a fume cupboard as – depending on the solvent used – Cl2, HCl or in some cases HF was released.
After combustion and subsequent treating of the aerosol in either the falling film column or one of the gas exchange devices, it was transported to the ICP torch by a 1.5 m PTFE tube (5 mm i.d.).
Instrumentation
All measurements were carried out using an axially viewed ICP-OES (CIROS Vision EOP, Spectro, Germany). The operating conditions are reported in Table 2 unless otherwise stated.| Torch | Standard torch, injector with 2.5 mm i.d. |
| RF power | 1650 W |
| Outer gas flow | 14.5 L min−1 |
| Intermediate gas flow | 0.6 L min−1 |
| Nebulizer gas flow | 0.3 L min−1 |
| Spray chamber | Cyclonic; baffled and cooled to −20.0 ± 0.5 °C |
| Nebulizer | Mira Mist, Burgener Research, USA |
| Peristaltic pump tubing | Glass Expansion Tygon MH 2075; 0.64 mm i.d. |
The samples were nebulized in a cooled spray chamber to avoid excessive solvent load in experiments without combustion. The selected ICP operation conditions maintained a stable discharge even under conditions of high carbon loading. For the sake of comparability between different experiments the cooled spray chamber and the same ICP operating conditions were used throughout this work.
Additional diagnostic techniques
The oxygen concentration in the gas stream leaving the membrane desolvator was quantified using a fiber-optical oxygen meter (Firesting O2, Pyro Science, Germany) equipped with a retractable optical mini-sensor (OXR430, 430 μm fiber diameter, Pyro Science, Germany). Sensor calibration was checked with pure nitrogen and a premixed calibration gas (20% O2 80% N2, Linde, Austria).The carbon dioxide concentration in the gas stream leaving the membrane desolvator was determined using a dual-channel non dispersive infrared CO2 sensor module (General Electric Telaire T6615, USA). Pure nitrogen (5.0 quality, Linde, Austria) and a premixed calibration gas (2% v/v CO2 in N2, Linde, Austria) were used for CO2 sensor module calibration.
The nebulization efficiency and mass flow of the solvent introduced into the ICP were determined using the well-established method of continuous weighing.20 Briefly, the sample was pumped from a glass beaker to the nebulizer and spray chamber where the aerosol was formed. Some of the liquid then left the spray chamber via the aerosol exit port whereas the rest was pumped from the drain port of the spray chamber back to the beaker. The beaker itself was placed on a balance (Sartorius AC210S) and the amount of liquid per unit of time that left the spray chamber as aerosol could be determined by recording the weight of the beaker as a function of time. The balance was put in a continuous weighing mode and the data regarding the weight were recorded every 200 ms in a computer. For volatile solvents the evaporation from the glass beaker caused a small but significant error. Therefore the nebulization efficiency data were corrected by the evaporation rate of the solvent from the beaker.
Reagents
Solvents of p.a. quality were used throughout. Standards were gravimetrically prepared from oil- or toluene-based single element metallo-organic solutions (Cr, Fe, Mg, Ni: Conostan; USA; Cd, Pb, Y, Zn: Alfa Aesar, Germany; Ag, La, Li: VHG Labs, USA) with a concentration of 1000 mg kg−1. Aqueous multi-element solutions were prepared from a commercial 100 mg L−1 28 element stock solution (Al, Ag, As, B, Ba, Be, Bi, Ca, Cd, Co, Cr, Cu, Fe, K, Li, Mg, Mn, Mo, Na, Ni, Pb, Sb, Se, Sr, Ti, Tl, V, and Zn in 5% HNO3, Roth, Germany) and high purity water (18 MΩ cm−1, Barstead Nanopur, Thermo Fisher Scientific, USA).Results and discussion
Solvent loading of the ICP
It is well known1,5,20–23 that due to differences in viscosity, density and surface tension the nebulization efficiency of organic solvents is usually higher than that of water. Using the conditions reported in Table 2 the aerosol solvent load and the corresponding nebulization efficiency and aerosol carbon load were determined by the method of continuous weighing20 for a number of common organic solvents. The results listed in Table 3 clearly show that the nebulization of solvents like acetone or diethyl ether will cause heavy carbon loading of the ICP whereas methanol or butanol represent a lower burden for the plasma.| Solvent | Nebulization efficiency, % | Aerosol solvent load, mg solvent min−1 | Aerosol carbon load, mg C min−1 |
|---|---|---|---|
| Acetone | 11 | 96 | 60 |
| Dichloromethane | 17 | 258 | 37 |
| Diethyl ether | 47 | 297 | 193 |
| Butanol | 3.7 | 32 | 21 |
| Methanol | 5.9 | 50 | 19 |
| MIBK | 6.2 | 51 | 37 |
| Water | 2.4 | 46 | — |
Effect of oxygen on the ICP
The introduction of molecular gases like oxygen is known to affect the excitation properties of the ICP.24 Compared to other approaches, where a small amount of oxygen25,26 (a few mL min−1) was added to the intermediate or inner gas flow of the torch to avoid soot deposition, the setup used in this work operated at a much higher oxygen concentration to facilitate complete combustion and avoid soot-induced clogging of the oven.As the combustion oven always adds argon and oxygen to the aerosol prior and during combustion, the setup for studying the effect of oxygen on the ICP was slightly modified: the spray chamber was disconnected from the oven and the oven entrance was tightly sealed. The Ar/O2 mixture (0.3 L min−1 O2 and 0.2 L min−1 Ar; note that the combustion conditions in the final setup introduced even slightly more oxygen as listed in Table 1) leaving the exit port of the oven was then combined with the aqueous aerosol (10 mg L−1 multi-element solution) from the spray chamber and introduced into the ICP. To simulate the conditions without the presence of oxygen, the aerosol was mixed with 0.5 L min−1 Ar from an additional mass flow controller after the spray chamber, making up for the Ar/O2 mixture that was otherwise added by the combustion oven. Keeping the gas flow in the ICP-torch’s injector constant was considered to be important, as it is well known, that the gas velocity inside the plasma's analytical channel is of significance to the emission signal.
The effect of oxygen on the ICP is rather deleterious as shown in Fig. 2. Although the RF power in all experiments was very high (1650 W) the introduction of oxygen by the combustion oven resulted in a suppression of atomic emission lines by a factor of 2 to 9 whereas ionic line emission was reduced 9 to 60 times when compared to the emission signal of the same line in the absence of oxygen. It is interesting to note, that with exception of the two Ar(I) emission lines investigated (404.442 and 430.010 nm; line energy 14.7 and 14.5 eV, respectively) all atom emission line suppression factors increase with the line energy. The reason for this behavior could be a significant change in the ICP's excitation temperature. Clearly, the presence of larger volume fractions of oxygen in the carrier gas stream entering the ICP should be avoided.
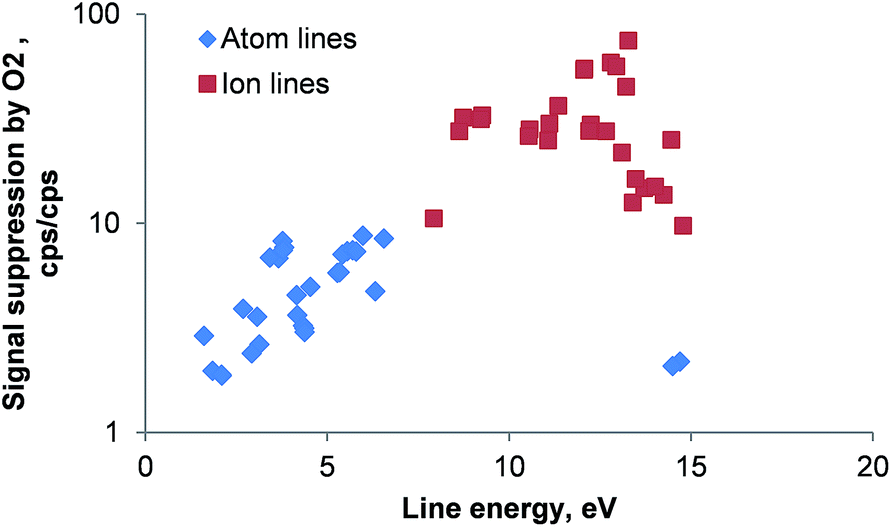 | ||
| Fig. 2 Signal suppression of 56 emission lines by 0.3 L min−1 oxygen as a function of the emission line energy. An aqueous 10 mg L−1 multi-element solution containing 28 elements was used. For atomic lines the excitation energy was used whereas for ionic lines the energy sum of excitation and ionization energies was plotted. Line energies are taken from ref. 27; error bars are not plotted for clarity; RSD for all lines <5%; n = 5; note the logarithmic scale. | ||
Removal of CO2 and oxygen after combustion
The experimental setup used for comparing the three gas treatment devices was similar: applying the conditions reported in Table 2, a solution containing 50 mg L−1 Ca, Cu, Co, Fe, Mg, Mn, Na, Ni, Ti, and Zn in butanol was nebulized in the spray chamber, the aerosol was then burned in the combustion oven and the gas stream that left the oven was passed through one of the gas treatment devices. Blank readings were obtained from pure butanol.Falling-film column
The falling-film column was considered a cheap and easy way of removing carbon dioxide from the aerosol. Three setups using the falling-film column were investigated: in the first experiment the combusted aerosol was directed through the empty and dry column prior the introduction into the ICP. In the second experiment the walls of the falling-film column were constantly wetted by a stream of 10 mL min−1 NaOH solution and in the third experiment, the column was dried again and filled with 30 cm Raschig rings (5 mm diameter, 5 mm length). No liquid was employed in this experiment.As shown in Fig. 3 the falling-film column does not improve the emission signal of the investigated analytes. Much to the contrary, the signal loss – expressed as the ratio between the emission intensity without the column and the emission intensity with the column in place – is about a factor of 3 for the dry column and a factor of 2 for the wetted column. This behavior can be explained quite well when considering the huge signal losses in the presence of the Raschig rings inside the dry column: a large proportion of water generated during the combustion is deposited on the Raschig rings. This causes a loss of a large fraction of the analyte aerosol, making the concept of a falling-film column in this application impractical. The slightly reduced signal suppression when using the NaOH solution can be attributed to a reduced carbon loading of the ICP as significant proportions of CO2 are removed from the gas stream. This is supported by the fact that the plasma robustness28 (Mg(II) 280.270 nm/Mg(I) 285.213 nm ratio) increased from 3.7 (without column) to 5.3 when the falling-film column was used.
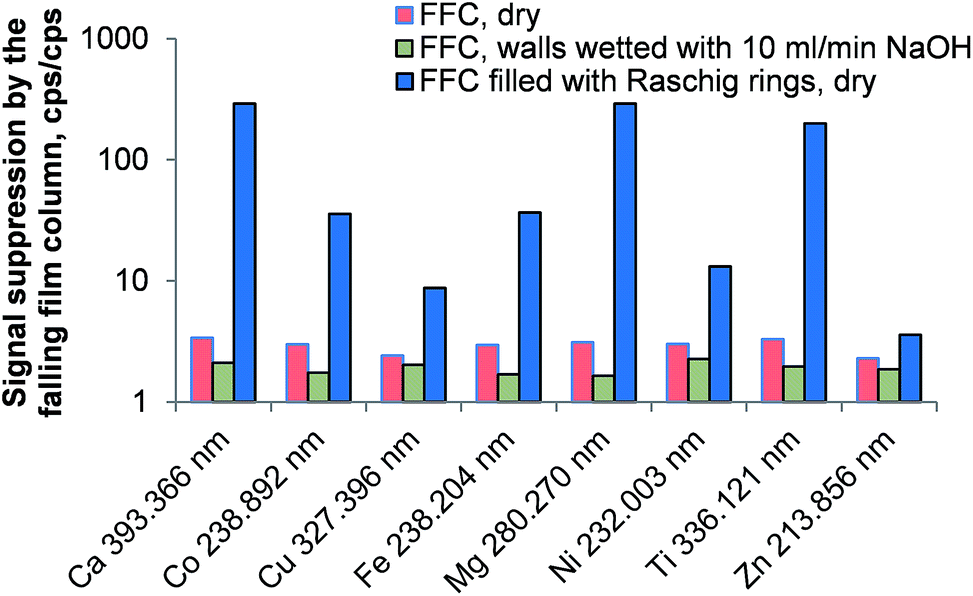 | ||
| Fig. 3 Signal suppression caused by the falling-film column at different conditions compared to the emission signal of each line when the aerosol leaving the combustion oven was directly introduced into the ICP. Error bars are not plotted for clarity; RSD for all lines <5%; n = 5. | ||
Another severe disadvantage of the falling-film column is its inability to remove oxygen residues from the combustion oven. Though it might be possible to remove oxygen as well (e.g. by using a Fe2+ washing solution in a separate column) this concept would involve even more reagents and instrumentation.
Hollow fiber gas exchange device
The hollow fiber gas exchange device and the PTFE membrane-based desolvator are capable of removing both CO2 and excess O2 from the combusted aerosol by diffusion. Both devices rely on an argon sweep gas stream flowing countercurrent to the sample aerosol stream around the hollow fiber or PTFE membrane.As shown in Fig. 4 there is a loss in signal intensity by a factor of 13 to 21 when comparing the emission intensities without and with the hollow fiber membrane in place. Even at the optimum sweep gas flow of 0.5 L min−1 Ar, the emission signals are a factor of 3 to 8 lower than without the hollow fiber gas exchange device. Again, condensation of water in the gas exchange device's stainless steel body was observed, explaining at least partially the large signal loss in this device. Constrained by recommendations of the manufacturer, it was not attempted to heat the gas exchange device as this would have resulted in a system degeneration above about 70–80 °C.
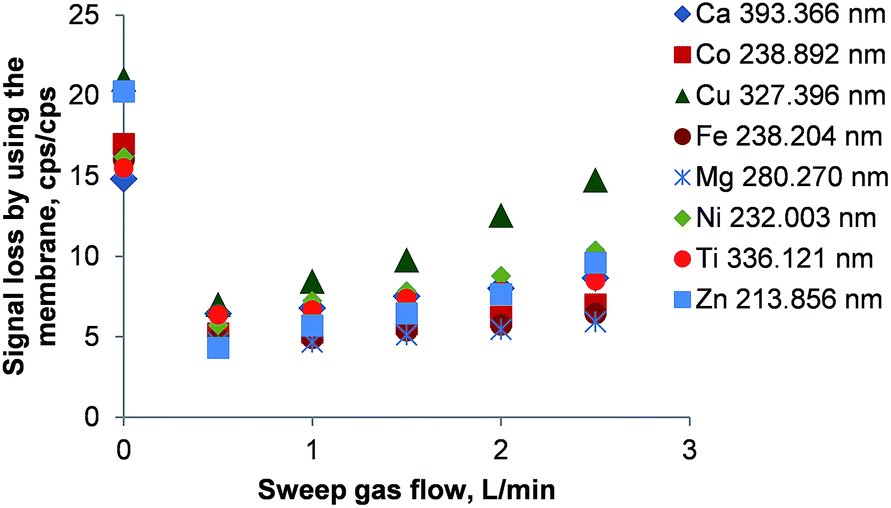 | ||
| Fig. 4 Signal loss using the hollow fiber gas exchange device as a function of sweep gas flow. The signal loss is defined as the ratio of intensities without/with the membrane. Error bars are smaller than the data points. | ||
The reduced signal loss at 0.5 L min−1 Ar as sweep gas can be attributed to the removal of CO2 and O2 from the aerosol. This is also reflected by an increase of the plasma stability (Mg II/Mg I ratio) from 3.6 to 6.1. Another increase in sweep gas flow to 1 L min−1 enhanced the plasma stability only slightly to 6.8 and remained unchanged until 2.5 L min−1. Simultaneously, a steady element-dependent rise in the signal loss was observed that seems to be caused by the pressure gradient inside the membrane desolvator.
PTFE membrane-based aerosol desolvator
As condensation of water seemed to be the unifying problem of both the falling-film column and the hollow fiber gas separation device, a commercial PTFE membrane-based desolvation unit was investigated. In this unit the membrane can be heated to temperatures well above 100 °C. Thereby, water condensation is circumvented.Initial experiments were conducted with a 2 m PVC transfer line (3 mm i.d.) connecting the membrane desolvator to the ICP. The PTFE membrane was heated to 110 °C and the argon sweep gas flow was varied between 1 and 2.5 L min−1 in steps of 0.5 L min−1. As in all other experiments the emission signal of the investigated elements obtained without the membrane was used for signal normalization.
The enhancement of the emission lines using the membrane desolvator is shown in Fig. 5. As CO2 and O2 are partially removed the emission intensity of all lines increased significantly. Due to the fundamental mechanisms of line excitation not all lines show the maximum enhancement at the same sweep gas flow.
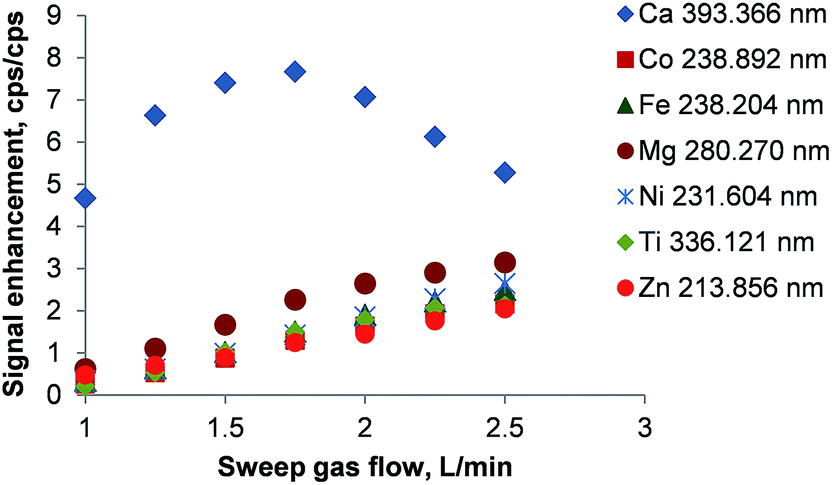 | ||
| Fig. 5 Signal enhancement by using the PTFE membrane desolvator. The signal enhancement is defined as the ratio of intensities with/without the membrane. Error bars are smaller than the data points. | ||
The aerosol transfer line between the oven and the membrane desolvator was 0.2 m (5 mm i.d.) long and wrapped with aluminum foil, effectively preventing the condensation of water. In the final setup, the membrane temperature was increased to 130 °C.
From the above discussion it is evident that the PTFE membrane-based aerosol desolvator is the only viable way of removing carbon dioxide and oxygen. Both falling-film column and hollow fiber gas exchange device suffered from a significant analyte loss (about a factor of 10 to 100 for the falling film column and a factor of 5 for the hollow fiber gas exchange device) due to condensation of water.
Optimization of the combustion conditions
The absence of oxygen in the oven's inner combustion tube resulted in unstable emission signal intensities as shown in Fig. 6. Even 300 s after the introduction of a 1 mg kg−1 multi-element solution in dichloromethane the signals of Fe, Li, Mg, Y, and Zn increased and stabilized only after about 400 s. Cr and Li showed a peculiar transient profile wherein the highest signal intensity was encountered immediately after the sample reached the oven for the first time following a decrease of both signals. The Li signal rose again slowly after a local minimum at about 105 s. This behavior might be explained by the formation of carbides: CrC is a refractory material with a boiling point of 3800 °C (ref. 29) and lithium is also reported to form Li2C2 at temperatures above 1000 °C.29 Initially, the inner surface of the combustion tube was not covered with carbon. Therefore Cr and Li were not retained in the inner combustion tube. As soon as soot started to build up in the inner tube, elements like Cr and to some extent Li were partially trapped reducing the respective emission signals. The fact that soot deposition inside the inner combustion tube was observed visually supports this theory. It is important to note that after each measurement the combustion tube was cleaned by changing the inner gas flow of the combustion oven to 0.2 L min−1 oxygen for 45 s (the so called “post-combustion phase”). Thereby reproducible conditions were maintained between the individual sample runs.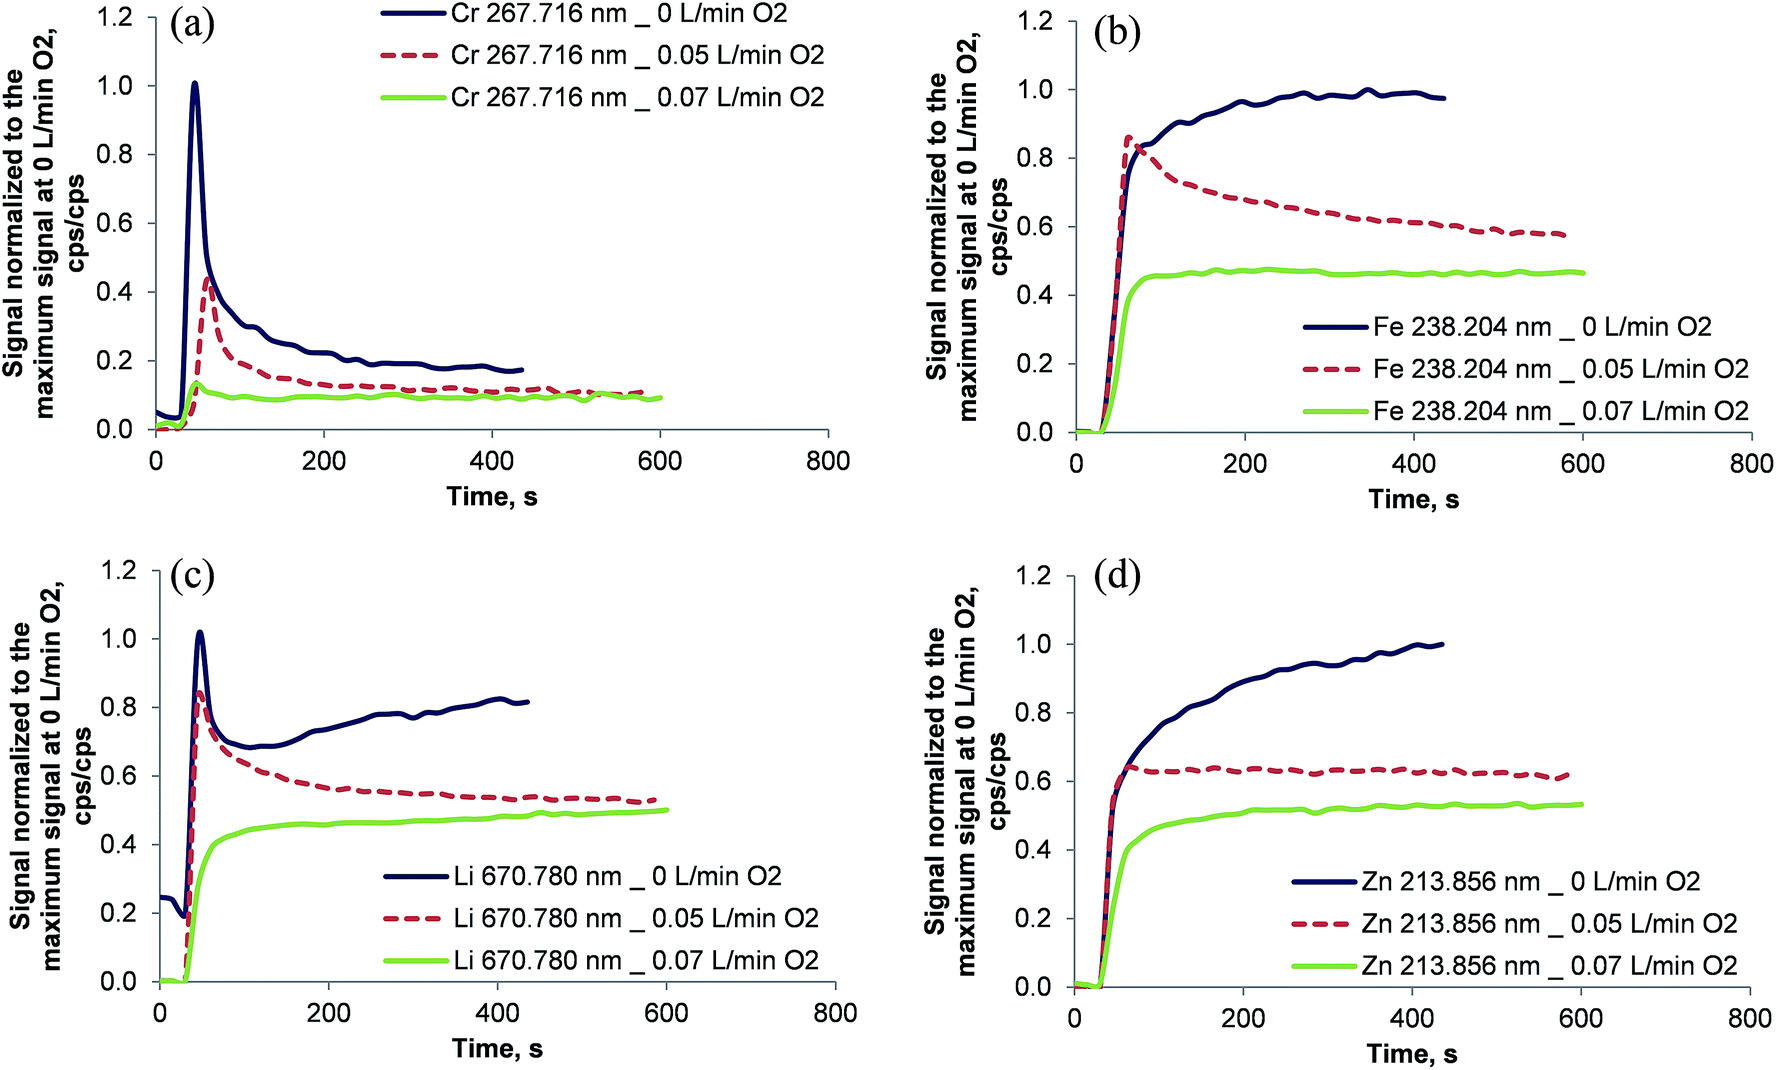 | ||
| Fig. 6 Signal response after the introduction of 1 mg kg−1 Cr, Fe, Li, and Zn dissolved in dichloromethane for different levels of oxygen in the inner combustion tube. The signals were normalized to the maximum obtained signal intensity at 0 L min−1 oxygen in the inner combustion tube. Note that it takes 45 s for the sample to be pumped from the autosampler cup to the spray chamber. | ||
Clearly, soot deposition must be avoided inside the inner combustion tube. Due to the completely different temporal analyte profiles the use of an internal standard cannot be expected to compensate for the effect of soot formation in multi-element analysis.
In order to avoid soot deposition in the inner combustion tube oxygen was also added during the analysis and not only during the post-combustion phase. The fully computer-controlled oven allows the addition of oxygen to the inner combustion tube only in the post-combustion phase. Consequently, the oven was programmed for a long post-combustion phase of 700 s with either 0.05 L min−1 oxygen + 0.15 L min−1 argon or 0.07 L min−1 oxygen + 0.13 L min−1 argon in the inner combustion tube. For security reasons it was not attempted to increase the oxygen flow in the inner combustion tube above 0.07 L min−1. It is interesting to note that with 0.07 L min−1 oxygen + 0.13 L min−1 argon no soot formation was observed even with highly volatile solvents.
With increasing amounts of oxygen in the inner combustion tube, the transient emission signals reached a steady state faster, as shown in Fig. 6. For Ag, Ba, Cd, Cr, Fe, Li, Mg, Ni, Pb, Y, and Zn (not all data shown in Fig. 6) a stable signal was reached after about 180 s when the gas mixture in the inner combustion tube was 0.07 L min−1 oxygen + 0.13 L min−1 argon. Further experiments were conducted using the same gas mixture.
With Y as internal standard the system's short term stability expressed as the RSD of 10 consecutive measurements of a 1 mg kg−1 Ag, Cd, Cr, Fe, Li, Mg, Ni, Y, and Zn standard in dichloromethane was between 1 and 6%. Only for nickel the RSD was 8%.
Composition of the gas stream introduced into the ICP
As noted earlier, oxygen and carbon dioxide have deteriorating effects on the ICP discharge. After the optimization of the combustion process and the membrane desolvator, the composition of the gas stream entering the ICP was investigated. It is important to mention that any throttling of the gas stream had to be avoided as this would have resulted in a change of the membrane desolvator's pressure balance. Due to the alterations of the plasma's thermal conductivity30 and the resulting changes in the ICP's excitation conditions any plasma-based spectroscopic quantification attempt for oxygen and carbon dioxide must be considered unreliable in the context of this work. Therefore, alternative spectroscopic techniques were used with dichloromethane as the representative test solvent.When dichloromethane was introduced into the system under the optimized operating conditions reported in Table 1, the CO2 concentration in the gas stream that left the membrane desolvator quickly rose to 0.16% (v/v) and stabilized at 0.177 ± 0.002% (v/v; n = 3) within 60 s. Upon stopping the introduction of dichloromethane to the spray chamber it took 180 s to reach the baseline again as the remaining solvent in the spray chamber continued to evaporate at low speed.
The oxygen concentration in the gas stream that left the membrane desolvator was quantified using a fiber-optical oxygen meter. It was found that the membrane desolvator removed the oxygen rather efficiently from the introduced gas stream. The aerosol entered the membrane desolvator with about 46% oxygen and left it with no more than 1.3%. The transient signal of the oxygen concentration in the gas stream that left the membrane desolvator showed a distinct profile: 30 s after the combustion oven program was started, the oven switched from the combustion phase to the post-combustion phase introducing 0.07 L min−1 oxygen into the center combustion tube. At this point the nebulization of the sample was initiated. The additional oxygen added in the post-combustion phase caused an increase in oxygen concentration of the gas flow that left the membrane desolvator. When the sample aerosol reached the combustion oven, the oxygen concentration in the gas stream that enters the ICP increased sharply (shown in Fig. 7 after 130 s) to 1.28% and then decayed swiftly towards a steady level of 1.26% that remained steady until the introduction of sample to the spray chamber was stopped.
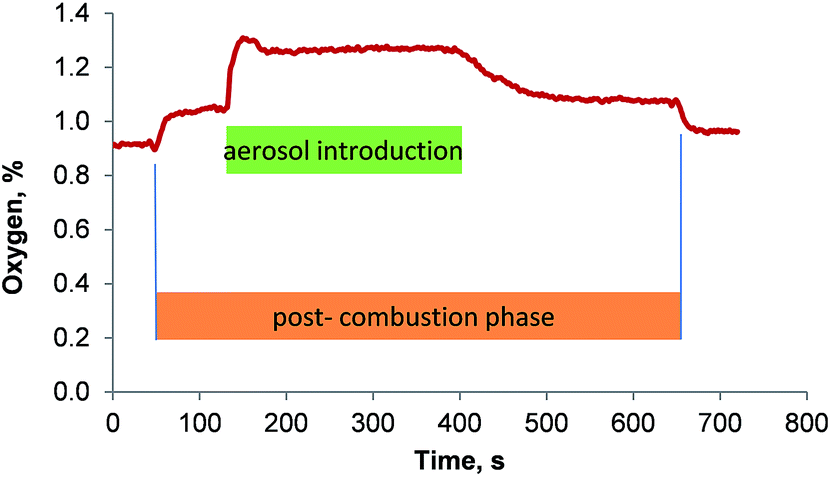 | ||
| Fig. 7 Oxygen concentration in the gas stream that leaves the membrane desolvator as a function of time. | ||
Influence of intramolecular chlorine on the metal release in the oven
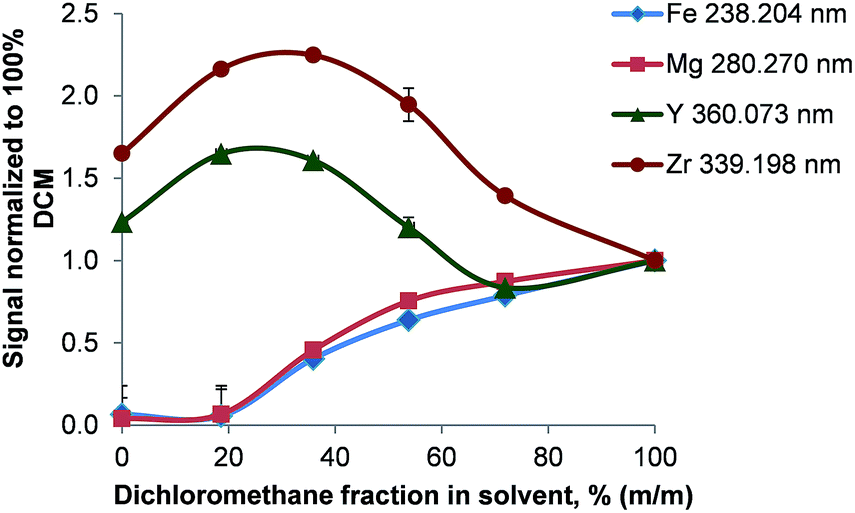
The conditions during the combustion are characterized by the presence of a large excess of oxygen resulting in an increased formation of metal oxides. Upon passing through the glass frit located at the very bottom of the combustion tube, some of these oxides are potentially retained inside the oven. This theory is supported by the remobilization of metals by halogens: after the introduction of 50 mg L−1 Ca, Cu, Co, Fe, Mg, Mn, Na, Ni, Ti, and Zn in butanol, the signals of all analytes dropped to a blank level within 45 s when switching to pure butanol and a blank measured immediately afterwards suggested no remaining contamination. A subsequent introduction of dichloromethane resulted in a detector saturation for all analytes. This indicates instantaneous mobilization of metals trapped inside the combustion oven – most likely in the high surface glass frit installed at the lower end of the combustion tube. To further support the theory of metal releasing action of halogenes, solutions of constant analyte concentration but different ratios between a non-halogenated and a halogenated solvent (4-methylpentan-2-one – MIBK and dichloromethane respectively) were analyzed.As shown in Fig. 8 the analyte signals increased for Ag, Cd, Fe, Li, Mg, Ni, Pb, and Zn with rising concentration of dichloromethane. In pure MIBK the emission intensities of Ag, Cd, Fe, Li, Mg, Ni, Pb, and Zn were between 15 (Fe) and 4000 (Li) times lower than in pure dichloromethane. This clearly shows that the presence of HCl and Cl2, which are formed during the combustion, prevents the deposition of analytes in the oven. This is also apparent when considering that the melting points of all analyte chlorides are significantly lower than those of the corresponding oxides or carbides as listed in Table 4. For the chlorides of Cd, Fe, Pb, Zn, and Zr the boiling point is also lower than the combustion temperature leading to efficient vaporization in the oven and high transport efficiency. In this context it should also be pointed out that the RSDs for Ag, Cd, Fe, Li, Mg, Ni, Pb, and Zn decreased from 10–15% to <3% when the dichloromethane content of the solvent mixture was increased from ≤18% (m/m) to ≥38% (m/m) dichloromethane. As even in pure MIBK the emission signals of these metals were at least 10 times higher than the SD of the background, the signal fluctuation causing the large RSDs must be attributed to other factors rather than the ICP.
 | ||
| Fig. 8 Variation of the analyte signal as a function of the solvent composition (MIBK/dichloromethane); n = 3. | ||
| Substance | Melting point | Boiling point |
|---|---|---|
| Ag2O | 830 °C | |
| AgCl | 455 °C | 1557 °C |
| CdO | 1559 °C; sublimation | |
| CdCl2 | 568 °C | 970 °C |
| CrO3 | Decomposes at 220 °C to Cr2O3 | |
| Cr2O3 | 2266 °C | 3000 °C |
| CrC | 3000 °C | 3800 °C |
| CrCl3 | 1150 °C | |
| Fe2O3 | 1565 °C | |
| Fe3C | 1650 °C | |
| FeCl3 | 306 °C; sublimation starts at 120 °C | |
| Li2O | 1440 °C | |
| LiCl | 610 °C | 1360 °C |
| MgO | 2800 °C | |
| MgCl2 | 712 °C | 1412 °C |
| NiO | 1990 °C | |
| NiCl2 | 968 °C; sublimation | |
| PbO | 886 °C | 1472 °C |
| PbCl2 | 498 °C | 951 °C |
| Y2O2 | 2440 °C | 4300 °C |
| YCl3 | 700 °C | 1500 °C |
| ZnO | 1975 °C | 2350 °C |
| ZnCl2 | 290 °C | 732 °C |
| ZrO2 | 2700 °C | 4300 °C |
| ZrC | 3250 °C | 5650 °C |
| ZrCl4 | 331 °C; sublimation |
Y and Zn signals obtained in pure MIBK were found to be 1.2 and 1.6 times higher than in dichloromethane. Nevertheless, moderate dichloromethane concentrations in the solvent increased the signals to 1.6- and 2.2-fold compared to pure dichloromethane. This is surprising as ZrCl4 sublimates well below the oven temperature whereas YCl3 boils at 1300 °C. Though the reason for this behavior is unclear, two mechanisms might be of importance: firstly, ZrO2 and not ZrCl4 can be the main Zr compound leaving the oven. As ZrCl4 is commonly synthesized by treating ZrO2 with carbon and chlorine at temperatures of about 900 °C,29 a lack of Cl2 in the oven could prevent this formation. Secondly, ZrCl4 might already hydrolyze partially to ZrOCl2 inside the oven and thereby reduce its volatility. Summing up, the chemical reactions inside the oven are complex and depend on the solvent and the oven conditions used.
Calibration
Calibration functions of Ag, Cd, Cr, Fe, La, Li, Mg, Ni, Pb, and Zn in dichloromethane were recorded in the concentration range of 0 to 22 mg kg−1 (10 standards). All elements showed non-linear behavior of the calibration functions for low concentrations as demonstrated in Fig. 9. Though the precision of the 1, 3 and 5 mg kg−1 calibration standards was high (about 3% RSD for all reported lines) a significantly lower slope was encountered than for the more concentrated calibration solutions. Above 5 mg kg−1 all analytes had a linear signal response except Cr and La. Similar behavior of the calibration functions was also observed in acetone, butanol, chloroform, MIBK, and tetrachloro-ethane. The calibration functions of Cr and La on the other hand were S-shaped. It is important to note that this curvature of the calibration function at higher concentrations was found also for several emission lines of the same element (e.g. Cr(II) 205.552 nm and Cr(II) 267.716 nm or La(II) 333.749 nm and La(II) 408.672 nm).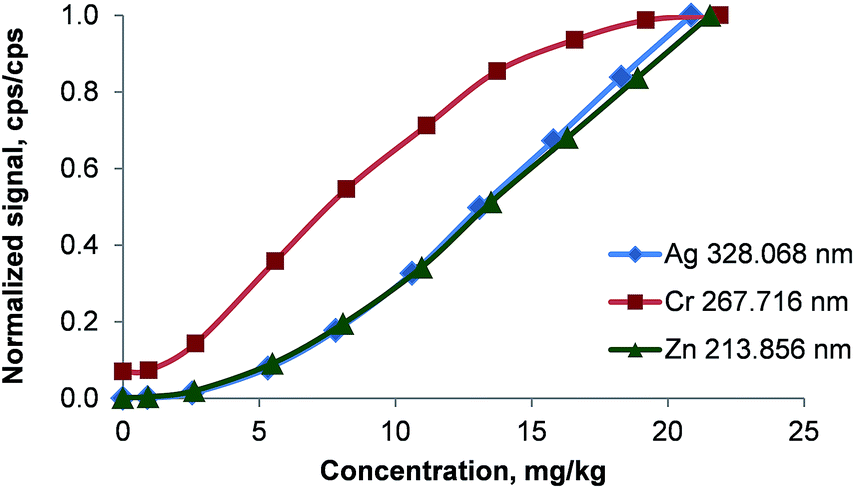 | ||
| Fig. 9 Calibration functions of Ag, Cr, and Zn in dichloromethane. Signals were normalized to the intensity of the highest calibration standard for comparability. Error bars are smaller than the data points. | ||
The element-independent onset of the linear section of the calibration function indicates an effect related to the sample introduction (combustion oven or membrane desolvator). As the analyte emission signals for standards of <5 mg kg−1 were far higher than that of the plasma background (S/N ≫ 100), the curvature of the calibration function cannot be attributed to an approach towards the LOQ. To prove the possibility of analyte quantification even in this nonlinear region of the calibration function, a synthetic sample containing about 2 mg kg−1 of Ag, Cd, Cr, Fe, La, Li, Mg, Ni, Pb, and Zn in dichloromethane was investigated. 4 calibration standards in the range of 0.5 to 6 mg kg−1 were used to characterize a second order polynomial as calibration function. The determined concentration in the test sample was between 91 and 107% of the target value for Ag, Cd, Cr, Li, Mg, Pb, and Zn. The signal of Fe was not significantly larger than the blank value (<3σ of the background). This experiment shows that even in the curved region of the calibration function analyte quantification is possible.
It should be noted that due to the curvature of the calibration function at low concentrations any evaluation based on a linear regression model will fail. Also a second order polynomial – though applicable for the curved low concentration region – is not capable of modeling the linear dependence of the signal on the analyte concentration in the higher concentration range. Due to the lack of an applicable non-linear model, LODs and LOQs were not calculated. With the exception of Cr and La all analytes showed a linear signal response up to the highest tested concentration of 70 mg kg−1 if the used emission line was within the linear detector range.
Analyte response for different solvents
Due to the non-linearity of the calibration function at low concentrations, the dependence of the analyte response on the used solvent is reported as sensitivity factors: by dividing the signal obtained from a solution of 10 mg kg−1 analyte in an aqueous standard by the signal of a 10 mg kg−1 analyte in an organic solvent, a sensitivity factor was calculated that allows the comparison between different solvents. The signal of the aqueous standard was obtained using the ICP conditions reported in Table 2 but without using the combustion oven and the membrane desolvator. In this experiment no oxygen was admixed to the sample aerosol resulting in a signal representing standard aqueous conditions. Thereby a comparison between aqueous and “organic solvent” conditions is possible.In all investigated organic solvents the analyte emission intensities were significantly lower than those obtained for aqueous solutions as shown in Table 5. The direct introduction (cooled spray chamber only – no combustion or desolvation) of the volatile solvents such as acetone, chloroform, dichloromethane, tetrachloroethane and 1,1,2-trichloro-1,2,2-trifloroethane extinguished the ICP irrespective of the plasma conditions used.
| Element emission line, nm | Acetone | Butanol | Chloro-form | Dichloro-methane | MIBK | Tetra-chloro-ethane | 1,1,2-Trichloro-1,2,2-trifloro-ethane |
|---|---|---|---|---|---|---|---|
| Ag 328.068 | ND | ND | 6.4 | 8.2 | 4700 | 27 | 4.9 |
| Cd 214.438 | ND | ND | 19 | 21 | 12![[thin space (1/6-em)]](https://www.rsc.org/images/entities/char_2009.gif) 000 000 |
84 | 15 |
| Cr 205.552 | ND | ND | 590 | 320 | 110 | 2800 | 380 |
| Fe 238.204 | 440 | 64 | 15 | 21 | 110 | 69 | 4.9 |
| La 408.672 | ND | ND | 0.7 | 1.2 | 3.0 | 36 | 1.5 |
| Li 670.780 | 7400 | ND | 6.7 | 9.6 | ND | 49 | 5.0 |
| Mg 280.270 | 260 | 60 | 6.2 | 10 | 170 | 46 | 3.1 |
| Ni 221.648 | 1000 | 99 | 17 | 19 | 460 | 69 | SIF (Si) |
| Pb 220.353 | ND | ND | 57 | 70 | 2800 | 260 | 33 |
| Y 371.030 | ND | ND | 1.0 | 6.0 | 3.0 | 16 | 4.2 |
| Zn 213.856 | 3300 | 340 | 26 | 24 | 53000 |
110 | 2.4 |
| Zr 343.823 | ND | ND | 2.8 | 3.5 | 2.2 | 14 | 0.3 |
The data shown in Table 5 support the theory of the transport efficiency enhancing property of halogens on several analytes: for Ag, Cd, Li, Mg, Ni, Pb, and Zn the sensitivity factors were between two and three orders of magnitude lower in halogenated solvents than in non-halogenated ones. This is also in good agreement with the findings presented in Fig. 8. For Cr and Fe the transport efficiency enhancing effect of halogens was less pronounced and La, Y, and Zr were only affected to a small degree.
The lowest sensitivity factors were obtained in 1,1,2-trichloro-1,2,2-trifloro-ethane. In comparison to tetrachloroethane the presence of fluorine in the molecule suggests a more efficient release of metals from the oven. This finding is also consistent with the improved metal release observed in electro-thermal vaporization ovens in the presence of Freon.32 It is worth noting that the formed HF caused significantly increased Si background resulting in spectral interference of the Ni 221.648 nm emission line. Up to now no visible degeneration of the combustion tube was observed.
ICP operation at reduced RF power
The introduction of organic solvent aerosols into the ICP almost always requires elevated RF generator power levels to avoid the extinction of the plasma. Often the highest available generator power level is selected placing significant electrical and thermal stress on the components of the power oscillator and the accompanying power supply. This gives rise to higher wear of these costly components and consequently it is desirable to operate the ICP well below the RF generator upper power limit while still being able to analyze even highly volatile samples.A typical power level for aqueous samples analyzed on the used ICP-OES is 1400 W. At this level the outer gas flow can be reduced to 12 L min−1. All other conditions are the same as stated in Table 2.
A 10 mg kg−1 solution of Ag, Ba, Cd, Cr, Fe, La, Li, Mg, Ni, Pb, Y, Zn and Zr in dichloromethane and a dichloromethane blank were analyzed at 1650 W and at 1400 W. In order to distinguish between effects caused by the aerosol treatment (combustion, CO2 and O2 removal) and non-spectroscopic interferences in the plasma, an aqueous standard containing 10 mg kg−1 of all analytes was nebulized without the combustion oven and the membrane desolvator installed. Signals of the aqueous standard were also acquired at both power levels.
The effect of the reduced RF generator power for dichloromethane and water as solvents is shown in Fig. 10. The signals obtained at 1650 W were divided by the signals recorded at 1400 W for each investigated emission line. Those quotients represent signal suppression factors for the comparison of the two power levels.
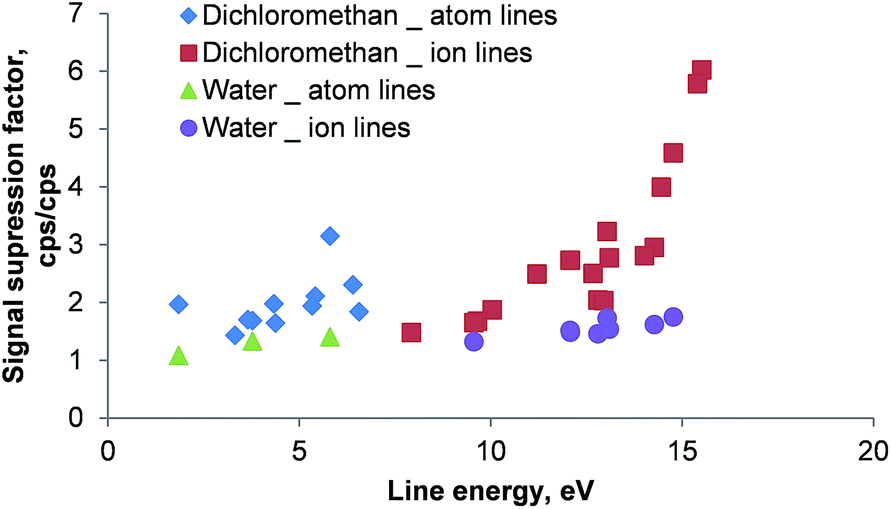 | ||
| Fig. 10 Signal suppression caused by the reduction of RF power from 1650 W to 1400 W for emission lines of Ag, Ba, Cd, Cr, Fe, La, Li, Mg, Ni, Pb, Y, Zn and Zr in dichloromethane and water as solvents. The signal suppression factor was calculated by dividing the respective signal obtained at 1650 W by the signal recorded at 1400 W. Aqueous solutions were analyzed without combustion oven and membrane desolvator installed in the aerosol path. Moreover, no oxygen was admixed to the aqueous aerosol. Line energies are taken from ref. 27; error bars are not plotted for clarity – RSDs were between 3 and 5% for all investigated lines. | ||
As shown in Fig. 10 a reduction of the RF power resulted in a signal suppression of all investigated emission lines when using dichloromethane. Whereas for atom lines the suppression factor was about 2, ion lines showed a clear increase of the suppression factor with increasing total line energy (ionization potential + excitation potential): for Ba(II) 455.404 nm (7.93 eV total line energy) a suppression factor of 1.5 was recorded, whereas for the Zn(II) 202.548 nm (15.51 eV total line energy) emission line a factor of 6 was determined. This behavior can be attributed to non-spectroscopic interference in the ICP caused by the presence of molecular gases (remaining oxygen and carbon dioxide). It is well known that this matrix effect influences ion lines more than atom lines33 and the magnitude does correlate with the line energy. The comparatively low suppression factors encountered for aqueous solutions (30–60% for the ion lines) further support this theory.
Conclusions
The proposed sample combustion and carbon dioxide removal approach can be used to quantitatively determine trace metal levels in highly volatile solvents. The removal of most of the carbon from the aerosol prior the introduction into the ICP enables stable plasma operation independent of the introduced solvent.Even though ICP stability is assured by employing the proposed approach, the application to specific samples can be expected to offer several possibilities of optimization: compared to the introduction of aqueous samples the analytical performance is degraded, mainly due to the presence of about 1% oxygen in the gas stream and analyte-specific losses in the combustion and desolvation system. It seems reasonable to expect further improvements in the analytical performance by using a combustion tube without glass frit and by optimizing the oxygen removal in the membrane desolvator by either using a second desolvator in series or by employing different membrane types. Another problematic issue is the instability of the peristaltic pump tubes towards various organic solvents. This problem could be overcome by using sequential injection flow injection analysis34 equipment.
In the presented form the sample combustion and carbon dioxide removal system poses several distinctive advantages over other approaches reported in the literature. The optimization of the ICP is not constrained by the volatility of the sample but rather by the remaining amount of oxygen in the carrier gas stream. There is no clogging of the desolvator's membrane by sample constituents or extraction additives which can be encountered when the solvent is not combusted. Within the safe operating constraints of the combustion oven, the sensitivity can be enhanced by increasing the amount of sample introduced into the oven. Moreover, species-dependent differences in the analyte volatility will not affect the analyte response, as the sample is combusted.
Acknowledgements
The authors wish to thank Analytik Jena and particularly Birgit Wittenburg for generous loan of the combustion oven and helpful discussion.References
- G. Kreuning and F. J. M. J. Maessen, Spectrochim. Acta, Part B, 1987, 42, 677–688 CrossRef.
- B. L. Sharp, J. Anal. At. Spectrom., 1988, 3, 613–652 RSC.
- D. G. Weir and M. W. Blades, J. Anal. At. Spectrom., 1994, 9, 1311–1322 RSC.
- A. W. Boorn and R. F. Browner, Anal. Chem., 1982, 54, 1402–1410 CrossRef CAS.
- F. J. Maessen, G. Kreuning and J. Balke, Spectrochim. Acta, Part B, 1986, 41, 3–25 CrossRef.
- F. R. Abou-Shakra, M. P. Rayman, N. I. Ward, V. Hotton and G. Bastian, J. Anal. At. Spectrom., 1997, 12, 429–433 RSC.
- G. Grindlay, L. Gras, J. Mora and M. T. C. de Loos-Vollebregt, Spectrochim. Acta, Part B, 2008, 63, 234–243 CrossRef PubMed.
- Z. Hu, S. Hu, S. Gao, Y. Liu and S. Lin, Spectrochim. Acta, Part B, 2004, 59, 1463–1470 CrossRef PubMed.
- J. Machát, V. Otruba and V. Kanický, J. Anal. At. Spectrom., 2002, 17, 1096–1102 RSC.
- I. Rodushkin, P. Nordlund, E. Engström and D. C. Baxter, J. Anal. At. Spectrom., 2005, 20, 1250–1255 RSC.
- S. Greenfield and P. B. Smith, Anal. Chim. Acta, 1972, 59, 341–348 CrossRef CAS.
- S. Greenfield, H. M. McGeachin and P. B. Smith, Anal. Chim. Acta, 1976, 84, 67–78 CrossRef CAS.
- L. Ebdon, E. H. Evans and N. W. Barnett, J. Anal. At. Spectrom., 1989, 4, 505–508 RSC.
- S. J. Hill, J. Hartley and L. Ebdon, J. Anal. At. Spectrom., 1992, 7, 23–28 RSC.
- L. C. Alves, M. G. Minnich, D. R. Wiederin and R. S. Houk, J. Anal. At. Spectrom., 1994, 9, 399–403 RSC.
- K. Bäckström, A. Gustavsson and P. Hietala, Spectrochim. Acta, Part B, 1989, 44, 1041–1048 CrossRef.
- R. I. Botto and J. J. Zhu, J. Anal. At. Spectrom., 1994, 9, 905–912 RSC.
- A. Gustavsson, Spectrochim. Acta, Part B, 1988, 43, 917–922 CrossRef.
- D. R. Wiederin, R. S. Houk, R. K. Winge and A. P. D'Silva, Anal. Chem., 1990, 62, 1155–1160 CrossRef CAS.
- F. J. Maessen, P. J. H. Seeverens and G. Kreuning, Spectrochim. Acta, Part B, 1984, 39, 1171–1180 CrossRef.
- G. Kreuning and F. J. M. J. Maessen, Spectrochim. Acta, Part B, 1989, 44, 367–384 CrossRef.
- J. Mora, V. Hernandis and A. Canals, J. Anal. At. Spectrom., 1991, 6, 573–579 RSC.
- J. Mora, S. Maestre, V. Hernandis and J. L. Todolí, Trends Anal. Chem., 2003, 22, 123–132 CrossRef CAS.
- N. N. Sesi, A. MacKenzie, K. E. Shanks, P. Yang and G. M. Hieftje, Spectrochim. Acta, Part B, 1994, 49, 1259–1282 CrossRef.
- D. Hausler, Spectrochim. Acta, Part B, 1987, 42, 63–73 CrossRef.
- K. Kahen, A. Strubinger, J. R. Chirinos and A. Montaser, Spectrochim. Acta, Part B, 2003, 58, 397–413 CrossRef.
- A. N. Zaidel, V. K. Prokofev, S. M. Raiskii, V. A. Slavnyi and E. Y. Shreider, Tables of spectral lines, Plenum Press, London, 1970 Search PubMed.
- J. M. Mermet, Anal. Chim. Acta, 1991, 250, 85–94 CrossRef CAS.
- A. F. Holleman, N. Wiberg and E. Wiberg, Lehrbuch der Anorganischen Chemie, Walter de Gruyter, Berlin, New York, 2007 Search PubMed.
- V. M. Goldfarb and H. V. Goldfarb, Spectrochim. Acta, Part B, 1985, 40, 177–194 CrossRef.
- Reaxys Database (Beilstein, Gmelin), Reed Elsevier Properties SA, 2013.
- C. J. Park and G. E. M. Hall, J. Anal. At. Spectrom., 1987, 2, 473–480 RSC.
- J. L. Todolí, L. Gras, V. Hernandis and J. Mora, J. Anal. At. Spectrom., 2002, 17, 142–169 RSC.
- J. Ruzicka and G. D. Marshall, Anal. Chim. Acta, 1990, 237, 329–343 CrossRef CAS.
| This journal is © The Royal Society of Chemistry 2014 |