 Open Access Article
 This Open Access Article is licensed under a
 Creative Commons Attribution 3.0 Unported Licence
Elemental and isotopic analysis of americium in non-separated spent fuels using high resolution ICP-OES and sector field ICP-MS
Michael
Krachler
*,
Rafael
Alvarez-Sarandes
and
Stefaan
Van Winckel
European Commission – Joint Research Centre, Institute for Transuranium Elements, ITU, P.O. Box 2340, D-76125 Karlsruhe, Germany. E-mail: michael.krachler@ec.europa.eu; Web: http://itu.jrc.ec.europa.eu Fax: +49 7247 951 588; Tel: +49 7247 951 884
First published on 13th March 2014
Abstract
As there are no matrix-matched certified reference materials, accurate and straightforward analytical procedures for the determination of americium (Am) in non-separated spent fuels employing high resolution ICP-OES and sector field (SF-) ICP-MS were developed and cross-validated. One spent (Th,Pu)O2 fuel and two U/Pu-based spent fuels representing different chemical and isotopic compositions were analysed for their Am content. Even though the lowest limit of detection (0.07 μg kg−1) was obtained at λ = 283.226 nm, the ICP-OES signal at λ = 408.929 nm provided the most accurate results for the analysis of the spent fuel among the six investigated Am emission wavelengths. Massive spectral interference from Th precluded the use of the λ = 283.226 nm emission line for Am analysis of the (Th,Pu)O2 fuel, while other potential interferences from plutonium (Pu) and neptunium (Np) could be excluded for all the tested Am wavelengths. Employing ICP-OES, both external calibration and standard addition yielded comparable Am amount concentrations. Calibration of the SF-ICP-MS response for Am was accomplished using both 232Th and 238U signals as well as applying the related mass bias. This calibration methodology that is frequently used in the absence of an Am stock standard solution was tested against a home-made 241Am stock standard solution underlining the validity of this calibration approach. Sector field ICP-MS analysis essentially confirmed the Am concentrations obtained using ICP-OES in the three spent fuel solutions with mean values overlapping within their standard deviations. Considering isotopes of other actinides such as Pu and curium (Cm), the Am isotopic abundance (241Am, 242Am, 243Am) was established in two non-separated fuel solutions comparing well with model calculations based on the ORIGEN-2 code.
Introduction
The use of mixed oxide (MOX) nuclear fuels such as thoria-based (Th,Pu)O2 fuels or U/Pu fuels in light water reactors produces sizeable amounts of the artificial element americium (Am). While the Am isotopes 241Am (t1/2 = 432.2 years) and 243Am (t1/2 = 7370 years) are predominantly produced through β-decay of Pu, minor amounts of 242Am (t1/2 = 37![[thin space (1/6-em)]](https://www.rsc.org/images/entities/char_2009.gif) 420 years) are also generated.1 Therefore, the analysis of Am is included in the characterisation of spent nuclear fuels.
420 years) are also generated.1 Therefore, the analysis of Am is included in the characterisation of spent nuclear fuels.
From an analytical perspective, α- and γ-spectrometry as well as ICP-OES and ICP-MS are employed frequently for this purpose. Among the four analytical techniques mentioned above, ICP-OES is the least used, even though suitable Am emission wavelengths that provide selectivity and sufficient sensitivity have been identified.2–5
One of the commonly raised concerns associated with the analysis of radioactive samples is related to the quality assurance of such an analysis due to the lack of suitable certified reference materials. Matrix-matched reference materials are commonly available for conventional, i.e., non-radioactive elemental and isotopic analyses. Despite the recognised need for additional radio-analytical certified reference materials,6 these quality control standards are frequently not accessible when an irradiated material is to be analysed. This aspect becomes even more complicated by the fact that isotopically pure, certified stock standard solutions of actinides are often not available and/or quite costly. Similarly, the transport of radioactive samples to another laboratory for complementary analysis is largely limited due to security and safety issues as well as the expenses for such an endeavour.
In the light of the above mentioned constraints it is highly desirable to develop techniques for complementary analysis on the spot where the irradiated sample is handled for supplementary scientific investigations.7,8 At JRC-ITU, sector field ICP-MS (SF-ICP-MS) is employed routinely for Am analysis of irradiated samples. Because most spent nuclear fuels contain also considerable amounts of Pu (Table 1), however, the reliability of the ICP-MS 241Am data is hampered by the presence of 241Pu in the analyte solution and is only possible after a chemical separation of both elements from each other. While even SF-ICP-MS cannot distinguish between Am and Pu at m/z 241 in the mass spectrum, ICP-OES can, because both the elements emit light at different wavelengths. Moreover, none of the sensitive Am emission wavelengths is overlapped by any Pu signal, thus providing the potential for the direct determination of Am in the spent nuclear fuel.5 Hence ICP-MS and ICP-OES, employing diverse physical detection principles, complement each other and thereby help to improve the quality of Am analysis in a nuclear fuel.7,8
| Spent fuel | U, mass% | Pu, mass% | Th, mass% |
|---|---|---|---|
| a Not determined, but <0.1%. b Note that the mass fractions of U, Pu, and Th represent ∼76.5 to 85.5% of the total inventory only. The two metallic fuels additionally contain ∼9% Zr, ∼3–4% lanthanides, ∼1.8–3.6% minor actinides and ∼1% Mo (see text for details). The major residual contributor to the (Th,Pu)O2 fuel inventory is oxygen amounting to ∼12%. | |||
| MET 1–4 | 63.9 | 19.5 | —a |
| MET 1–7 | 61.4 | 15.1 | —a |
| (Th,Pu)O2 | 1.69 | 0.56 | 83.2 |
Building on our previous experience,5 the current comparative study aims to investigate the potential and pitfalls of both ICP-OES and ICP-MS for the direct Am analysis of the “non-separated” spent fuel. Various experimental approaches including the application of external calibration against a home-made 241Am (via separation of 241Am from a concentrated Pu solution) or a commercial 238U standard, as well as standard addition have been investigated to establish the Am concentration in three selected nuclear fuels. Moreover, the isotopic composition of Am (241Am, 242Am, and 243Am) has been determined using SF-ICP-MS with the obtained experimental results compared to predictive model calculations.
Experimental
Instrumentation
The sample introduction system of the ICP-OES and SF-ICP-MS instruments has been installed in a glove box to allow the analysis of radioactive samples. This complex modification of the original instrumental design was necessary to protect the analyst from α and β radiation originating from the radioactive sample solutions.All ICP-OES measurements were carried out with a nuclearised high resolution ICP-OES instrument (Ultima2, HORIBA Jobin Yvon, Longjumeau, France). The sample introduction system consisted of a PolyPro ST nebulizer (Elemental Scientific (ESI), Inc., Omaha, NE, USA), pumped at a sample uptake rate of ∼0.3 mL min−1, that was attached to a high efficiency sample introduction system (Apex E, ESI). Measurements were recorded either at the maximum of the individual Am emission signals (Max mode) for eight seconds or by using nine measurement points (1s each) centred around the peak maximum (Gauss mode). For the latter option, the ICP-OES software calculates a Gaussian function using the nine acquired data points. To obtain net peak intensities, the spectral background around the vicinity of each Am signal was monitored for four seconds and subsequently subtracted from the Am signals.
Sector field ICP-MS measurements were carried out with a nuclearised Element2 instrument (Thermo Scientific, Bremen, Germany). The sample introduction system consisted of a self-aspirating micro-flow PFA-100 nebulizer (ESI) and a cyclonic spray-chamber (Glass Expansion, West Melbourne Vic, Australia). The RF generator was operated at 1250 W and the Ar gas flows were set to 16 L min−1 for the plasma gas, 0.9 L min−1 for the auxiliary gas and 0.9–1.1 L min−1 for the sample gas (daily optimised), respectively.
The ICP-MS Am measurements were part of overview analyses of dissolved nuclear fuel samples. The employed analytical method covered the main mass ranges for transition metals (m/z 50–67), fission products (m/z 85–165) and actinides (m/z 232–248) in the low resolution (LR) mode followed by measurements of the transition metals and actinides in the medium resolution (MR) mode for identifying potential spectral interferents across these mass ranges. For each analysis, the peak areas of seven spectra were averaged and each blank/standard/sample was measured three times consecutively. For quantification, external calibrations were performed before and repeated after the blank/sample measurements.
Reagents and samples
Because of their radioactive nature, all Am standard solutions as well as nuclear fuel samples had to be handled in glove boxes and chemical hot cells, respectively. For the preparation of all the solutions high purity water (18.2 MΩ cm) from a MilliQ (Millipore) water purification system and sub-boiled nitric acid were used. The employed 241Am stock solution was obtained from a Pu stock solution (115 g L−1) in which 241Am was “produced” from the decay of 241Pu.5 Before use, 241Am present in this stock solution was separated from 241Pu via a combination of liquid extraction and extraction chromatography.5 Subsequently, the Am concentration (1550 mg kg−1) and isotopic purity of this stock standard solution were assessed using both α- and γ-spectrometry.9External calibration solutions for ICP-OES were prepared in 0.14 M nitric acid and consisted of 0, 2, 5, 10, 20, 50, and 100 μg kg−1 of 241Am. For standard addition experiments, the dissolved spent fuel samples were spiked gravimetrically at three concentration levels yielding 241Am additions of nominal 10, 20 and 30 μg kg−1 in the actual measurement solutions.
External calibration was also applied for the SF-ICP-MS overview analyses, by measuring mixed elemental standard solutions (Multi-element Calibration Standard solutions from PerkinElmer Environmental Health, Shelton, Connecticut, USA) containing 68 elements in total covering the mass range of interest. Each calibration series consisted of a standard blank solution and five calibration standards at elemental concentrations of respectively 0.2, 0.6, 1, 5 and 20 μg kg−1 in 1 M HNO3. “Internal standards” (1 μg kg−1 of each Co, In, Ho and Th) were added to all the calibration solutions and the samples in order to follow (and correct for) the drift in instrumental sensitivity during the measurement sequence.
Spent fuel samples
A two mm slice of an irradiated (Th,Pu)O2 fuel rod was dissolved by boiling under reflux in a so-called “Thorex solution” containing Al(NO3)3·9H2O, NaF and 14.4 M HNO3 in a chemical hot-cell at JRC-ITU using telemanipulators. The Am content of this dissolved (Th,Pu)O2 fuel sample has been determined previously in the framework of the LWR-Deputy Project.10 Gamma emissions from the decay of 241Am were measured employing γ-spectrometry without any chemical separation of the actinide from the spent fuel matrix. The detector of the γ-spectrometer was calibrated using a mixed radionuclide γ-standard. The 241Am result obtained from γ-spectrometry was combined with the 241Am/243Am ratio as measured using SF-ICP-MS in a separated fraction of the investigated fuel sample to obtain the concentration of 243Am. The 242Am contents in this sample were below the detection limit of SF-ICP-MS. The dissolved fuel solution was further diluted ∼200-times with 0.14 M nitric acid for subsequent ICP-OES analysis.Similarly, two spent metallic fuels (MET 1–4 and MET 1–7) with different elemental compositions (Table 1) have been dissolved and investigated for Am. Both experimental research fuels have been doped with rare earth elements (REE) and minor actinides (MA, amongst which is Am) in order to study the impact of irradiation on these elements within the METAPHIX-1 Project.11 Sample MET 1–4 was doped with 2% REE and 2% MA, sample MET 1–7 with 5% REE and 5% MA.11 The dissolution of the fuel samples was carried out by boiling under reflux in a mixture of 3 M HNO3 and 0.2 M HF in a chemical hot-cell at JRC-ITU. From these dissolved fuel solutions, further dilutions have been prepared with 0.14 M HNO3 and 1 M HNO3 for ICP-OES and SF-ICP-MS analyses, respectively. The final dilution factors ranged from ∼500 to ∼1700 for ICP-OES analyses depending on the actual Am concentration, and amounted to ∼9000 for measurements employing SF-ICP-MS. As all sample dilutions were performed on a weight basis using a calibrated balance, the impact of the various dilution steps on the accuracy of the results is expected to be negligible.
Results and discussion
Selection of data acquisition parameters for ICP-OES
Based on our recent investigation on the performance of ICP-OES measurement techniques for Am,5 the following six most promising Am emission wavelengths, namely λ = 283.226 nm, λ = 292.059 nm, λ = 392.625 nm, λ = 408.929 nm, λ = 450.945 nm, and λ = 469.970 nm, were considered for the current study. The absence of significant spectral interferences and/or low Am detection limits (LOD) was the main reason for choosing these Am emission wavelengths for further in-depth inspections for quantification of Am in the spent fuel.5At λ = 283.226 nm for example, a LOD for Am as low as 0.07 μg kg−1 has been reported recently for aqueous standard solutions.5 Because this most sensitive Am emission line might be potentially compromised by interference from U and Th, its potential for spent fuel analysis remains to be proven.4,5 Other emission wavelengths, even though slightly less sensitive, still provide Am LODs at sub-μg kg−1 or low μg kg−1 concentration levels.5
The splitting of a single emission line into several lines, each of which corresponds to an individual isotope of this particular element, is referred to as isotopic shift. Similar to other heavy elements such as Pu and U,12–16 ICP-OES measurements of Am are also affected by this phenomenon.5 In this context it is important to point out here that usually ICP-OES measurements are carried out at the peak top only (just like ICP-MS measurements) to achieve the best possible counting statistics within a given data acquisition time. As the Am inventory of spent nuclear fuel samples consists of mainly 241Am and 243Am – besides minor contributions from 242Am – in different proportions, the position of the actual Am ICP-OES signal might be shifted slightly in the wavelength spectrum compared to a mono-isotopic Am standard solution that might have been used for wavelength calibration. While the isotopic shift is <4 pm at most for 241Am and 243Am,5 this small difference in the wavelength position of the peak top of different Am isotopes may still lead to inaccurate results when considering the calibrated wavelength position of the 241Am emission signal. In other words, while employing the so-called “Max measurement mode”, the actual peak top may be missed by 1 or 2 pm, leading to deteriorated results. Unlike the substantial distance between individual U isotopes in the emission spectrum,13–15 the minor pronounced isotopic shift of Am, however, does not allow for a direct isotopic analysis of Am using ICP-OES.5
To investigate the potential negative impact of the Max mode on the accuracy of the actual results, all ICP-OES measurements have been also carried out concurrently using the Gauss mode. The idea behind this experimental approach is that acquiring several measurement points in small increments (0.5–2 pm, depending on the peak width of the ICP-OES signal) around the theoretical peak position of the mono-isotopic 241Am calibration standard followed by calculating a Gauss function using these experimental data will compensate for the slight shift in the position of the Am ICP-OES signal obtained from an actual fuel sample that contains both 241Am and 243Am.
ICP-OES analysis of Am in spent nuclear fuels
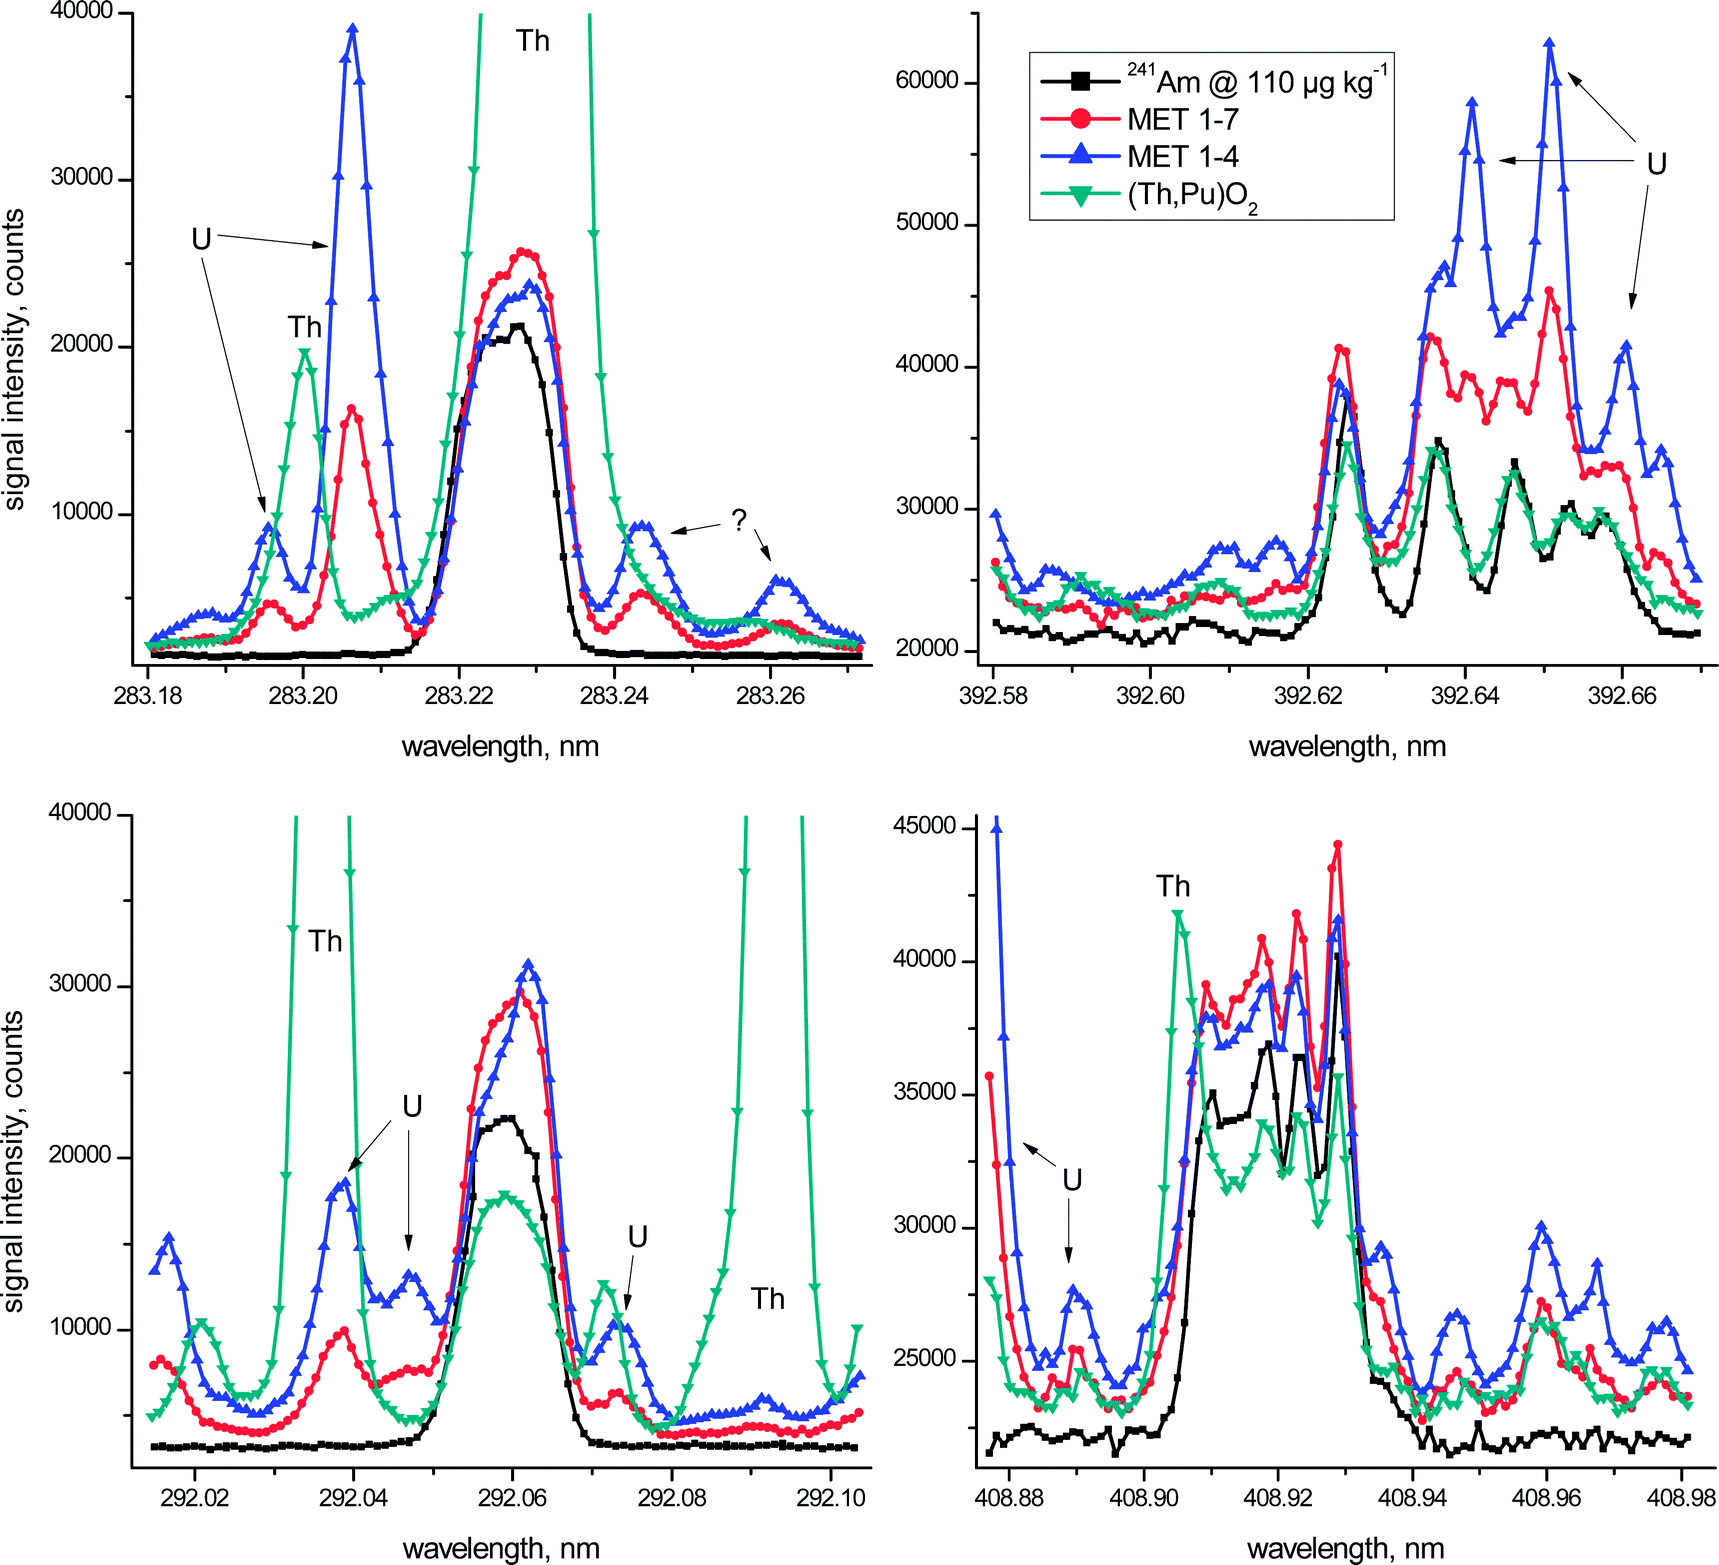 | ||
| Fig. 1 High resolution ICP-OES spectra of the two spent metallic U/Pu fuels, one (Th,Pu)O2 fuel and a 110 μg kg−1 241Am standard solution for comparison. Each of the 101 measurement points was recorded for one second using spectral increments of 0.5 pm. The displayed graphs centred at λ = 283.226 nm, λ = 292.059 nm, λ = 392.625 nm, and λ = 408.929 nm represent a spectral window of 100 pm highlighting both the Am signals and spectral interference evident for the investigated fuel samples. | ||
The above mentioned key aspects are highlighted graphically in more detail in Fig. 1 for the four most promising wavelength regions of Am. In this figure the emission spectrum of a 110 μg kg−1 241Am standard solution (black squares) is superimposed on the spectra of the three investigated spent fuels at all four different wavelength regions. One should take into account, however, that Th-based fuels still remain a minority with the vast majority of nuclear fuels employed currently being based on U/Pu oxides. In other words, the obvious analytical difficulties due to the presence of excessive amounts of Th in one of the investigated fuels during ICP-OES Am analysis are more an exception than the rule. Taken together, however, the irradiated fuel samples considered in this study represent a distinct variety of potential spent fuel compositions.
Even though the metallic fuel solutions MET 1–4 and MET 1–7 have similar U and Pu concentrations (Table 1), one must consider that the latter was almost 4-times more diluted for ICP-OES analysis when comparing visually the spectra presented in Fig. 1. As regards non-identified peaks in these emission spectra, apparent spectral interferences from neptunium (Np), another transuranium element mainly present as 237Np at comparable concentrations in the spent fuel, were excluded experimentally (data not shown).
In the wavelength region centred around λ = 283.226 nm massive Th interference at λ = 283.231 nm overlaps entirely with the Am signal and, as such, excludes the use of this emission line for Am analysis of Th-based fuels. This essential fact was addressed only partly in earlier studies.2–4 But also in the case of the two investigated metallic U/Pu fuels (Table 1), the obvious presence of a substantial U signal at λ = 283.206 nm, even though as much as 20 pm off to the left of the Am peak maximum, may slightly increase the calculated Am concentration (Fig. 1). It is only due to the high resolution capabilities of the employed ICP-OES instrument, providing a spectral resolution of <5 pm in this wavelength region, which allows the consideration of this Am emission line for quantification, even in the presence of large amounts of U. The origin of the two minor peaks in both MET spectra on the right hand side of the Am signal is unclear at the moment. While a Fe signal at λ = 283.244 nm is suggested by the ICP-OES software for one of these peaks, note that Fe is present in both MET fuels in almost identical concentrations and the corresponding spectra do not support these peaks as originating from Fe. Additional experimental investigations also excluded Pu – another major constituent of the MET fuels (Table 1) – as a potential candidate for the occurrence of these two peaks.
Similarly, spectral interference from both Th (in the case of the Th-based fuel) and U (for both MET fuels) hampers the reliable determination of Am at λ = 292.059 nm (Fig. 1). While the peaks centred around λ = 292.073 nm were identified as U signals, the origin of the nearby peak at λ = 292.071 nm related to the (Th,Pu)O2 fuel is not evident at present.
The Am spectra in the vicinity of both λ = 392.625 nm and λ = 408.929 nm are characterised by multiplets consisting of five noticeable peaks each.5 The main difference between these two Am wavelength regions is the fact that the highest peak is positioned either at the outermost left (λ = 392.625 nm) or the outermost right side (λ = 408.929 nm) of the corresponding Am multiplet (Fig. 1). Even though certain distinct spectral overlaps from U (λ = 392.625 nm) and Th (λ = 408.929 nm) are evident in the emission spectra of the fuel samples, the major signal of each of the multiplets appears largely unaffected by this spectral interference (Fig. 1). Therefore only these highest Am peaks were examined further in more detail for quantification purposes.
| Spent fuel | MET 1–4 | MET 1–7 | (Th,Pu)O2 | |||
|---|---|---|---|---|---|---|
| Max | Gauss | Max | Gauss | Max | Gauss | |
| a Not determined due to massive spectral interference from Th. Please see text for details. | ||||||
| 283.226 nm | ||||||
| Ext. calib. | 11.7 ± 0.4 | 12.0 ± 0.2 | 13.4 ± 0.5 | 13.6 ± 0.2 | —a | —a |
| Std. add. | 11.5 ± 0.1 | 11.8 ± 0.6 | 12.9 ± 0.7 | 12.9 ± 0.5 | —a | —a |
| 292.059 nm | ||||||
| Ext. calib. | 13.6 ± 0.7 | 14.2 ± 0.7 | 14.6 ± 0.6 | 15.1 ± 0.7 | 8.0 ± 0.7 | 7.9 ± 0.3 |
| Std. add. | 13.4 ± 0.6 | 13.8 ± 0.4 | 13.6 ± 0.4 | 13.6 ± 0.8 | 7.3 ± 0.3 | 6.7 ± 0.1 |
| 392.625 nm | ||||||
| Ext. calib. | 9.9 ± 0.5 | 10.0 ± 0.5 | 11.4 ± 0.5 | 12.3 ± 0.7 | 7.5 ± 0.6 | 7.1 ± 0.8 |
| Std. add. | 10.0 ± 0.5 | 10.4 ± 1.1 | 11.0 ± 1.4 | 13.0 ± 0.5 | 7.7 ± 0.9 | 7.8 ± 0.2 |
| 408.929 nm | ||||||
| Ext. calib. | 11.6 ± 0.3 | 12.2 ± 0.9 | 13.3 ± 0.4 | 13.8 ± 0.6 | 8.2 ± 0.7 | 8.2 ± 0.9 |
| Std. add. | 11.5 ± 0.3 | 11.4 ± 0.7 | 12.8 ± 0.4 | 13.1 ± 0.8 | 8.3 ± 0.6 | 8.4 ± 1.2 |
| 450.945 nm | ||||||
| Ext. calib. | 12.2 ± 0.2 | 11.4 ± 3.6 | 12.4 ± 1.7 | 14.2 ± 1.9 | 10.6 ± 2.5 | 11.8 ± 1.6 |
| Std. add. | 11.8 ± 0.7 | 16.8 ± 4.0 | 14.2 ± 2.5 | 18.5 ± 1.9 | 12.6 ± 2.8 | 16.5 ± 2.8 |
| 469.970 nm | ||||||
| Ext. calib. | 12.1 ± 1.0 | 9.4 ± 2.5 | 12.5 ± 2.8 | 16.2 ± 2.6 | 30.7 ± 0.5 | 39.4 ± 7.9 |
| Std. add. | 13.9 ± 3.5 | 20.8 ± 18.4 | 13.9 ± 3.2 | 22.9 ± 11.4 | 32.9 ± 1.9 | 54.9 ± 16.6 |
Besides the four emission wavelengths considered in Fig. 1, two additional Am wavelengths, namely λ = 450.945 nm and λ = 469.970 nm, were included in this assessment. While these two additional Am emission lines might provide a reasonable opportunity for Am analysis,5 they, however, did not provide sufficiently low detection limits to be fully exploited in the current study. This fact is reflected by the generally poorer analytical performance obtained at these two Am emission lines resulting in increased standard deviations of their respective mean values (Table 2). To avoid an unnecessarily high radiation dose originating from the radioactive fuel samples reaching the operator of the ICP-OES, more concentrated samples were not considered here. Thus, these two Am wavelengths were omitted for further in-depth inspections and are included in Table 2 for the sake of completeness only.
Standard addition experiments always consisted of the analyses of the spent fuel solution plus three aliquots that were additionally spiked with 241Am at increasing concentration levels. The corresponding linear regression lines for two of the investigated fuels are shown in Fig. 2 for the emission line centred around λ = 408.929 nm. The high correlation coefficient and almost identical slopes of the two regression lines highlight the favourable analytical performance of this experimental approach.
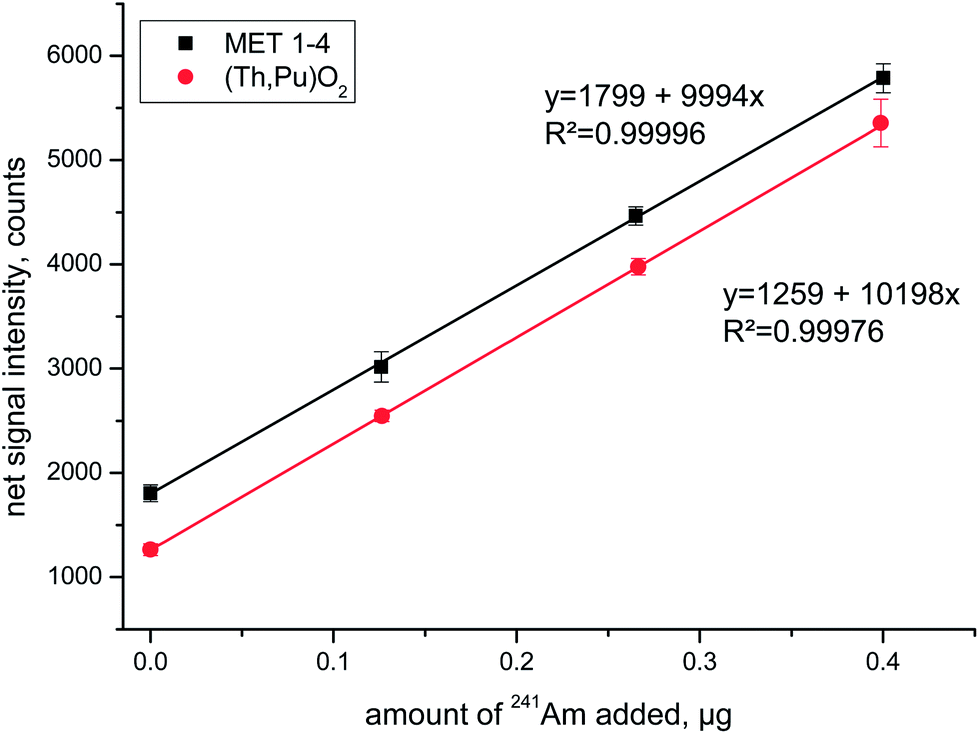 | ||
| Fig. 2 Representative linear regression curves of standard addition experiments for two selected spent fuel solutions that were spiked with 241Am at three different concentration levels. Data displayed summarize the replicate ICP-OES Am measurements at λ = 408.929 nm using the Max mode on four consecutive days. | ||
Generally speaking, there was no obvious systematic difference identifiable between the Am results obtained from the diverse quantification approaches, neither between Max mode and Gauss mode nor between external calibration and standard addition (Table 2). This satisfactory finding, that holds true for all three investigated fuels, has two important implications: first, potential matrix effects have no measurable impact on the accuracy of the Am results allowing the application of conventional external calibration for quantification purposes. Consequently, there is no need to use the standard addition calibration approach, which is distinctly more laborious and additionally increases the exposure time of the analyst to the investigated radioactive samples. Second, the impact of the Am isotopic shift is negligible for the selected wavelengths signifying that the various Am isotopic compositions of the investigated fuel samples will not measurably decrease the accuracy of the Am results when employing the Max mode. As such, the Max mode is the preferred data acquisition mode making efficient use of the measurement time by providing the best possible counting statistics.
Despite the above mentioned reasonable agreement of Am results within a single emission wavelength, systematic differences were nonetheless observed between individual wavelengths (Table 2). While the Am concentrations obtained at λ = 283.226 nm and λ = 408.929 nm were consistent, approximately 15% lower and higher results were calculated systematically from the emission signals at λ = 292.059 nm and λ = 392.625 nm, respectively (Table 2). In this context, a comparison to another analytical technique would be most advantageous to help identify the most accurate Am concentration values. Such an independent assessment of the ICP-OES accuracy employing sector field ICP-MS, based on a different physical detection principle, underlines the quality assurance of the analytical results.7,8 Consequently, without a suitable matrix-matched certified reference material, the obtained ICP-OES Am concentration values were compared to the in-house sector field ICP-MS data as described in detail below.
Sector field ICP-MS
Nevertheless, the accuracy of the calibration strategy can be improved by also taking the mass bias (instrumental mass discrimination) effects into account. As no certified isotopic reference material was measured, the correction for the mass bias was estimated based on the sensitivity difference between the internal standard 232Th and 238U (as if both nuclides were isotopes of the same actinide, An), again presuming the same elemental sensitivity for all actinides.
In addition, the different oxide formation rates of Th and U were also considered for the determination of the mass bias by also measuring m/z 248 (232ThO+) and m/z 254 (238UO+). Depending on plasma conditions, the oxide formation rate of Th and U may differ by up to an order of magnitude because of the diverse strength of their oxide bonds. This can have repercussions on the apparent sensitivity of both elements. To compensate for this deteriorating effect the calculated mass bias was based on the sensitivity difference between ‘232Th + 232ThO’ vs. ‘238U + 238UO’. While a linear, power or exponential law function was used for the assessment of the mass bias, comparable values were obtained within the measurement uncertainties realistic for overview analyses. For the results reported in this study, an exponential law function for the mass bias correction factor has been used.
After mass bias correction via the 232Th and 238U measurements (including their corresponding oxides), however, the obtained Am concentration in LR and MR confirmed each other effectively with recoveries of 105.6% and 105.4%, respectively. These results are perfectly acceptable for overview analyses along with external calibration and proved the validity of this applied methodology. The relative standard deviations for the six replicate measurements were 1.8% and 3.3% for the LR and MR results, respectively.
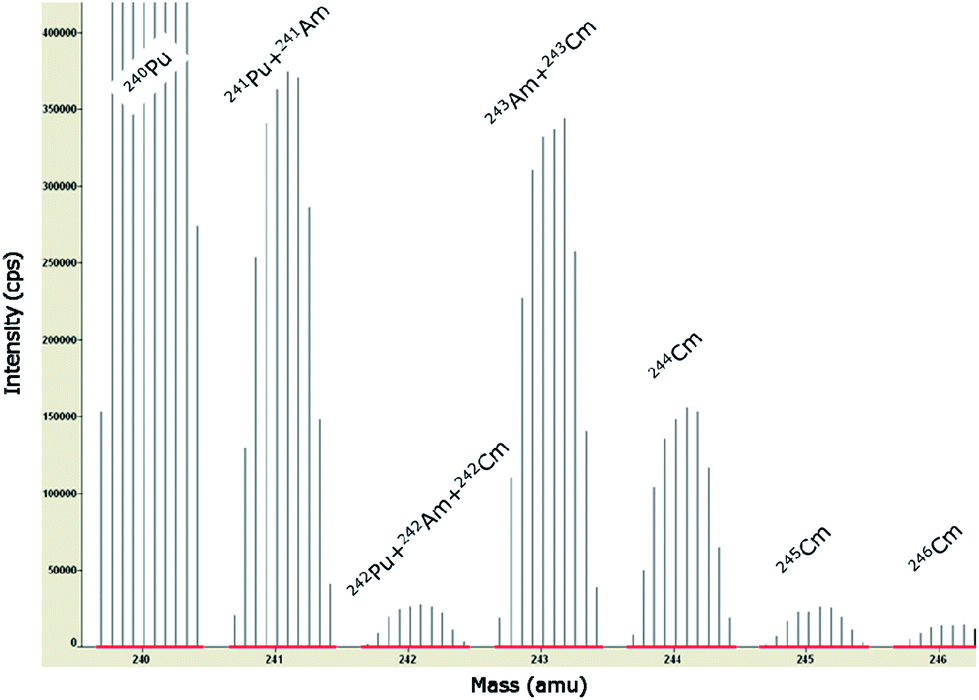 | ||
| Fig. 3 Minor actinide spectrum from m/z 240 to m/z 246 of a representative spent fuel sample (MET 1–4) as measured in an overview analysis employing SF-ICP-MS. Isobaric spectral overlaps from various Cm and Pu isotopes on the Am isotopes at m/z 241, 242, and 243 show the difficulties of extracting worthwhile information from the mass spectrum. See text for further details. | ||
To this end, knowing the initial nuclear fuel composition and the irradiation history, ORIGEN-2 calculations (a computer code system for calculating the buildup, decay, and processing of radioactive materials)17 were performed to establish the spent fuel composition after irradiation. Additional 241Pu decay calculations were performed to consider the time lapse between the end of irradiation and the day of measurement, as 241Pu decays to 241Am. Other decay corrections were not considered necessary as the half-lives of all other nuclides of concern are substantially longer. Only the relative information (e.g.241Am/241Pu or 243Am/243Cm ratio) of the ORIGEN-2 calculations was used to resolve the mass spectrum into the different nuclides.
These corrections were almost negligible for 243Am as the spectral overlap caused by 243Cm was <0.3%. For 242Am, these applied corrections were more substantial (∼40 to 60%), although they do not play a major role for the assessment of the total Am concentration as 242Am has only a minor abundance in the investigated fuel samples (Table 4). The most important correction had to be made for the 241Pu interference on 241Am. That adjustment amounted to ∼30% for sample MET 1–4 (fuel sample less doped with 0.6 wt% Am) and ∼5% for sample MET 1–7 (fuel sample doped with 1.6 wt% Am), respectively. Compared to the total Am concentration in these samples (Table 3) that correction corresponds to a value of ∼19% and ∼2.3% respectively.
| Spent fuel | ICP-MSa | ICP-OESb |
|---|---|---|
| a Results are based on external calibration with 238U, corrected for the mass bias. Refer to text for more details. b Results have been calculated applying external calibration and using the emission signal at λ = 408.929 nm. c Result of γ-spectrometry combined with SF-ICP-MS after chemical separation of Am as described in ref. 10. | ||
| (Th,Pu)O2 | 15.75 ± 0.26c | 15.1 ± 1.3 |
| MET 1–4 | 51.7 ± 2.7 | 53.9 ± 1.4 |
| MET 1–7 | 233 ± 12 | 227 ± 7 |
Excellent agreement between the measured Am isotopic composition (corrected for spectral interference) and the calculated data (ORIGEN-2) is highlighted in Table 4. One should consider, however, that both data sets are not completely independent from each other as some calculations have been used to interpret the experimental data, i.e. de-convolution of isobaric interference. But additional supporting evidence for the consistency of the actinide data is provided by the good conformity between the measured and calculated isotopic compositions of other actinides like Pu and Cm as well (data not shown). The uncertainty of the results in Table 4 is very difficult to assess as the uncertainty of the ORIGEN-2 calculations is not well defined. However, in a conservative estimate one would state a minimum of 5% (1s) for the isotopic composition data of the major isotopes 241Am and 243Am. The uncertainty of the final concentration data is estimated to be 7.5% (1s) for the major Am isotopes individually, resulting in an uncertainty on the total Am concentration of about 5.2% (1s) (see Table 3).
| Wt% | MET 1–4 | MET 1–7 | ||
|---|---|---|---|---|
| SF-ICP-MS | ORIGEN-2 | SF-ICP-MS | ORIGEN-2 | |
| 241Am | 43.1 | 44.1 | 41.6 | 40.6 |
| 242Am | 1.8 | 2.1 | 0.9 | 1.0 |
| 243Am | 55.0 | 53.8 | 57.5 | 58.4 |
As the ICP-OES Am results obtained at both λ = 283.226 nm and λ = 408.929 nm compared very well with the obtained ICP-MS data without fail, these two wavelengths were considered for an accurate quantification of Am. The only restriction concerns the use of the emission line at λ = 283.226 nm in the case of a Th-based fuel (Fig. 1 and Table 2). While the ICP-OES signal at λ = 408.929 nm provides accurate results at all times, the emission line at λ = 283.226 nm can additionally be used only in the absence of Th to confirm the λ = 408.929 nm data.
Because of this important limitation, the following comparison of ICP-MS and ICP-OES analyses is based on the ICP-OES results obtained at λ = 408.929 nm. Moreover, the isotopic shift between 241Am and 243Am of 0.86 ± 0.38 pm5 at this wavelength is especially small and close to the guaranteed mechanical reproducibility of 0.4 pm of the employed ICP-OES instrument, thereby minimizing potential deteriorating impacts related to the presence of various Am isotopes in the analyte solution.
The comparative results, summarised in Table 3, highlight the favourable agreement of the Am results obtained by both instrumental techniques. The mean Am concentration for each spent fuel assessed via ICP-OES and ICP-MS differed at most by 4% from each other with the reported standard deviations of the means always overlapping (Table 3). Considering the experimental complexities associated with these analyses, there is excellent agreement between ICP-OES and SF-ICP-MS results, underlining the accuracy of both analytical methods.
The determination of both the Am concentration and the Am isotope abundance in a non-separated fuel using SF-ICP-MS requires additional information (for example γ-spectrometry data or ORIGEN-2 calculations) to resolve isobaric spectral interferences. While the ICP-OES analysis allows for the straight-forward, accurate assessment of the Am concentration in non-separated spent fuel solutions, SF-ICP-MS has the potential to provide reliable information on both the Am concentration and the Am isotopic composition.
Acknowledgements
The support of B. Lynch for preparing the spent fuel solutions in the hot cell facilities of JRC-ITU is gratefully acknowledged. The authors are indebted to Dr H. Ohta from the Central Research Institute of Electric Power Industry (CRIEPI), Japan, for providing ORIGEN-2 data for the two investigated spent metallic fuels.References
- G. R. Choppin, J.-O. Liljenzin and J. Rydberg, Radiochemistry and Nuclear Chemistry, Butterworth-Heinemann, 3rd edn, 2002, ISBN 0–7506–7463–6 Search PubMed.
- X. Claudon, J. C. Birolleau, M. Lavergne, B. Miche and C. Bergey, Spectrochim. Acta, Part B, 1987, 42, 407–411 CrossRef.
- E. A. Huff and D. L. Bowers, Appl. Spectrosc., 1990, 44, 728–729 CrossRef CAS.
- A. Sengupta, V. C. Adya and S. V. Godbole, J. Radioanal. Nucl. Chem., 2012, 292, 1259–1264 CrossRef CAS.
- M. Krachler, R. Alvarez-Sarandes, P. Carbol, R. Malmbeck and S. Van Winckel, Microchem. J., 2013, 110, 425–434 CrossRef CAS PubMed.
- K. G. W. Inn, C. M. Johnson Jr, W. Oldham, S. Jerome, L. Tandon, T. Schaaff, R. Jones, D. Mackney, J. Griggs, P. MacKill and B. Palmer, J. Radioanal. Nucl. Chem., 2013, 296, 5–22 CrossRef CAS.
- M. Krachler, S. Van Winckel, M. Cardinale, B. Lynch and T. Murakami, Microchem. J., 2012, 105, 9–14 CrossRef CAS PubMed.
- M. Krachler, R. Alvarez-Sarandes and S. Van Winckel, J. Anal. At. Spectrom., 2013, 28, 114–120 RSC.
- P. Carbol, R. Malmbeck, M. Krachler, R. Alvarez-Sarandes, Determination of separated Am using γ-spectrometry, JRC Technical Report, JRC 76009, European Commission, 2012.
- S. Van Winckel, L. Aldave de las Heras, P. Carbol, E. Hrnecek, R. Malmbeck, P. Van Belle, E. Zuleger, J.-P. Glatz, LWR-Deputy Project: Radiochemical analysis of a high burn-up (Th, Pu)O2 sample, irradiated in KWO Obrigheim, JRC Scientific and Technical Reports, JRC-ITU-TPW-2010/03, confidential, European Commission, 2010.
- D. Papaioannou, M. Ougier, V. V. Rondinella, J.-P. Glatz, H. Ohta, Post-Irradiation Examinations (PIE) on the U-Pu-Zr Metal Alloy Fuel Rods from the METAPHIX-1 Experiment, JRC Scientific and Technical Reports, JRC-ITU-TPW-2010/04, confidential, European Commission, 2010.
- M. C. Edelson, E. L. DeKalb, R. K. Winge and V. A. Fassel, Spectrochim. Acta, Part B, 1986, 41, 475–486 CrossRef.
- P. S. Goodall and S. G. Johnson, J. Anal. At. Spectrom., 1996, 11, 57–60 RSC.
- M. Krachler and P. Carbol, J. Anal. At. Spectrom., 2011, 26, 293–299 RSC.
- M. Krachler and D. H. Wegen, J. Anal. At. Spectrom., 2012, 27, 335–339 RSC.
- G. C.-Y. Chan, X. Mao, I. Choi, A. Sarkar, O. P. Lam, D. K. Shuh and R. E. Russo, Spectrochim. Acta, Part B, 2013, 89, 40–49 CrossRef CAS PubMed.
- A. G. Croff, A User's Manual for the ORIGEN2 Computer Code, ORNL/TM-7175 July 1980.
| This journal is © The Royal Society of Chemistry 2014 |