 Open Access Article
 This Open Access Article is licensed under a Creative Commons Attribution-Non Commercial 3.0 Unported Licence
The potential for a carbon stable isotope biomarker of dietary sugar intake
A. Hope
Jahren
a,
Joshua N.
Bostic
a and
Brenda M.
Davy
b
aUniversity of Hawaii, School of Earth and Ocean Science and Technology, Honolulu, HI 96822, USA. E-mail: jahren@hawaii.edu
bVirginia Tech, Department of Human Nutrition, Foods and Exercise, Blacksburg, VA 24061, USA
First published on 10th February 2014
Abstract
Added sugar is sweetener added to foods during processing or preparation that offers no health benefits to the consumer. The mean U.S. intake of added sugar is ≈16% of total calories; at the highest level of consumption, this value exceeds 35%. In addition, 78% of added sugar typically consumed is refined from C4 plants (e.g., corn and sugar cane) and it follows that the δ13C value of these sweeteners is conspicuously high compared to carbohydrates derived from C3 plants. We first suggested in 2006 the potential for the δ13C of human tissues to indicate corn- and cane-sugar intake for use in a clinical setting. At present, self-reported dietary assessment methods are commonly used to measure added sugar intake, but are subject to underreporting, particularly for sugar-rich foods. If a carbon isotope technique could produce a quantitative indicator of dietary sugar intake, it would be invaluable to the prevention and clinical treatment of chronic diseases associated with excess sugar consumption. Research to date has focused upon testing the correlation between diet as characterized either by bulk food δ13C value or by food composition (e.g., added sugar intake quartile) and the δ13C values of human tissues. Analysis of hair, nail and red blood cells in modern humans with known diet has revealed associations between the δ13C value of bulk diet and the δ13C value of these tissues. With respect to added sugar, the δ13C values of blood serum and fingerstick blood have both been shown to be associated with added sugar intake, even after adjustment for meat intake. Researchers have attempted to isolate specific compounds in blood that are uniquely derived from dietary carbohydrates, such as direct endogenous carbohydrate sources (blood glucose) and specific non-essential amino acids (red blood cell alanine), and have seen strong correlations with added sugar intake. Recognized dietary confounders such as meat/animal products have been addressed using statistical adjustments and a dual-isotope analytical approach that invokes δ15N as a correction factor. Further controlled feeding studies and epidemiological surveys complete with Institutional Review Board approval are needed to establish the sensitivity of δ13C tissue assay as an objective biomarker for added sugar intake.
 A. Hope Jahren | A. Hope Jahren, PhD, is a Professor within the School of Ocean and Earth Science and Technology at the University of Hawaii. She conducts laboratory experiments on living plants and analyzes plant fossils, with a particular interest in the carbon stable isotope composition of plant tissues. She is a Fellow and Medalist of both the Geological Society of America (GSA) and the American Geophysical Union (AGU), and has authored more than 50 scientific publications. |
 Joshua N. Bostic | Joshua Bostic is a research technician in Hope Jahren's laboratory. He oversees the lab's nutrition program and manages sample processing, data analysis, and methods development. He received a BS in Human Nutrition, Foods and Exercise from Virginia Tech in 2012. |
 Brenda M. Davy | Brenda Davy, PhD, RD, is an Associate Professor in the Department of Human Nutrition, Foods and Exercise (HNFE) at Virginia Tech. She conducts applied and clinical nutrition research addressing the influence of lifestyle and behavioral factors on weight management and health, with a particular interest in the health effects of added sugar consumption. She is a Fellow of the American College of Sports Medicine (FACSM) and The Obesity Society (FTOS), and has authored more than 50 scientific publications. |
1. Introduction
The stable isotope carbon 13 (13C) comprises more than 1% of the carbon on Earth and its abundance varies by 10% across terrestrial substrates. Since the 1970s, off-line isotope ratio mass spectrometry (IRMS) techniques have existed for the analysis of carbon stable isotopes in organic samples.1 The coupling of continuous-flow techniques to IRMS has further facilitated high-precision measurements of C, nitrogen (N), oxygen (O), sulfur (S) and hydrogen (H) isotopes.2 Elemental analyzers allow for the flash-combustion of solid organic samples, while capillary gas and liquid chromatography interfaced to IRMS have made possible the compound-specific isotope analysis of purified organic analytes. Modern plant,3 animal4 and fungal5 tissues have been extensively characterized for carbon isotope composition, and the observed isotopic fractionations between metabolic substrates and resultant tissues have been shown to be influenced by a myriad of factors, including substrate availability,6 metabolic efficiency,7 growth rate,8 trophic position,9,10 reproductive status,11 enzymatic activity,12 energy availability,13,14 disease states,15,16 genetic mutations17 and other processes internal and external to the organism. Nonetheless, the δ13C value of a living organism is considered first and foremost to reflect the ultimate carbon source for metabolism.18,19 Under this paradigm, numerous studies have sought to characterize the isotopic composition of the diet of free-living animals, including invertebrates,20 fish,21 reptiles,22 birds,23 mammals24 and primates.25 In contrast, comparatively little work has been performed to establish the use of carbon stable isotope analysis of clinically-sampled biological tissues in order to quantify the diet of “free-living” humans. However, workers have performed extensive isotopic analyses on the remains of fossil hominids in order to reconstruct diet during ancient26–28 and historical29 times. The interpretation of carbon isotopes in human fossil material usually involves tracing the introduction of maize and/or millet into the human diet, two grains with conspicuous carbon isotope composition.30 The substrate of choice for most of these studies was bone and tooth collagen,31 bone carbonate32 and tooth enamel33 due to the enhanced chemical preservation of these substrates relative to other tissues after burial.34 The isotopic composition of mammalian diet is faithfully preserved in bone and apatite35 and may be an ideal substrate for paleodiet reconstruction, both because of resistance to diagenesis and because these tissues, once constructed, are not remobilized for metabolic processes. However, bone and tooth sampling is not an option for clinical studies of living human subjects due to its exceptional invasiveness. Researchers have opted to pursue blood, fingernail, hair and other more expendable tissues collected from living human subjects, and the interpretation of such datasets is rapidly maturing. Our particular interest is the potential for the δ13C of human tissues to indicate corn- and cane-sugar intake, as first suggested in 2006.36 The goals of this review are two-fold: first, to comprehensively describe the particular challenges unique to the role of sugar within human metabolism, and second, to summarize current nutrition research characterizing the relationship between diet and the carbon isotope composition of human tissues within clinical experiments. We note that although we rely upon statistics characterizing the “American diet,” multiple studies have shown that the recent dietary trends of many developed countries (particularly the United Kingdom and Germany) mirror those of the United States.37Carbon stable isotope technology has already been extensively applied to medical science. Artificial “spiking” of carbon-compounds with very large (typically 3000× natural abundance) amounts of 13C is commonly employed in biomedical research (reviewed in ref. 38). The advantage of natural abundance IRMS is that it does not require chemical intervention, and instead uses the compound's natural 13C-signature as a chemical tracer. This allows for a variety of compounds to be followed through the human body as the result of ingestion without requiring a priori manipulation of the compound. In addition, new continuous-flow interfaced IRMS instruments lend themselves to rapid and high-throughput analyses39 and are no more costly to purchase and operate than many analytical and diagnostic instruments found in hospital laboratories. Here we review issues relevant to the development of an isotopic technique that would employ the carbon isotope composition (δ13C value) of clinically-obtained human tissues as a quantitative indicator of dietary sugar intake. If such an application were possible, it would represent a major advance in the prevention and clinical treatment of chronic diseases associated with excess sugar consumption.
2. Sugar
Carbohydrates are the most abundant biomolecules on Earth, and the oxidation of carbohydrates is the central energy-yielding pathway in most heterotrophs. On average, carbohydrates supply about 50% of total calories in the American diet. In turn, about half of all carbohydrate intake is in the form of simple sugars: monosaccharides and disaccharides (Fig. 1).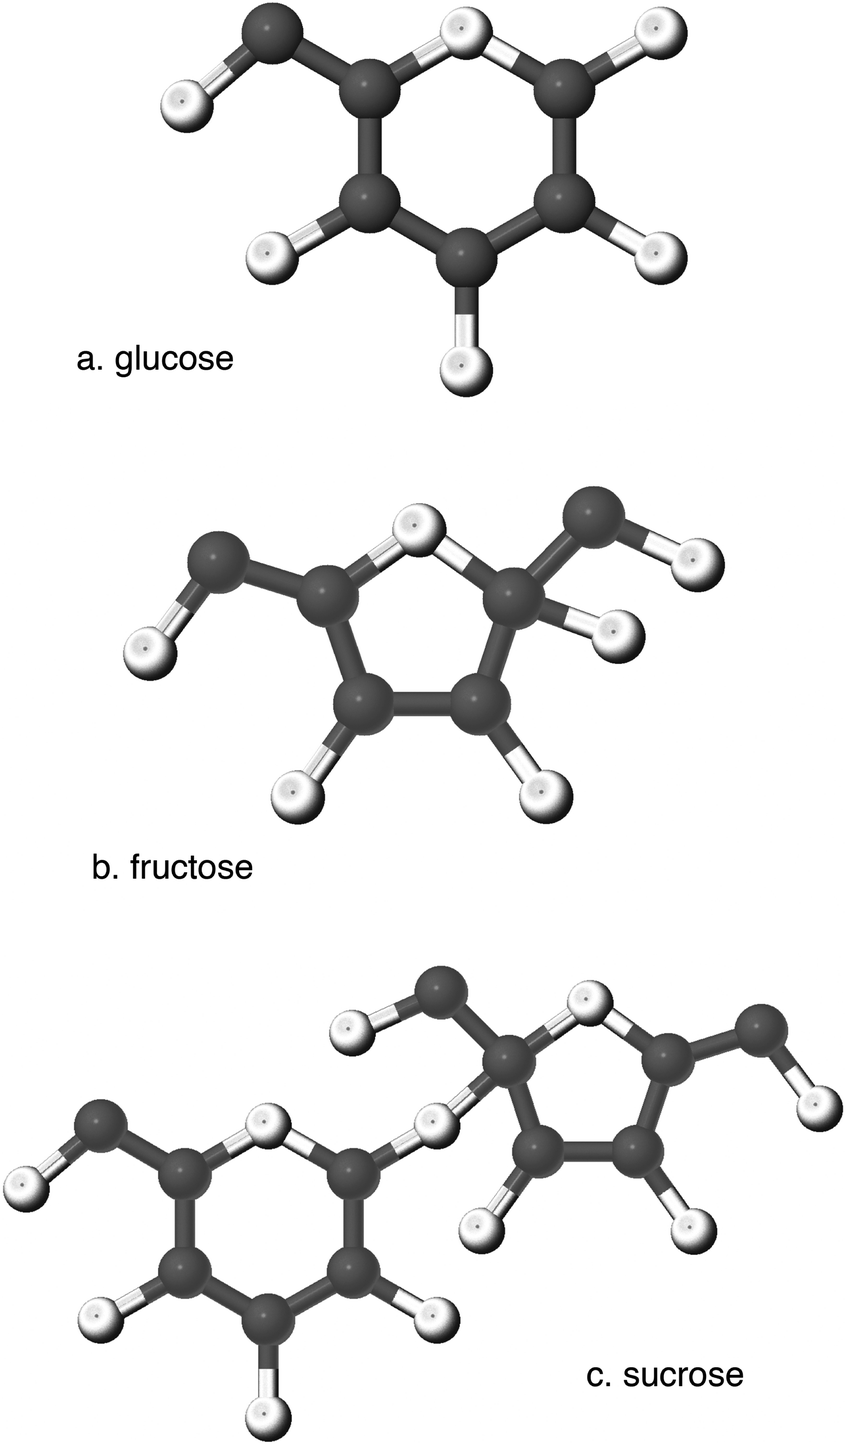 | ||
| Fig. 1 The majority of the edible sugars found in food are (a) glucose, (b) fructose and (c) sucrose. High-fructose corn syrup (HFCS) is a mix of glucose and fructose, meant to approximate the sweetness of sucrose, which is an even combination of glucose and fructose; HFCS-42 is 42% fructose and 58% glucose; HFCS-55 is 55% fructose and 45% glucose. | ||
2.1 Structure and function
Glucose (D-glucose is often referred to as “dextrose”) is the hexose monosaccharide that circulates within human blood as a ready substrate for glycolytic metabolism. The three important dietary disaccharides are maltose (two glucose units) formed from partially-hydrolyzed starch, lactose (one glucose unit and one galactose unit) found in milk, and sucrose (one glucose unit and one fructose unit). Sucrose, a major intermediate product of photosynthesis and the principal form of carbohydrate transported within plants, furnishes approximately one-third of the carbohydrates within a typical diet. The recently-engineered dietary sugar high-fructose corn syrup (HFCS)40 may be the most contentious component of the American diet. During the manufacture of HFCS, glucoamylase breaks various polysaccharides from the corn plant into simple glucose units.41 The enzyme glucose isomerase is then used to convert about half of the molecules to fructose, resulting in a compound that approximates the composition and sweetness of sucrose.42 Largely due to the advent of HFCS, fructose per se currently comprises more than one-third of all sugar in the American diet.43Almost all carbohydrates are converted to glucose, the primary source of cellular energy, during digestion and processing in the liver. Polysaccharides and disaccharides are broken down into their monosaccharide subunits during digestion, which are subsequently transported to the liver for processing. A majority of glucose, which can be used by every cell in the body, bypasses the liver and continues on to the peripheral circulation. Galactose and fructose are primarily taken up by the liver, where they are converted to glycolytic intermediates to be used in the production of glucose or fatty acid intermediates via gluconeogenesis or glycolysis, respectively. Glucose serves as the primary energy source immediately after feeding and performs many important functions in the human body that fatty acids – the slower, more sustained source of energy – cannot. The barrier separating the brain from the rest of the body is impermeable to fatty acids; therefore, glucose fuels the brain and central nervous system. Ketone bodies produced from fatty acids can serve as a substitute fuel for the brain, although their prolonged use may be detrimental.44,45 In addition, glucose can be metabolized where oxygen delivery is limited, such as within muscle during high intensity exercise, while fatty acids cannot. Finally, the addition of glucose to proteins and lipids via glycosylation is essential to the structure, function, and regulation of numerous enzymes and cell membrane components.46
2.2 Dietary intake
Despite the importance of blood glucose to survival, dietary sugars are not a necessary component of the human diet. The Institute of Medicine has established a recommended daily allowance (RDA) of 130 g per day for total carbohydrate,47 but it need not be supplied by dietary sugars. All digestible dietary carbohydrates (such as those found in fresh fruits and whole grains) can be transformed into glucose, and along with gluconeogenesis from non-carbohydrate sources, can provide all of the glucose needed for survival.48 Nonetheless, almost half of all carbohydrates consumed as part of the American diet are delivered as the simple sugars listed in Table 1.49| Sugar | Food Sources |
|---|---|
| Glucose | Fruits (esp. grapes), vegetables, corn syrup, HFCS, honey, processed meats, baked goods, sweetened beverages |
| Fructose | Fruits (esp. apples, pears), vegetables, HFCS, honey, frozen desserts, sweetened beverages |
| Galactose | Dairy products (as part of lactose; rarely found in isolation) |
| Maltose (glucose + glucose) | High maltose corn syrup, hard candy, frozen deserts, beer |
| Sucrose (fructose + glucose) | Sugarcane, vegetables (esp. sugar beets), fruits (esp. pineapple), baked goods, breads & cereals, sweetened beverages |
| Lactose (glucose + galactose) | Dairy products |
Most of these sugars are refined and then added to foods in the form of syrups during processing or preparation. The U.S. intake of such added sugars (AS) has dramatically increased during recent decades: the mean intake among U.S. adults is currently equal to ≈16% of total calories (∼359 kcal per day), up from 10.6% in the late 1970s.50,51 Current AS intake among people ≥2 years of age is 83.9 g per day,52 equivalent to roughly 20 teaspoons of sugar per day. Among adults, the highest AS intake levels are among men and women aged 19–50 years, with approximately 70–80% of this population segment exceeding the current AS intake recommendation found within the 2009 Scientific Statement by the American Heart Association.53,54
Elevated AS intake has been associated with a myriad of negative health outcomes, including increased blood pressure,55 insulin resistance, fasting and postprandial dyslipidemia,56–59 and a low grade chronic inflammatory state.60,61 The results of large epidemiological trials have also linked AS intake with increased risk of weight gain, obesity, type 2 diabetes, and cardiovascular disease.62–65 Refined sugars offer no beneficial micronutrients or fiber, as do natural sources of sugar, such as fruits, vegetables, and dairy products. This is cause for concern, as the overall nutritional quality of the diet is likely compromised with a high AS consumption.
Public health policy regarding AS consumption is crippled by a lack of data available on whether reductions in AS intake reduce the risk of cardiovascular disease (CVD) or obesity. The American Heart Association has acknowledged that the chronic effect of a high AS intake on CVD risk remains uncertain due to limited and inconclusive research.54 Although calories from AS represent a large proportion of the dramatic rise in caloric intake over the last 30 years,54 the role of AS and sugar-sweetened beverages (SSB) in the development and progression of obesity and related co-morbidities remains controversial.66–73 Given the difficulties associated with quantifying the contribution of AS intake to rising obesity rates and the paramount importance of determining such contributions, the need for objective research methodologies in this area remains substantial.
2.3 Urgent need for an objective biomarker
One particularly illustrative example is the crucial need for an assessment of the adverse effects of AS intake on cardiovascular health. Cardiovascular diseases (CVD) such as heart disease and stroke are the leading cause of mortality in the U.S., and one-fourth of cardiovascular deaths are estimated to be avoidable through healthy lifestyle behaviors (e.g., dietary behaviors, obesity prevention).74 The prevalence of CVD and its associated costs are expected to increase in the coming years, making primary prevention strategies critical to reducing the associated health and economic burden. The relationship between AS intake and risk of CVD, the leading cause of death among U.S. adults,75 is a high-priority research area due to inconclusive evidence regarding the adverse effects of usual AS intake, the benefits of recommended AS intake levels, and the mechanisms by which AS intake influences CVD development.A common limitation of dietary studies is reliance upon self-reported dietary intake data, which is often subject to a certain degree of underreporting.72,76,77 This is a serious problem for sugar-rich foods in particular, as they are the most likely to be underreported by subjects.78Fig. 2 illustrates a study in which an objective biomarker of sugar intake (urinary sucrose/fructose) clearly showed that increased sugar intake was associated with increased odds of obesity, while the exact opposite relationship appeared true when the analysis was performed using self-reported (subjective) sugar intake data.79 The urgent need for novel methods, including biomarkers, to objectively assess dietary intake has been formally recognized by the Institute of Medicine and the National Institutes of Health (i.e., PAR-12-197).80–82
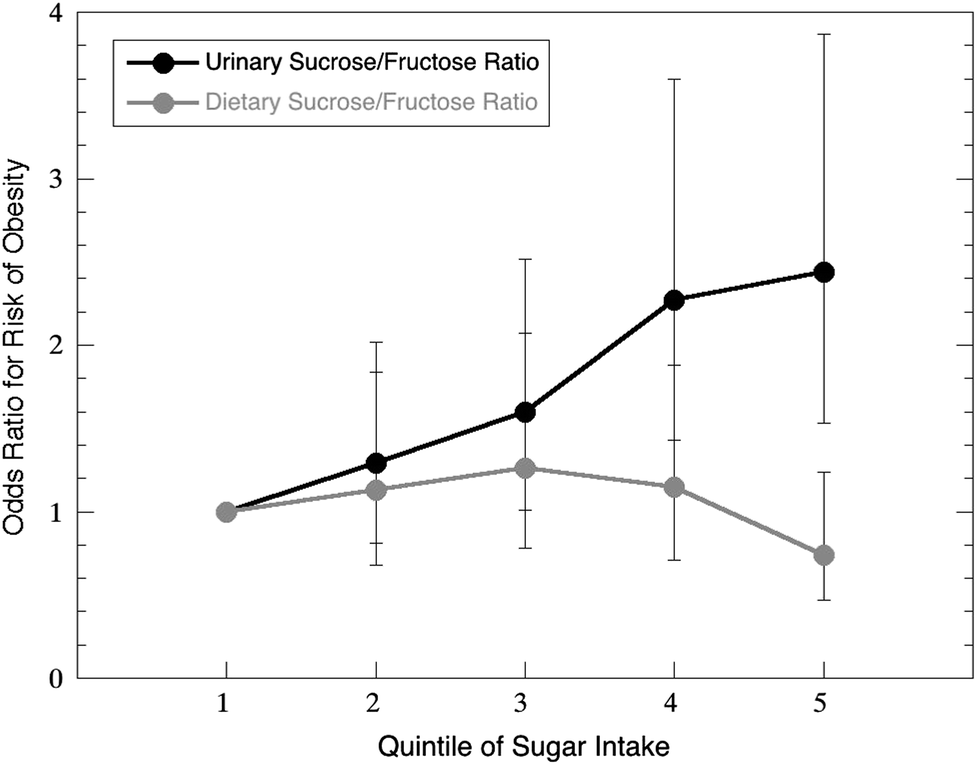 | ||
| Fig. 2 Dietary reports of sugar intake often underestimate actual intake, particularly for high-sugar consumers. Data from Bingham et al.79 shows that the risk of obesity was significantly underestimated by dietary recall of sucrose and fructose relative to estimates based on a urinary biomarker. | ||
3. Dietary assessment
Food intake records, dietary recalls, and food frequency questionnaires are the most commonly used self-reported dietary assessment methods. Each of these methods has strengths and limitations (Table 2).| Method | Strengths | Limitations |
|---|---|---|
| Food intake record/diary | • Less reliant on memory than recalls and FFQ | • High subject burden |
| • Includes detailed information on foods and beverages consumed | • Resource intensive – administered by trained staff, analysis software required | |
| • Recording error is common – missing foods, inaccurate portion size estimation | ||
| • Estimates usual intake over a short time frame (days) | ||
| • Literacy level can be an issue | ||
| • Underreporting is common, eating behaviors can be altered, forgotten foods | ||
| Multiple 24 hour recalls | • Literacy level is less of an issue, compared to records and FFQ | • High subject burden |
| • Includes detailed information on foods and beverages consumed | • Resource intensive – administered by trained staff, analysis software required | |
| • Used in national nutrition surveillance | • Recording error is common – missing foods, inaccurate portion size estimation | |
| • Recall procedure can be automated, computer-administered | • Relies on subject's memory | |
| • Less likely to alter eating behaviors than records, less error due to forgotten foods, if standardized collection procedures and prompts to probe for forgotten foods are included | • Estimates usual intake over a short time frame (days, weeks) | |
| • Literacy level can be an issue | ||
| • Underreporting and reporting bias could be an issue | ||
| Food frequency questionnaire (FFQ) | • Less resource-intensive than records or recalls – does not need to be administered by trained staff; self-administered | • Moderate subject burden |
| • Estimates usual intake over a longer period of time (months, years) | • Must be checked for missing responses, which are common | |
| • More feasibly used in large-scale trials than records and recalls | • Literacy level is an issue | |
| • Less precise than records and recalls | ||
| • Often overestimates micronutrient intake, underestimates kcal intake | ||
| • Must be validated for use in the targeted study population | ||
3.1 Self-reported methods
Food intake records (i.e., diaries) require that study participants record all food and beverage intake for 72–96 consecutive hours following the instructions of a trained research technician. In contrast, dietary recalls are the result of an interview: the participant is asked to describe and estimate the portions of all foods and beverages consumed over the most recent 24 hour period. These interviews are performed unannounced and can be collected in-person or via phone. Data from either method is then analyzed using nutritional analysis software, such as the Nutrition Data System for Research (NDSR) developed by the UMN (http://www.ncc.umn.edu/products/ndsr.html), and then used to estimate the participants' “usual” daily dietary intake. Dietary recalls are generally considered superior to food intake records, as individuals often change their dietary intake when asked to record it.50,83 Both methods are relatively costly, time- and resource-intensive, burdensome for respondents, and do not provide information on longer-term, habitual intake patterns (e.g., intake over months or years). In addition, these methods are often not feasible for use in large-scale investigations or in studies of low-literacy populations.84 Recently, the National Cancer Institute has made available the web-based Automated Self-Administered 24 hour Dietary Recall (ASA24) system for researchers, which may overcome some of the limitations discussed above through the provision of a computer-based dietary recall and analysis process.Food frequency questionnaires (FFQ) provide information about usual dietary intake over a longer period (e.g., months, years), and can focus either on general dietary habits (i.e., the whole diet) or on the consumption of specific categories of foods (e.g., beverages or fat intake). An example of a brief FFQ providing information on beverage intake in the past 30 days, including intake of sugar-sweetened beverages, is the Beverage Intake Questionnaire (BEVQ-15).85 This FFQ takes approximately 3–4 minutes to complete, can be scored rapidly without software, and is available to researchers at no cost. For a “whole diet” FFQ, completion time for participants can range from a few minutes to an hour, depending upon the number of foods included on the questionnaire. FFQ may be more feasible than food records or recalls for large-scale trials, but this method is generally considered less precise, as it tends to overestimate micronutrient consumption and underestimate calorie and macronutrient consumption.84 In addition, FFQ must often be tailored for the population under study, as they include only a limited list of foods and beverages; for example, an FFQ developed for the U.S. adult population may not be useful for a study of adolescents. The universal problems with all self-reported dietary assessment methods include underreporting, literacy level, reliance on memory, commonly forgotten foods such as beverages, and social desirability bias.86
3.2 Objective methods
Alternatives to using self-reported dietary intake methods include the direct observation of food intake by a trained observer, which is generally not feasible when studying free-living populations. An additional objective measure is 24 h urinary sucrose/fructose analysis, which assays the small amount of dietary sucrose and fructose that is normally absorbed intact in the small intestine and subsequently excreted by the kidneys. This method represents a potential biomarker of sugar consumption, and validation studies have been conducted in both normal weight and obese adults.87,88 Urinary sucrose is particularly indicative of the intake of AS,89 which may be due to the quicker digestion and absorption of AS when compared to natural sugar sources (e.g., fruit). We note, however, that urinary sucrose/fructose only provides an indicator of dietary sugar intake for the period during which the urine is collected and reflects both fructose consumed from AS and fructose consumed from natural sources of sugar. Furthermore, this biomarker technique requires that study participants collect all urine samples for two to eight 24 hour periods, and that researchers verify the completeness of study participant's urine collections by using chemical indicators of compliance (e.g., para-aminobenzoic acid or “PABA”). Because test subjects tend to view even one 24 h urine collection as cumbersome, the urinary sucrose/fructose assay may not be compatible with long-term or large-scale trials aimed at determining relationships between AS intake and disease risk. Validation studies (e.g., ref. 87) have determined that substantial intra- and inter-individual variability exists with this technique, even with a controlled diet including a standardized level of sugar intake. Additionally, because the amount of sucrose absorbed is controlled by the permeability of the small intestine, any diseases or medications which alter gastrointestinal function and permeability (e.g., Celiac disease or the widely-used non-steroidal anti-inflammatory drugs (NSAIDs)) may interfere with the accuracy of this approach to determine AS intake.904. Dietary biomarkers
A medical biomarker is a characteristic that can be objectively measured and evaluated as an indicator of human biological processes. Great advances in medical science have come from the development of key biomarkers: one important example is the measurement of the serum protein Troponin, a product of heart muscle contraction, that is a sensitive indicator of recent myocardial cell injury91 and is also predictive of 60 day mortality and organ failure.92 Dietary biomarkers are different in that they are biomarkers of exposure: they provide information on previous dietary intake.78,93 Biomarkers can be described relative to the time frame during which dietary intake is reflected, with short-term biomarkers reflecting intake over hours or days, medium-term reflecting intake over weeks or months, and long-term reflecting intake over months or years.93,94 Dietary biomarkers can also be classified as either recovery or concentration biomarkers.78,93 Recovery biomarkers measure the excretion of the biomarker over a certain time frame; for example, the nitrogen content of urine is a biomarker for dietary protein intake.95 Concentration biomarkers are correlated with intake, but do not directly measure actual dietary intake; for example, the carotenoids found within fruits and vegetables96 can be measured within blood as a direct reflection of intake.97An ideal biomarker for AS intake would demonstrate validity (i.e., measures what is intended), reliability (i.e., reproducibility), and the sensitivity to detect changes in AS intake over time in response to dietary manipulation or intervention.78,93,94 According to Kuhnle,78 an important but often neglected issue in developing biomarkers is validation. To validate a dietary biomarker, actual dietary intake must be known; this is accomplished with a controlled feeding study design. In addition to these criteria, the biomarker sample collection and analysis should be possible at a reasonable cost for researchers, the degree of invasiveness should be acceptable for study participants, and the sample collection method should be feasible for participants and researchers.76,93,94 The ideal biomarker is non- or minimally-invasive, inexpensive and specific.80 The measurement of the δ13C value of human tissues could meet many of these criteria, provided that the approach is optimized after validation.
4.1 Potential substrates for bioassay
Because carbon is the second most abundant element by mass in the human body and is present in virtually every tissue,98 there are many potential substrates for the bioassay of δ13C value. In determining the applicability of specific tissues in a biomarker setting, there are four key qualities to consider. These include: (1) turnover rate: timescale of dietary history reflected by the biomarker (2) invasiveness: the amount of pain or discomfort associated with sampling procedure (3) availability: amount of sample available in previously archived form and (4) storage/preparation conditions: special storage conditions or processing steps required prior to analysis. Since all human tissues can be found somewhere upon a continuum of these traits, the selection of substrate for isotopic analysis becomes a negotiation of multiple practical considerations.While the isotopic analysis of a homogenized whole-body has been performed upon small animals to yield an estimate of dietary consumption,19 such sampling is obviously unattainable for live human subjects. Once biomineralized, tooth enamel does not reabsorb or reprecipitate,99 making it a potential isotopic substrate free of turnover. However, the carbon in tooth enamel reflects only dietary intake during tooth formation, which is usually completed between the first 3–7 years of life.100 While carbon within tooth enamel is the preferred substrate for isotopic analysis of deceased human tissues due to its resistance to post-mortem degradation,101 its high invasiveness and low availability render it inappropriate for all but the most specialized forensic or clinical studies.102 Collagen, the most prevalent protein in bone, has been shown in controlled feeding trials using mice to reflect the isotope composition of the diet with high precision between samples.19 The long turnover time of bone collagen (e.g., years in adult long bones) makes it ideal for determining the long-term feeding patterns of deceased organisms.103 However, the extreme invasiveness associated with sampling bone from living humans precludes its applicability in living human trials. Fingernail and hair sampling presents less-invasive alternatives to bone sampling (composed of the fibrous protein keratin,104 these tissues are relatively resistant to microbial degradation105) and have been widely adopted in both paleo- and modern dietary studies.106–109 The sampling of these tissues is minimally invasive, can be performed without training, and subsequently requires no special storage or shipping conditions after collection. However, assays of hair and nail tissue are complicated by uncertainty as to the exact period of dietary history that their growth represents: controlled studies involving sudden changes in the isotopic composition of diet resulted in new steady-values of δ13C value in hair only after 2.3 to 4.0 months.110,111 While hair and fingernail present ideal substrates for determining dietary patterns among populations with stable longer-term dietary habits, limitations arise when considering shorter-term dietary habits of populations consuming heterogeneous diets. Substrates with relatively short turnover times may be obtained by sampling carbon output pools, including urine and fecal matter. Collection of these tissues is minimally invasive, and the δ13C value of urinary steroids has been validated as an anti-doping test.112 Recently, urine and fecal δ13C values were shown to reflect recent changes in red meat and fish intake in an 8 day controlled feeding trial, while stable isotope values of whole blood, a tissue with a slow turnover time, did not change after the dietary intervention period. Thus, urine and feces are attractive substrates for tracking short-term dietary intake, but sample collection, storage and handling nuisances have hindered widespread adoption for biomarker studies.113
Blood represents the most widely sampled human tissue due to the vast array of diagnostic information that can be obtained from a single sample, as “every cell in the body leaves a record of its physiological state in the products it sheds to the blood.”114 Massive archives of human blood exist worldwide, collected in conjunction with a wealth of dietary and disease data. Examples include the National Health and Nutrition Examination Survey (NHANES), an ongoing study by the Centers for Disease Control and Prevention (CDC) that combines interviews and physical examinations,114 and the Atherosclerosis Risk in Communities Study (ARIC) which has followed a cohort of ∼4000 individuals aged 45–64 since 1987, collecting medical, social and demographic data.115 Blood can provide information about dietary intake over a wide variety of timescales ranging from a few hours to a few months depending on the fraction of blood that is isolated for analysis.116,117 The disadvantages associated with using venous blood include the mildly invasive (although, routine in clinical settings) nature of venipuncture, which requires a trained phlebotomist for collection, and the need for special storage and preparatory steps (e.g., centrifugation, low-temperature transport and storage) prior to isotopic assay. One promising alternative is the use of fingerstick blood, which is non-invasive, can be performed with minimal equipment, and can be stored and transported as a dry blot, mitigating many of the disadvantages presented by venous blood.118 Many assays essential to nutrition research have already been adapted to fingerstick sampling (e.g., hemoglobin, glucose and cholesterol119) and fingerstick-based methods allowing for whole genome transcript profiling are currently in development.120
5. Carbon isotopes in sugar
Plants are the only organisms that can make sugar out of inorganic carbon; their metabolic synthetic processes (known as “photosynthesis”) controls the carbon isotopic composition of all sugars available in the human diet. Beets, grapes, sugar cane and corn are some of the many plants from which sugar is extracted, purified and subsequently used to sweeten other foods. Photosynthesis acts to reduce carbon dioxide (CO2) from the atmosphere and transform it into sugar via the Calvin cycle (Fig. 3); this process discriminates against 13C, causing the δ13C value of plants tissues to be lower than the δ13CO2 value available to the plant.121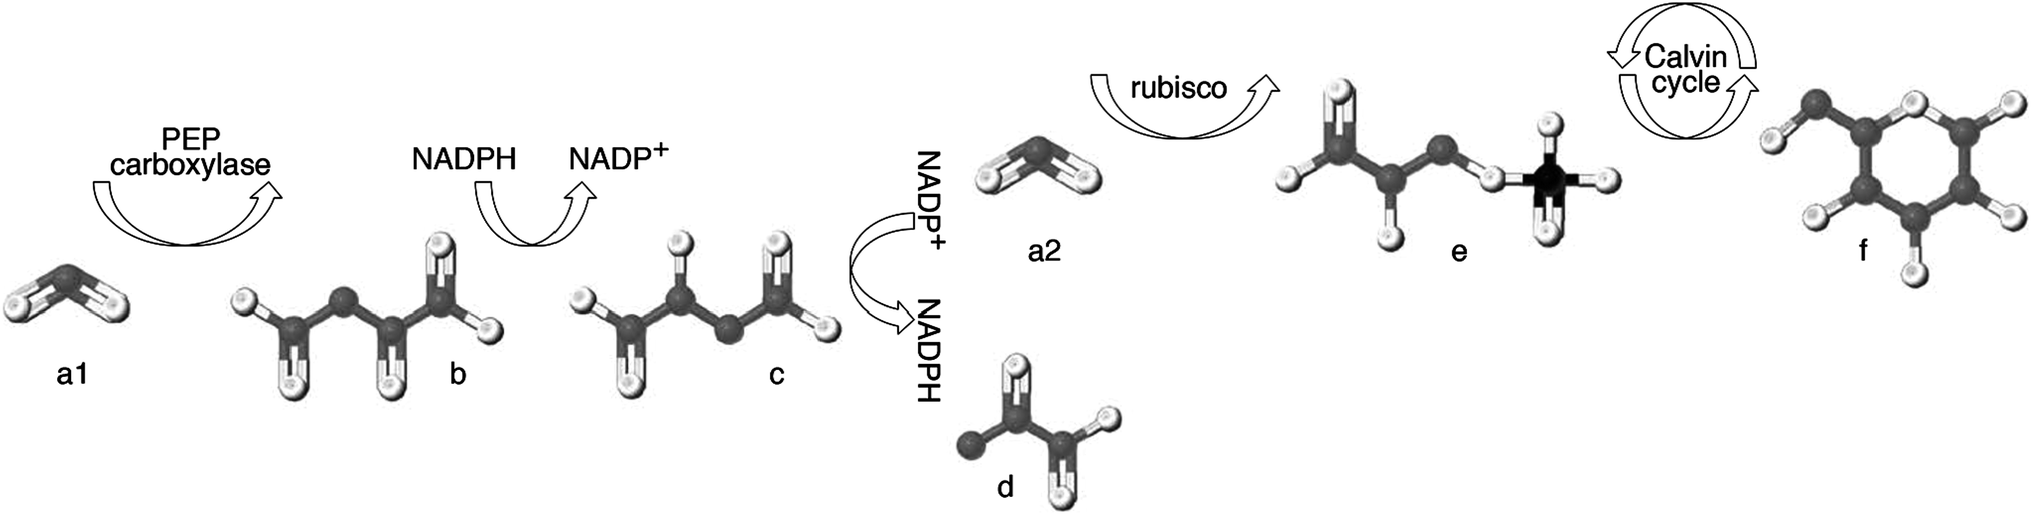 | ||
| Fig. 3 Intermediate carbon compounds involved in photosynthesis. “C3” photosynthesis employs the rubisco enzyme to fix carbon dioxide (a2) as 3-phosphoglycerate (e) which then enters the Calvin cycle to ultimately produce glucose (f). During “C4” photosynthesis, carbon dioxide (a1) is first fixed via the enzyme phosphoenolpyruvate carboxylase as oxaloacetate (b). Oxaloacetate (b) is then transformed to malate (c) via the oxidation of NADPH, and transported across the membrane that separates the mesophyll cell from the bundle-sheath cell, where rubisco is located. After transport, malate (c) is decarboxylated to produce pyruvate (d) and carbon dioxide (a2) via the reduction of NADP+, and this regenerated carbon dioxide (a2) forms the substrate for rubisco-facilitated fixation. | ||
The difference in carbon isotope value between a plant and the atmosphere under which it has grown differs between plant species by more than 20‰, and is caused by processes both internal (e.g., diffusion through the stomata) and external (e.g., the atmospheric concentration of CO2) to the plant (reviewed in ref. 6). Isotopic fractionation during photosynthesis is most strongly influenced by the enzyme catalyzing the initial carboxylation of CO2.122 The vast majority of plants employ the enzyme ribulose biphosphate carboxylase-oxygenase (rubisco) to fix CO2 (Fig. 3a2) into 3-carbon phosphoglycerate (Fig. 3e), which then enters the Calvin cycle to ultimately produce glucose (Fig. 3f). This process, known as “C3 photosynthesis,” is the carbon reduction pathway used by all citrus fruits, grapes, berries, melons, apples, bananas and beets, and results in plant tissue with δ13C values ranging from approximately −24 to −32‰ (Fig. 4).
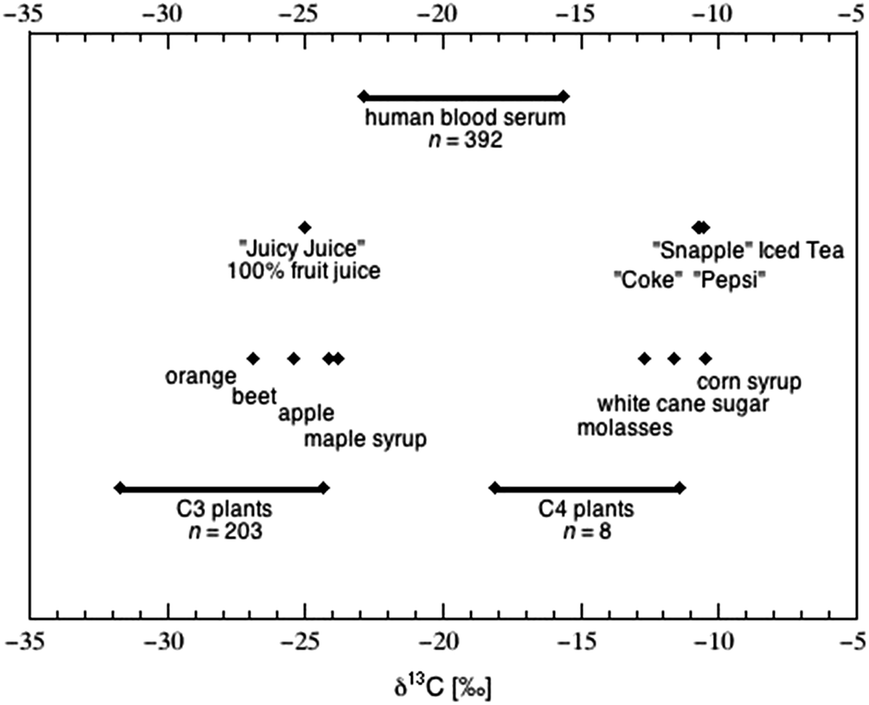 | ||
| Fig. 4 Carbon isotope composition of plants, food and human blood serum, as compiled from large-scale studies. Data for 203 species of C3 plants (ref. 123) is contrasted with data for 8 species of C4 plants (ref. 124) that include all the major clades found in each group. The δ13C values of food products (both as ingredients and as sweetened beverages) reflect the plant type of origin.36 The distribution of δ13C values within human serum125 spans the range of values attributed to both C3 and C4 plants, and absolute value has been correlated to sweetener intake at various levels of significance.126 | ||
Out of the 400+ families of flowering plants, less than 5% contain species adapted for the pre-concentration of CO2 prior to its fixation by rubisco. This relatively rare pathway first fixes carbon dioxide (Fig. 3a1) via the enzyme phosphoenolpyruvate carboxylase (PEP carboxylase) as oxaloacetate (Fig. 3b), which is then transformed to malate (Fig. 3c) and transported across a membrane to where rubisco is located. After transport, malate is decarboxylated to produce pyruvate (Fig. 3d). The resulting CO2 (Fig. 3a2) serves as the substrate for rubisco-facilitated fixation. Because the first product of fixation is the four-carbon compound oxaloacetate, this is known as “C4 photosynthesis”. This pre-concentration allows the rubisco enzyme to work more efficiently by excluding the interference of oxygen within the bundle-sheath anatomy, leading to high net photosynthetic rate.127 This mechanism also serves to greatly reduce the net isotope fractionation imparted by photosynthesis128 and results in plant tissue with δ13C values ranging from approximately −11 to −19‰ (Fig. 4). These “C4 plants” represent only a small number of the Earth's plants, and rarely approach 50% of the species present even within the grassland ecosystems where they are most commonly found.129 However, three important sugar crops happen to be C4 plants: corn (Zea mays), sugar cane (Saccharum officinale) and sorghum (Sorghum vulgare).
5.1 Sugar in food
A myriad of recent studies describe the negative health effects of excess sugar consumption,130 yet many important sources of nutrients, such as fruits and some vegetables, are sources of intrinsic sugars.131 Here, we further specify “added sugar” as sweetener added to foods during processing or preparation offering no health benefits to the consumer. The primary sources of AS in the U.S. diet include sugar-sweetened beverages (43% of total AS), sugars and candy (16%), and sweetened grains (e.g., cookies; 19%).50,51 Added sugars contribute a large portion of the calories within the typical American diet: ≈13–16% of total calories come from AS.50,51,132 Moreover, 78% of AS found in the typical American diet were refined from C4 plants, e.g., corn, cane syrups and sugars (Fig. 5).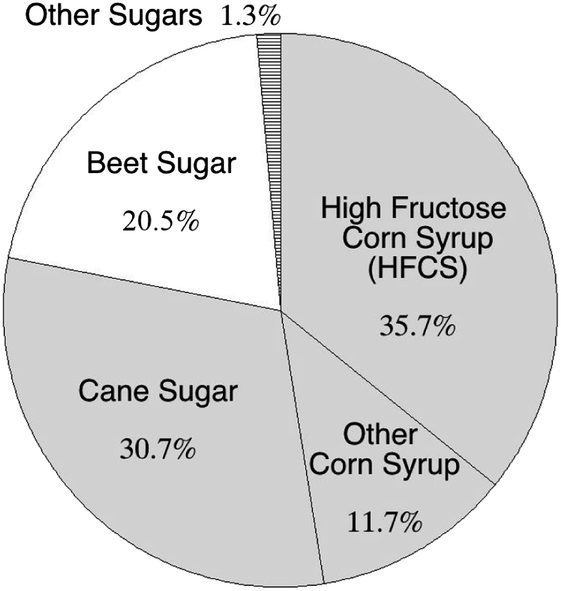 | ||
| Fig. 5 Added sugars in the U.S. food supply, separated by type. Sugar derived from C4 plants (corn and cane) form the majority of these added sugars, totaling 78.1%. Data is for 2012, compiled by the United States Department of Agriculture (USDA) Economic Research Service.133 | ||
The δ13C value of a sweetener reflects the isotopic composition of the plant from which it was refined;36 corn syrup, cane sugar and molasses range in δ13C value from −10 to −13‰, falling within the general range of C4 plants (Fig. 4). Many foods high in AS content (e.g., candy) carry a C4-signature in their carbon isotope composition (Table 3). Sugar sweetened beverages (SSB), which have been associated with weight gain,134–136 are a topic of intense controversy in terms of heath advice137 and regulation through taxation.138 While beverages sweetened with concentrated fruit juices have a δ13C value similar to the likely fruits of origin (e.g., orange, grape, apple), beverages sweetened by cane sugar and/or HFCS (e.g., soda) have δ13C values close to −10‰ (Fig. 4).
| Food | δ 13C value [‰] |
|---|---|
| “Runts” hard candy | −10.7 |
| “SweeTarts” hard candy | −10.7 |
| “Bottle caps” hard candy | −11.0 |
| York peppermint patty candy | −16.4 |
| Kellogg's corn pops cereal | −15.3 |
| Kellogg's frosted flakes cereal | −16.4 |
| Nature's path sweetened corn flakes cereal | −13.2 |
| Berry berry kix cereal | −12.1 |
| Chocolate cheerios cereal | −13.4 |
| General mills cocoa puffs cereal | −13.1 |
| General mills trix cereal | −12.7 |
| Heinz ketchup | −15.4 |
| Del Monte fruit cocktail syrup | −17.2 |
| Dried papaya (sweetened) | −13.7 |
| Dried pineapple (sweetened) | −13.9 |
| Breyer's cherry vanilla frozen dairy dessert | −15.6 |
5.2 Sugar in the human body
Carbon isotope ratio mass spectrometry is a tool with exceptional power and precision. For illustration, within a sample composed of 1,000,000 molecules of glucose, there are typically 11,125 13C12C5H12O6 molecules if the glucose was derived from corn syrup. In contrast, if the glucose was derived from beet sugar, it would typically contain 10,956 13C12C5H12O6 molecules. For context, modern continuous-flow IRMS techniques allow for the resolution of <1 molecule per 1,000,000 in the glucose sample above, making possible an abundantly clear differentiation between corn and beet. In the units of isotopic measure, the vast majority of C3 and C4 plants (and by extension, the sugars refined from these plants) are separated by 5 to 20 units permil [‰]. The uncertainty associate with triplicate measurements of δ13C value on properly homogenized samples rarely exceeds ±0.1 unit permil [‰].The refined sugars that comprise AS represent a highly-palatable, minimally satiating source of calories that consumers may find pleasureable;136 consequently, AS consumption has increased dramatically in the last several decades.139 Food sources of AS represent three of the top ten sources of calories in the diet among Americans aged ≥2 years.52 In the U.S., HFCS intake has increased by more than 1000% in the last thirty years,140 an increase mirrored by trends in overweight and obesity.141,142Table 4 shows the data breakdown of AS by type according to their total calorie contribution. Extrapolating this data to total AS consumption data, the average American consumer ingests 10.16% of his or her total calories in the form of corn- or cane-derived sugars and syrups,132,133 while this value exceeds 25% in citizens with the highest levels of consumption.51
| Sweetener | % of Total calories consumed |
|---|---|
| High fructose corn syrup | 4.6 |
| Other corn syrups | 1.5 |
| Cane sugar | 4.0 |
| Beet sugar | 2.7 |
| Other sweeteners (e.g., honey, maple syrup) | 0.2 |
| Total added sugars | 13.0 |
All of the above facts taken together promote great optimism that a δ13C-based biomarker for AS consumption can be developed for human tissues, with widespread potential impacts on human health outcomes research. Because the carbon-isotope composition of most AS is relatively conspicuous and can be well-separated analytically from other sources of calories, it stands to reason that consumption of AS might be highly correlated with the δ13C value of a tissue assay. However, the myriad metabolic transformations that occur after carbohydrates enter the digestive system greatly complicates the hypothesis that isotopically, “we are what we eat.”143Fig. 6 presents a schematic that illustrates the complex and contingent nature of carbon cycling in human tissues (see also Table 5). Though the schematic is highly simplified, it effectively highlights the liver as a clearing house and re-packaging center for proteins, carbohydrates and fats, mainly in the form of amino acids, glucose/glycogen and fatty acids/triglycerides. Once a carbohydrate (e.g., AS) is digested and absorbed into the bloodstream as a monosaccharide such as glucose (Fig. 6A), it may be immediately used for energy by any cell in the body via glycolysis and aerobic respiration or combined with an amino group via transamination to form a non-essential amino acid (Fig. 6N), the building blocks of tissue protein (Fig. 6L). This glucose may also be used to synthesize glycogen, the storage form of carbohydrate, via glycogenesis (Fig. 6C), or converted to fat via de novo lipogenesis (Fig. 6E and G). Glycogen and fat, which are stored in a variety of tissues, can be broken down and used for energy production or amino acid synthesis when carbon input is low (i.e., after a meal). The above suggests that carbohydrate in the diet could eventually be incorporated into most types of tissues available for assay, including proteins (e.g., hair, fingernails, red blood cells), carbohydrates (e.g., blood glucose), or fats (e.g., blood lipids). However, each of the processes illustrated by Fig. 6 and listed in Table 5 may impart an isotopic fractionation based on preferential incorporation of 12C over 13C (or vice versa) and the magnitude of fractionation specific to each process is currently unknown, though they may be approximated when integrated across the whole-organism.144 This may be further confounded by the fact that each of the tissues available for assay listed above may also contain substantial carbon ultimately derived from ingested proteins and fats. Finally, it is important to remember that much of what we consume is oxidized for energy, rather than incorporated into tissues during growth or maintenance. In fact, most of the carbon consumed as food is ultimately exhaled as CO2 after use in oxidative phosphorylation at or near many of the transformations depicted in Fig. 6. For these reasons, the literature to date has focused upon testing the correlation between diet as characterized either by bulk δ13C value or by food composition (e.g., AS intake quartile) and the δ13C values of human tissues.
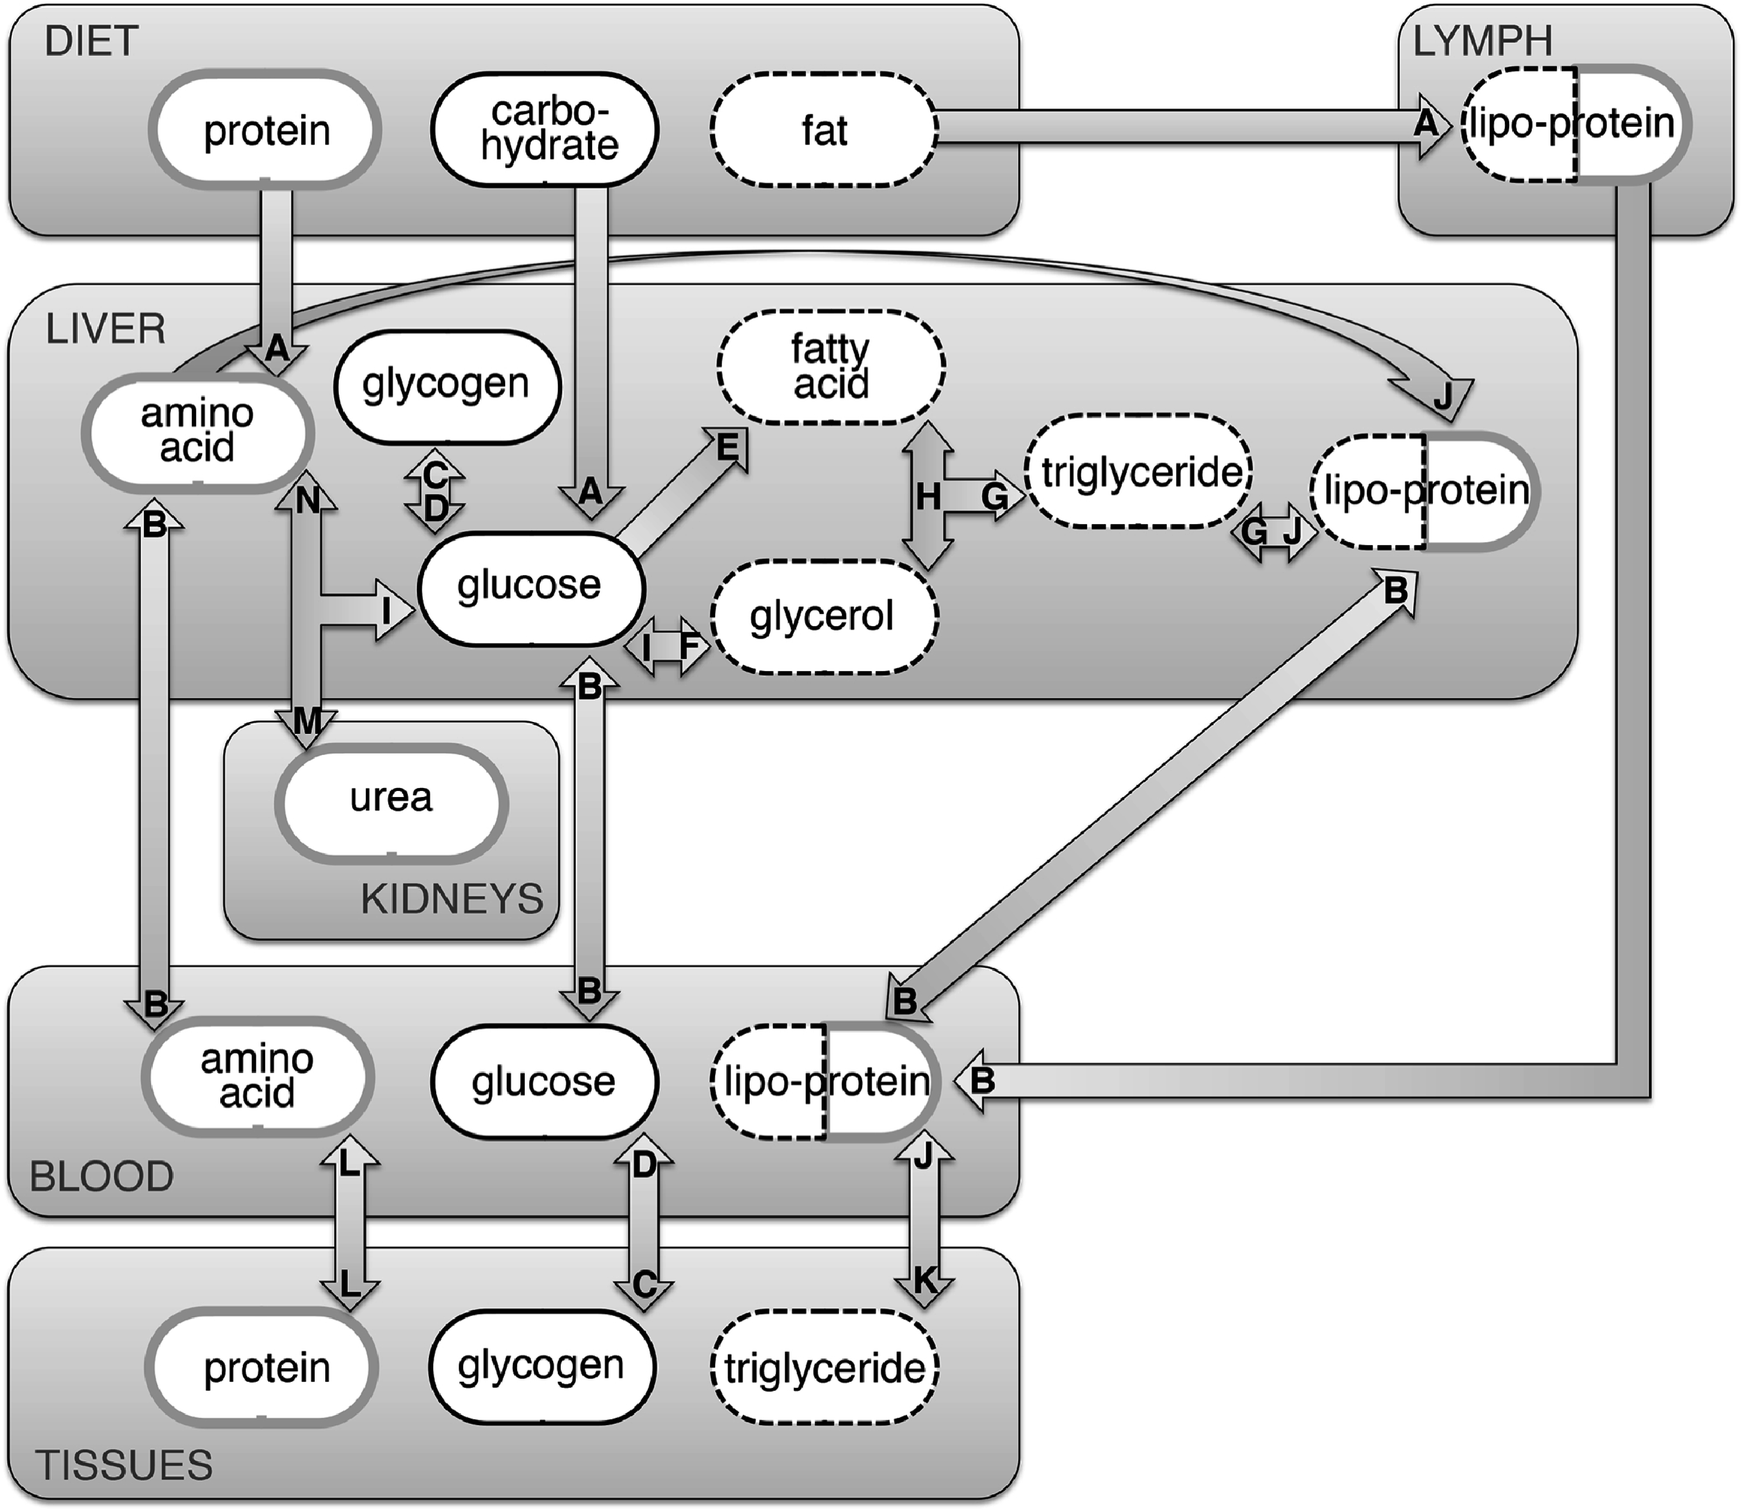 | ||
| Fig. 6 Simplified schematic depicting the incorporation of diet into human tissues. Arrows signify transformations; letters correspond to descriptions presented in Table 5. Each component (e.g., protein, carbohydrate, fat, etc.) contains carbon that may be isotopically fractionated during transformation, and eventual incorporation into human tissues such as red blood cells, fingernails and hair. In addition, carbon can be lost due to use in oxidative phosphorylation at or near many of the transformations depicted. | ||
| Designation | Process | Description |
|---|---|---|
| A | Digestion | Carbohydrates, fats and proteins ingested from food and drink are broken down within the mouth, stomach and intestines into (primarily) monosaccharides, fatty-acids and amino-acids, respectively |
| B | Transport | Transport across biological membranes |
| C | Glycogenesis | Glucose is converted to glycogen |
| D | Glycogenolysis | Glycogen is mobilized as glucose |
| E | De novo lipogenesis | Glucose is broken down into acetyl CoA for fatty acid synthesis and subsequent triglyceride synthesis |
| F | Glyceroneogenesis | Glucose is converted into glycerol |
| G | Triglyceride synthesis | Fatty acids, both free and within soluble lipoproteins, are converted into triglycerides |
| H | Lipolysis | Triglycerides are converted into glycerol and free fatty acids |
| I | Gluconeogenesis | Glycerol and/or amino acids are converted to glucose |
| J | Lipoprotein synthesis | Endogenous and exogenous lipids are incorporated with amino acids to form water-soluble lipoproteins |
| K | Deposition | Triglycerides are concentrated into adipose tissue or muscle |
| L | Protein synthesis/degradation | Synthesis/degradation of complex tissues such as muscle, nails, hair and/or blood cells from constituent amino acids |
| M | Urea cycle | After amino acids are enzymatically deaminated, the residual amino group is converted to urea and excreted |
| N | Amino acid synthesis | Glucose is combined with a nitrogen source to synthesize non-essential amino acids |
6. Carbon isotope studies
6.1 Interpreting biomarker statistics
The ultimate goal of nutritional biomarkers is to accurately predict consumption of a certain food/nutrient. Statistical approaches aimed at establishing the correlation between a proposed biomarker and food/nutrient intake are often utilized in such investigations, with simple correlational and linear regression analyses being common examples. In the case of a stable isotope biomarker of AS intake, simple correlational or linear regression analyses are used to assess associations between tissue δ13C value and the amount of dietary AS consumed, which is provided by the correlation coefficient (r). Linear regression can also be used to determine if significant correlations persist after controlling for possible confounding variables, as described later (see Section 8.1). For δ13C, linear regression can be used to determine if the proposed biomarker is independently associated with AS intake, after accounting for the potential dietary confounds of non-sweetener corn and animal product consumption.145 Accounting for potential confounding variables in statistical analyses may also improve the validity of biomarker as a predictor of dietary intake.145Correlation coefficient interpretation is somewhat subjective. Thus, some researchers opt to provide the coefficient of determination (R2) instead. The coefficient of determination, which is simply the correlation coefficient squared, provides the amount-percent of the variation in the dependent variable (AS intake) that can be explained by variation in the independent variable (stable isotope biomarker) (Taylor). P-Values are provided with r and R2 values, in order to denote the level of significance of the associations between variables. Correlations measured between nutritional biomarkers and reported dietary intake vary widely in research trials, with typical r values ranging from 0.03–0.70, with a mean of ∼0.39.118,146 While these correlations may be interpreted by some as weak to modest, they may underestimate the true validity of these biomarkers due to the inherent inaccuracy of self-reported dietary intake measures, and r values of 0.5–0.7 are typically considered acceptable as a “realistic degree” of precision in dietary validation studies.146 Determining the validity of a biomarker in a clinical/research setting also requires consideration of a nutrient's diagnostic importance and the accuracy of current dietary assessment methods in determining intake. Hence, biomarkers with weaker relationships to a specific nutrient may still be considered for clinical application if the nutrient of interest is of high clinical importance and is often misreported in conventional dietary assessment methods.
Given the myriad factors involved in biomarker data interpretation, assigning “strengths” to the r and R2 values obtained during analysis is somewhat subjective, and the strengths ascribed to correlations will differ between studies and across disciplines. To avoid confusion in the following sections and provide coherency, correlations reported in the following sections will be assigned strengths based on the following scale: 0.1–0.3 = weak/small; 0.4–0.6 = moderate; 0.7–0.9 = strong.147
6.2 Human hair
Hair is the most widely-used substrate for isotopic analysis as a method of dietary reconstruction in modern humans.106,107,111,148–160 Several studies have investigated the use of stable isotopes in human hair as a biomarker of food consumption patterns through controlled feeding trials. Human hair is a complex substrate composed of a variety of protein and lipid components. The bulk of a hair's shaft is composed of α-keratin, a fibrous protein that imparts rigidity and stability. This stability, combined with the relatively noninvasive nature of hair sampling techniques, recommends hair as an isotopic substrate for large-scale epidemiological and clinical studies where ease of sampling and storage conditions are often decisive factors in substrate selection. Early studies in contemporary humans compared the isotope values of human hair with whole diet. The first of these studies, conducted by Nakamura et al.,148 compared the δ13C values of common food items from Chicago, Tokyo, and Munich to the δ13C values of hair from human subjects living in each city. The study showed a positive correlation between the δ13C values of human hair and the δ13C values of dietary protein. In keeping with the earliest experiments on animals,144 Nakamura et al. also found that human hair was enriched in 13C by 1.7‰ relative to whole diet.148 Similar enrichment values of 1.4‰ were observed by Schoeller et al.,149 who compared the δ13C values of common food items to the δ13C values of hair samples from 40 individuals living in Chicago. In contrast, Yoshinaga et al. discovered larger and more variable carbon isotope enrichments (1.8 to 4.8‰) between the diet and hair of indigenous populations residing in undeveloped areas, which was possibly the function of seasonal variations in native dietary food sources.151 Schoeller et al.149 suggested that the δ13C value of human hair was correlated with the consumption of C4 plants. This relationship was later tested by Huelsemann et al.,111 who conducted a 4 week controlled dietary change in which subjects went from consuming a traditional German diet (61% of dietary carbon from C3 plants and 31% of dietary carbon from terrestrial animal meat) to a diet based on C4 plants (71% of dietary carbon) and marine animal products (8% of dietary carbon), with no change in total calories consumed. The C4 plant foods, which comprised the bulk of the experimental diet, consisted of corn, millet, amaranth, and cane sugar minimally supplemented by C3 vegetables in order to meet nutrient requirements. As expected, all subjects demonstrated significant increases in hair δ13C values of 1.7 to 3.9‰ over the course of the feeding trial (Fig. 7), but did not reach a new steady state during the four-week experiment. Based upon the above, the δ13C value of hair may be an effective biomarker of medium-term dietary intake (weeks/months), but data on sensitivity to AS intake per se is at present lacking.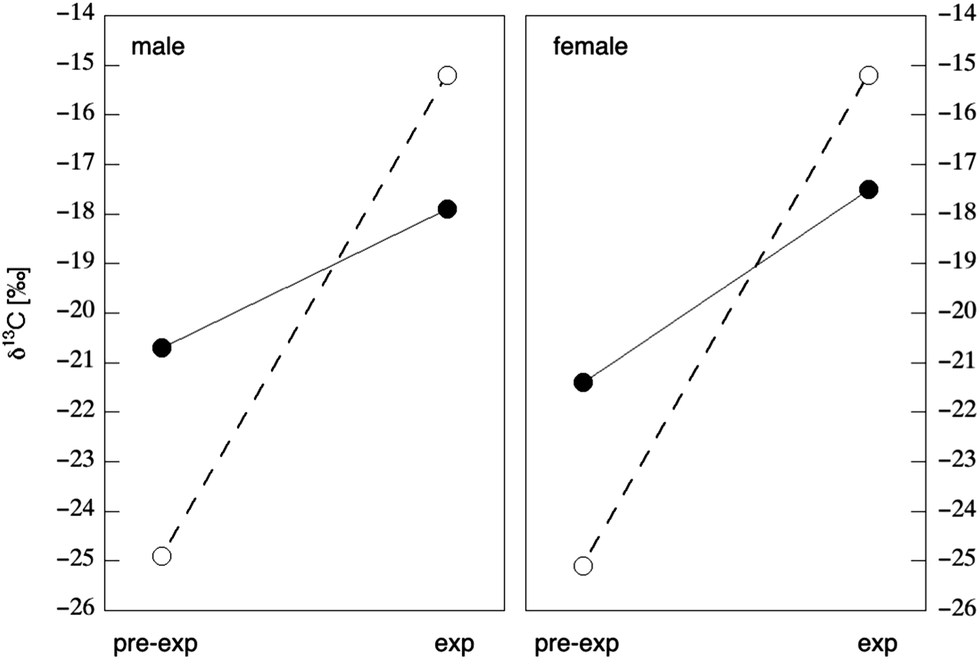 | ||
| Fig. 7 Change in carbon isotope composition in male (left) and female (right) hair in response to dietary change. Open circles represent the δ13C value of diet prior to (“pre-exp” ± 1.5‰) and during (“exp” + 0.7‰) the 28 day feeding experiment. Closed circles represent the δ13C value of hair prior to feeding (“pre-exp”) and the maximum value seen in hair 5.5 months after the beginning of the dietary change (“exp”). Data from Tables 3 & 4 of Huelsemann et al.111 | ||
6.3 Human fingernails
Nail tissue is in many ways similar to hair tissue: fingernail and toenail are noninvasive substrates primarily composed of the protein keratin. Both human hair and nails grow at a relatively constant rate among individuals, allowing for a rough timescale to be determined based on the placement of the sample. As might be predicted from the above, hair and nail tissues from the same person were found to be similar with respect to δ13C value, with hair keratin being slightly enriched (+0.21‰) in δ13C value compared to nail keratin.153 The first study to apply nail isotope analysis in a nutritional biomarker setting was conducted by Nardoto et al.,109 who sought to determine if the isotopic composition of fingernail allowed for differentiation according to diet in 816 individuals living in both urban and rural regions of the United States and Brazil (Fig. 8).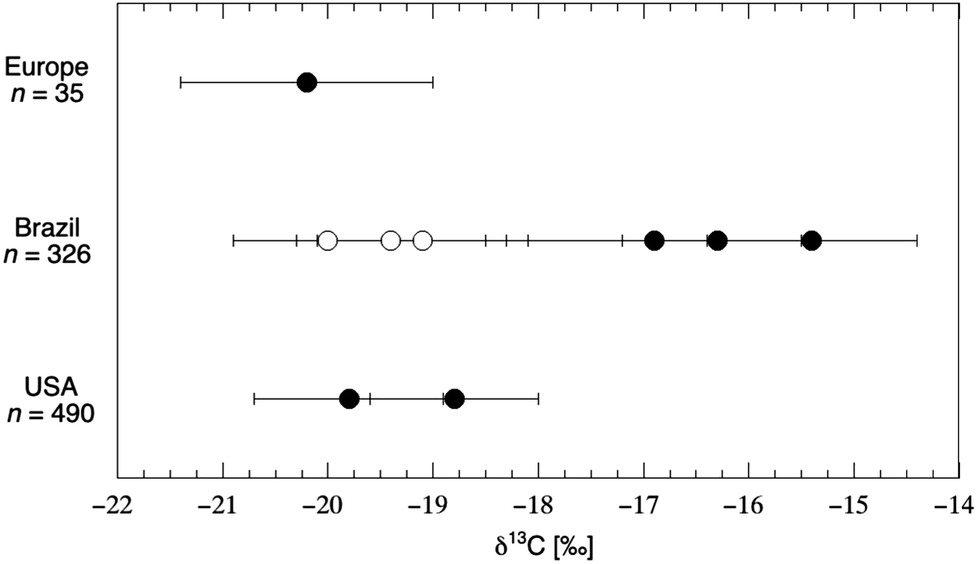 | ||
| Fig. 8 Carbon isotope composition of fingernail samples from people living in Europe, Brazil and the United States. Open circles represent individuals living in isolated areas subsisting on small-scale fishing and agriculture; “error bars” represent the standard deviation of each sample population (n: 6 to 455). Within the urban populations of both Brazil and the U.S., vegetarian subjects tended to exhibit δ13C values that were ≈1‰ lower than that of omnivorous subjects. Data from Table 3 of Nardoto et al.109 | ||
Guided by FFQ-data on types of foods consumed and frequency of animal protein consumption, the study determined the δ13C value of foods commonly consumed in each region. They observed the fingernails of urban Brazilian subjects to be enriched in δ13C value by +3.9‰ relative to those of rural Brazilian subjects; they also observed the fingernails of omnivore subjects to be enriched in δ13C value by +1.5‰ relative to those of vegetarian subjects within the urban Brazilian population. Finally, they observed the fingernails of urban Brazilian subjects to be enriched in δ13C value by +3.4‰ relative to those of urban U.S. subjects. These isotopic differences were reflected in the isotopic signature of food samples from each region, as meat products from Brazil were enriched in δ13C value by +6.7‰ relative to similar products from the U.S. In a similar study, the authors showed a significant enrichment of +0.9‰ in nail tissue from the highest socioeconomic classes compared to the lowest class in an urban Brazilian population, which was attributed to higher consumption of processed foods and soft drinks amongst the affluent in urban Brazil.161
The significant delay between fingernail formation and sampling present logistical issues which may limit the applicability of nail as a biomarker substrate. The growth rate of fingernails is ∼100 μm per day;162 therefore, a 1 mm length of nail reflects approximately ten days of dietary history. However, nails grow from the root outward, and an average fingernail length represents about six months of growth,162 although this is highly variable based on age, race, and sex.163 Given the large displacement and variability between nail synthesis and sampling availability, nail substrates are most appropriate for studies seeking to determine population-wide dietary intake trends among subjects with consistent dietary patterns, and could thus be considered reflective of long-term dietary intake. As with hair, data on sensitivity to AS intake per se has not been gathered.
6.4 Red blood cells
Red Blood Cells (RBC; erythrocytes), White Blood Cells (WBC; leukcocytes), and many other specific cell-types may be isolated from whole blood164 and analyzed for isotopic composition. RBCs, which comprise approximately 45% of total blood volume, transport oxygen and carbon dioxide to and from the lungs, and have an average lifespan of ∼120 days,165 suggesting that RBCs may incorporate dietary intake across 3–4 months. Nash et al.166 measured associations between RBC δ13C values and intakes of “traditional” versus “market” foods in a Native Alaskan population, and found a moderate positive correlation (r = 0.46, p < 0.0001) between market food consumption and RBC δ13C. The authors noted that “market” food included a variety of products that directly and indirectly incorporated C4 plant content, including corn and sugarcane-based products as well as meat from corn-fed animals, which likely strengthened their findings compared to similar studies specifying added sugars as the dependent variable. In the authors' follow-up study, which broke down the category of “market foods” into total sugar, commercial meats, and corn products, RBC δ13C exhibited a greater association with commercial meat intake than total sugar intake. While the δ13C value of RBC offers a compelling biomarker for determining intake of total C4-based foods, the greater association with protein-based food items limits its use in isolation in an AS biomarker application, although dual-isotope and specific-compound approaches may increase the specificity of RBC analysis for sugar-based food items (discussed below).6.5 Human whole blood and blood serum
The hair, nail and red blood cell studies discussed above were largely designed to explore the potential for the δ13C value in tissues to reflect the δ13C value of whole diet, with special attention to dietary protein. Indeed, most of the carbon within these substrates is in the form of various proteins, and the direct incorporation of digested amino acids into such tissues via protein synthesis (Fig. 6L) is a straightforward model for biomarker interpretation. However, substrates derived from dietary carbohydrates are also converted to non-essential amino acids and incorporated into proteins. These carbohydrate-derived amino acids represent a significant proportion of the total amino acid pool. The carbon in whole blood is dominated by proteins (e.g. albumin, immunoglobulins, hemoglobin). Nonetheless, blood is an extremely attractive substrate because it is universally collected and archived; the American Red Cross and the American Association of Blood Banks alone collect and process more than 7 million liters of blood each year.167 Whole blood may be cheaply and quickly processed to exclude certain proteins before archival: after collection whole blood is often separated into fractions via centrifugation, which promotes a clot largely composed of RBC and WBC. The supernatant, known as “plasma” if the clotting factors (fibrinogen) are retained and “serum” if they are removed, is largely composed of the proteins albumin and globulin. If the conspicuously high δ13C value of most AS relative to other carbohydrates were observable within the blood collected from subjects with high AS intakes, a widely-applicable biomarker of great clinical and public health value might be developed.Kraft et al.125 represents the largest-scale study of stable isotopes in human blood, which reported the δ13C value of 406 anonymous subjects with unknown dietary habits (e.g., potentially non-fasting) in order to quantify the isotopic variability in a free-living population (Table 6).
| δ 13C [‰] dataset | Male n = 201 | Female n = 205 | Total n = 406 |
|---|---|---|---|
| Mean | −19.0 | −19.3 | −19.1 |
| Maximum | −16.3 | −15.8 | −15.8 |
| Minimum | −21.2 | −23.2 | −23.2 |
| SD | 0.8 | 0.8 | 0.8 |
| Range | 4.9 | 7.4 | 7.4 |
The total range in the δ13C value of both clot and serum was observed to span the range in δ13C value seen across C3 and C4 plant-derived sweeteners (Fig. 4). No enrichment in δ13C value was observed between clot and serum. Population histograms for δ13C values in blood revealed normal distributions for both males and females, with mean values for both close to −19‰. The study also showed no isotopic difference between capillary blood and venous blood, obtained from 24 fasting individuals. Finally, the study confirmed that common processing techniques such as the addition of blood additives (i.e., sodium fluoride and polymerized acrylamide resin), sample handling (i.e., autoclaving and freeze drying) and refrigerated storage up to 115 days do not alter the original δ13C value of blood samples.
To date, two studies have evaluated the association between AS intake in the form of sugar-sweetened beverages (SSB) and the δ13C value of whole blood. Yeung et al.126 conducted a cross-sectional study within the ARIC trial of 186 adults, comparing FFQ data to serum δ13C value (Table 7).
| Sweetened beverage consumption | Serum δ13C [‰] |
|---|---|
| a δ 13C value was significantly lower for those consuming sweetened beverages infrequently (≤1 per week) compared with those consuming such beverages at a high frequency (≥5 per week, P = 0.004 by t-test of difference). | |
| ≤1 per week | −19.47a |
| 2–4 per week | −19.35 |
| ≥5 per week | −19.15a |
Mean serum δ13C value was significantly lower for those consuming SSB infrequently (≤1 per week) compared with those consuming such beverages at a high frequency (≥5 per week), even after statistical adjustment for questionnaire-reported animal fat and “whole corn” (e.g., tortillas) consumption. A second trial, conducted by Davy et al.,118 employed the non-invasive fingerstick sampling technique in order to evaluate the association between the δ13C value of whole blood and AS intake (Table 8). The study found that the δ13C value of fingerstick blood was associated (p < 0.05) with both AS intake and total SSB intake. These findings suggest that the δ13C value of human blood, which is commonly collected in many clinical and epidemiological studies, is a promising biomarker for AS and SSB intake, with the time frame of dietary exposure reflected likely being medium-term (weeks/months).
| Characteristics | Low SSB consumptiona,b (98 ± 16 kcal) | High SSB consumptiona,b (236 ± 63 kcal) |
|---|---|---|
| a Determined by Beverage Intake Questionnaire (BEVQ; ref. 168). b Mean ± SEM (standard error of the mean). c Body mass index. | ||
Male![[thin space (1/6-em)]](https://www.rsc.org/images/entities/char_2009.gif) :female (n:n) :female (n:n) |
8:12 |
10:10 |
| Age (mean ± SEM) | 47.8 ± 4.1 years | 38.1 ± 3.8 years |
| BMIc (mean ± SEM) | 26.4 ± 0.9 kg m−2 | 29.1 ± 2.5 kg m−2 |
| Fingerstick blood δ13C value (mean ± SEM) | −20.06 ± 0.17‰ | −19.59 ± 0.13‰ |
7. Specific-compound approaches
The studies discussed directly above imply that, while the conspicuously high δ13C value of AS may be observable within the protein-dense portions of blood as it is commonly collected and processed (e.g., centrifuged serum fraction, fingerstick blot), differences in AS consumption can only be demonstrated at present between very high- and low-end consumers.118,126 An ideal biomarker of AS would permit the sensitive determination of AS intake across a continuum of consumption levels, allowing for the establishment of correlations between AS intake, health outcomes and/or chronic disease risk. Towards this, new studies have attempted to isolate specific compounds in blood that are more likely to be derived from dietary carbohydrates, such as direct endogenous carbohydrate sources and specific non-essential amino acids.7.1 Specific compound: blood glucose
Direct measurement of glucose in the blood is an attractive potential substrate for an isotope-based biomarker of AS intake, as it is an obvious and important destination for dietary carbohydrate. In addition, blood glucose concentration is a routinely monitored index of health, a myriad of methods exist for measurement,169 and blood-glucose dynamics have been exhaustively studied.170 Blood glucose originates from three sources: dietary glucose which bypasses the liver (Fig. 6A), glycogenolysis of glycogen stored in the muscle and liver tissue (Fig. 6D), or certain non-carbohydrate precursors via gluconeogenesis (Fig. 6I). Gluconeogenesis may be of primary importance only during long-term fasting, as experiments using 13C-labeled amino acids indicated that non-carbohydrates sources did not constitute a major source of blood glucose after an overnight fast.171 Recent measurements comparing the δ13C value of serum glucose (isolated via liquid chromatography) to the bulk δ13C value of the same serum sample revealed a large amount of unexplained variation between the substrates (R2 = 0.52; Fig. 9), which supports the heterogeneous origin of the various blood components.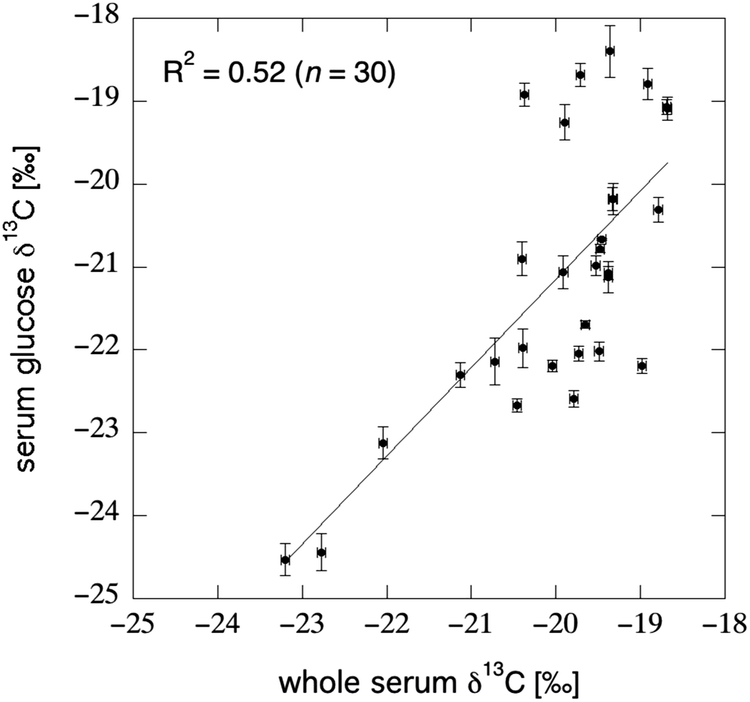 | ||
| Fig. 9 Correlation between the bulk δ13C value of serum and the δ13C value of serum glucose as isolated via liquid-chromatography IRMS; “error bars” reflect the standard deviation seen across 3–6 replicate measurements (Jahren unpublished data). Subjects were 30 middle aged and older U.S. adults enrolled in a water-weight loss study.172 The lack of correlation between the two datasets suggests a heterogeneous origin for the carbon within different blood components. | ||
Cook et al.116 specifically tested the potential of plasma glucose as a biomarker of AS consumption: in their crossover study, subjects consumed 3 weight-maintaining diets with varying amount of carbohydrates derived from cane sugar and HFCS (5, 16, and 32% of total carbohydrates per day). Each diet lasted for 7 days, and all meals were provided to the participants; fasting blood was drawn in the morning, and non-fasting blood was drawn in the afternoon on days 1–6 and at 2 hour intervals throughout day 7. Significant differences were not detected between the δ13C values of plasma glucose in fasting subjects, regardless of diet. However, strong positive correlations were observed between the C4-sugar content of breakfast and the δ13C value of post-breakfast (10 a.m.) blood glucose (R2 = 0.89) and between total daily C4-sugar content of diet and the δ13C value of afternoon blood glucose on days 1–6 (R2 = 0.90). Based on a regression of their data against pure-C3 to pure-C4 carbon end-members, Cook et al.116 contended that almost all of the carbon in blood glucose was derived from dietary carbohydrate sources immediately after a meal, while only two-thirds of blood glucose sampled later in the day was derived from carbohydrates. These claims agree with prior metabolic tracer studies demonstrating the gradual shift from use of carbohydrates in the meal to the use of liver glycogen and gluconeogenesis to maintain blood glucose levels.173,174 The lack of significant differences between the δ13C value of fasting plasma glucose in subjects consuming different diets is somewhat surprising, as dietary carbohydrates would be expected to contribute to liver glycogen stores during the fed state (Fig. 6C), followed by release of these stores during the overnight fast (Fig. 6D). In contrast, it appears that a majority of blood glucose in these fasted individuals was derived from non-carbohydrate sources via gluconeogenesis (Fig. 6I). The relatively small concentration of glucose in blood (≈0.8 mg mL−1) and the immense complexity and individual variability in blood glucose homeostasis175 must be considered when interpreting isotope results in relation to the contribution of gluconeogenesis in the fasted state. Serum glucose δ13C value may be the best biomarker of acute sugar consumption (i.e., a recent meal); however, dietary recall or direct observation are non-invasive methods commonly used for such purposes.
7.2 Specific compound: RBC alanine
Non-essential amino acids (NEAAs) may be synthesized from the intermediates of carbohydrate metabolism in a variety of tissues. Certain NEAAs, particularly alanine, are more likely to be derived from dietary carbohydrates. The higher proportion of blood alanine derived from carbohydrate is due to its role in the glucose–alanine cycle in which pyruvate, the product of anaerobic glucose metabolism, is transaminated to form alanine. This alanine is subsequently returned to the liver via the bloodstream, where the carbon skeleton can be used to produce new glucose via gluconeogenesis (Fig. 6A).176,177 Based on this, Choy et al.117 hypothesized that the δ13C value of alanine isolated from RBC might be a more sensitive biomarker of AS intake than the δ13C value of bulk RBC.178 Utilizing RBC samples from a dual-isotope trial,145 researchers measured the carbon isotope composition of NEAAs likely to be derived from glucose (alanine, glycine, serine, proline, aspartate/asparagine, and glutamate/glutamine) via gas chromatography IRMS to determine associations between NEAA δ13C values and dietary intake data gathered via four 24 h dietary recalls spread over 4 weeks. Of the amino acids tested, only alanine (CH3CH(NH2)COOH) was significantly correlated (r = 0.59, p < 0.0001) with AS intake, and particularly with SSB intake (r = 0.70, p < 0.0001). Moreover, alanine δ13C value was not associated with any form of animal protein intake, including commercial meat. While RBC alanine is a promising biomarker of AS intake, alanine may be derived from two sources: from the combination of glucose and a nitrogen source within the liver (Fig. 6N) or from the direct digestion of animal (e.g., meat, seafood, eggs, gelatin) and plant (e.g., beans, nuts, soy, corn, rice) proteins (Fig. 6A). The pathway most used will depend upon the nitrogen balance and carbohydrate intake of the individual: states of negative nitrogen balance (i.e., low protein intake or starvation) and/or high carbohydrate intake will result in a greater proportion of non-essential amino acids derived from carbohydrates compared to states of positive nitrogen balance and/or low carbohydrate intake.179,180 While most Americans consume adequate levels of dietary protein to remain in nitrogen balance equilibrium,181 the continuum of carbohydrate and protein consumption may produce inter- and intra-individual differences in biomarker sensitivity to SSB intake. Thus, while RBC alanine is a promising candidate biomarker of SSB consumption, further testing in a more heterogenous population with a broad range of carbohydrate and protein intake is need to determine its applicability to the general population.7.3 Specific compound: hemoglobin A1c
The ideal biomarker for AS intake is sensitive to dietary carbohydrate intake but not susceptible to acute fluctuations due to meal-to-meal, or day-to-day changes in dietary intake; it would also be a long-lived bodily substance that is primary derived from ingested carbohydrates. Hemoglobin A1c analysis may meet all of these requirements. Hemoglobin, which comprises 90% of the mass of RBC, is the protein that permits the inter-tissue transport of oxygen. Hemoglobin A1c (“Hb A1c”; also knows as “glycated hemoglobin”) is hemoglobin with a glucose molecule covalently bound to the N-terminal valine of the beta chain. This bound glucose serves no role in the function of hemoglobin; however, a useful relationship between glycated hemoglobins and diabetes was first recognized in 1971.182 Later studies established that the formation of Hb A1c occured through non-enzymatic “glycation” at a slow constant rate that was directly proportional to the concentration of glucose in blood.183 Because the average lifespan of hemoglobin is about 12 weeks, determination of Hb A1c/total Hb ratio is the gold standard of long-term blood glucose control in the clinical setting.184 An advantage of Hb A1c over traditional blood glucose measurements as a potential isotopic biomarker is its relative unresponsiveness to recent feeding status or to acute changes in blood glucose concentration. Because the concentration of Hb A1c slowly increases within an RBC over the course of its lifespan, measurement of Hb A1c concentration allows for the calculation of the average blood glucose concentration over ∼3 month period.185 The same advantages that Hb A1c confers to the assessment of blood glucose concentration should theoretically apply to the measurement of the isotopic composition of blood glucose, i.e., Hb A1c may hold the key to determining the average isotopic composition of dietary carbohydrates over a long period of time, provided the associated analytical challenges can be overcome.The glucose moiety makes up only a very small proportion of the total carbon present in Hb A1c; therefore, isolation and concentration of glucose would be necessary prior to the determination of δ13C value. The recently-discovered enzyme Fructosyl Amino Acid Oxidase (FAOD) can be used to break the glycolytic bond in Hb A1c, resulting in the products glucosone (C6H10O6), valine (HO2CCH(NH2)CH(CH3)20), and hydrogen peroxide (H2O2).186 The FAOD method has recently been applied to Hb A1c analysis through the colorimetric determination of hydrogen peroxide production, and many commercial test kits are now available.187,188 In developing a protocol for the isolation and carbon-isotope analysis of glucose derived from Hb A1c, modifications to protocols currently used in commercial FAOD kits will be required, as they indirectly measure Hb A1c via an assay of the hydrogen peroxide product. Because the product of interest for δ13C analysis is glucosone, free blood glucose must be removed from the sample prior to the FAOD reaction step in order to minimize interference. Furthermore, because FAOD cannot react with intact Hb A1c, a proteolytic digestion step is required to liberate glycated amino acids.186 FAOD can then be introduced to break the glycolytic bonds, and the glucosone product may be isolated via liquid or gas chromatography for subsequent δ13C analysis. Provided that isolation and isotopic analysis of the bound glucose is successful, Hb A1c could offer a potential biomarker of long-term AS consumption that warrants validation in clinical trials.
8. The carbon isotope composition of meat as a confounding variable
Corn and cane sugar, and thus a large proportion of AS (Fig. 5), figure prominently in the typical American diet; however, they are not on the only dietary sources which possess conspicuously high δ13C values. The U.S. typically produces 64 billion dollars worth of Zea mays each year, and corn is the primary feed supplied to milk and meat animals.189 The δ13C value of corn-based silage and meal ranges from −14 to −11‰,190 in close agreement with corn-based foods available to humans (Table 3). Somewhat ironically, Americans may even consume beef that has been fed upon foods extremely high in AS and particularly in HFCS: in 2012 it was widely-reported that drought-induced corn shortages rendered it cheaper for feedlot operators and dairy producers to feed “co-products” consisting of hard and soft candies (e.g., marshmallows).191Meat products reflect the isotopic composition of the feed supplied to the animal via the same mechanisms implicated within the earliest dietary isotope studies on laboratory animals.19 As a result, an analysis of the δ13C value in meat is commonly used to authenticate claims of “free ranging” and/or “grass-fed” animal protein.192–195 Widely-consumed and cheaply available sources of meat are likely to have a corn-fed carbon isotopic signature, as shown in the analysis of meat from more than 300 hamburgers (Fig. 10) (mean δ13C value = −18.0‰; n = 162) and chicken sandwiches (mean δ13C value = −17.5‰; n = 161) from fast-food distributors across the continental United States.196 In addition, fried convenience foods are often cooked in corn oil197 that retains the δ13C value of the plant from which it has been extracted.198 It follows from the above, that any heterogeneous human tissue sampled (e.g., whole blood) may have been synthesized from carbon with δ13C value = −18 to −11‰ (the range associated with most AS) that was not contributed to the diet as carbohydrate, but was instead contributed as meat or associated fat. This may be particularly true for tissues comprised mainly of amino acids such as hair, nail, RBCs, and whole blood (Fig. 6L).
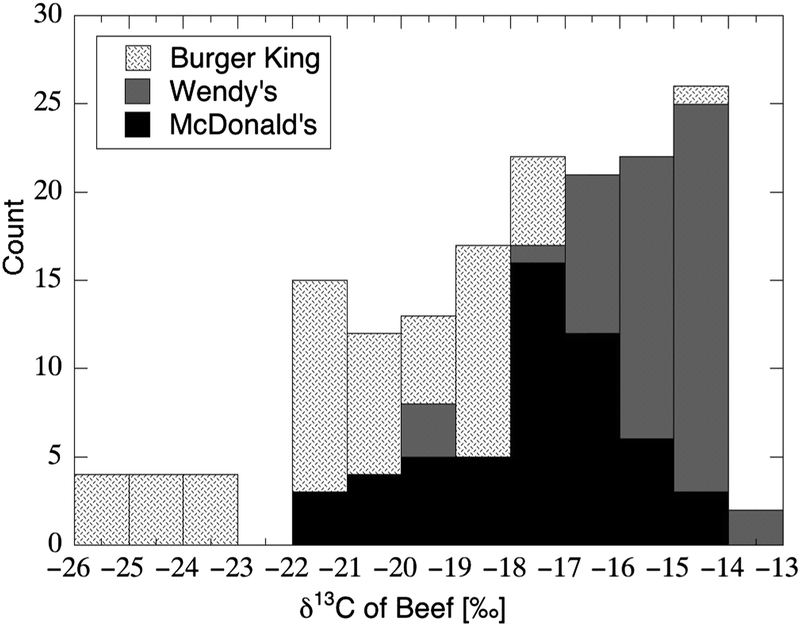 | ||
| Fig. 10 Distribution in δ13C values of beef sampled from 161 hamburgers purchased at fast-food restaurants throughout the continental United States (ref. 196) According to the values for muscle and lipid published in Bahar et al.,193 beef with δ13C > −19.5‰ implied a “final diet of corn silage”; 71% of the burgers sampled met this particular criterion. | ||
The potential of meat consumption to confound any C4-carbohydrate carbon isotope signal within human tissues has been recognized; a positive correlation between δ13C values in human tissues and δ13C values of dietary protein has been reported by several studies.106,107,148,149 Nonetheless, the association between the δ13C value of human blood and AS intake has persisted in serum126 even after adjustment for meat intake. Considered practically, the continuous flow system that converts carbon to CO2 also converts nitrogen to N2, which are then separated prior to entering the mass spectrometer within a flow of helium.199,200 Thus the isotopic analysis of both carbon and nitrogen on a single sample is possible given the system's ability to reliably switch tuning parameters within a short time frame. Partially because of this, many (if not most) of the carbon isotope studies discussed above also reported the δ15N value of substrates analyzed. Nash et al.145 first formally suggested the use the nitrogen stable isotope composition (i.e., 15N/14N expressed as δ15N [‰]) of human tissues in order to produce a “correction factor” for animal protein consumption and increase biomarker sensitivity for carbohydrate intake. Such an approach is based on the long-standing observation that 15N is concentrated with each increase in trophic level.201 The exact mechanism for the concentration of 15N with trophic level remains uncertain, but may be related to absolute nitrogen intake in a mechanism akin to bioaccumulation.202 Based on this principle, δ15N has been used to delineate the ecological niche of species,203 as well to determine the relative proportion of plant versus animal protein in ancient human diets.204 Petzke et al.155 presented δ13C and δ15N data from the hair of individuals self-reported as omnivores (n = 99), ovo-lacto vegetarians (n = 15) and vegans (n = 6), and showed that the δ15N value of omnivores was enriched by ≈+2‰ relative to ovo-lacto vegetarians, which in turn was enriched by ≈+1.5‰ relative to vegans. The total ranges in both the δ13C values and the δ15N values of blood serum in the large population reported by Kraft et al.125 were observed to span the ranges in δ13C and δ15N values established by Petzke et al.155 for omnivores and ovo-lacto vegetarians (Fig. 11).
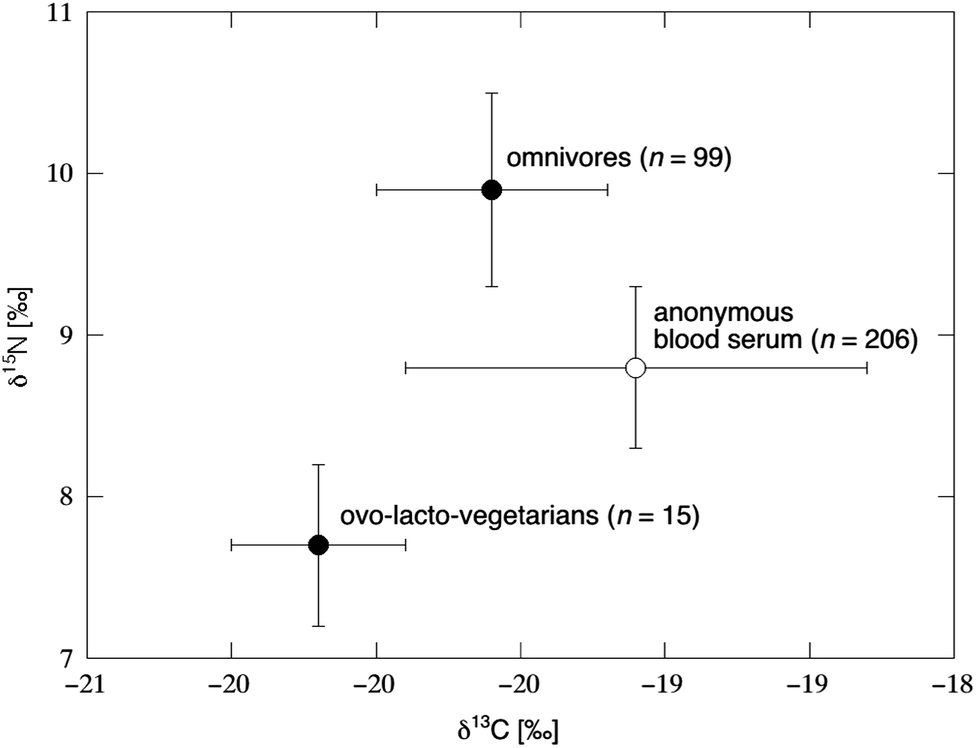 | ||
| Fig. 11 The stable carbon and nitrogen isotope composition of human hair (closed circles) and blood serum (open circle); “error bars” reflect the standard deviation associated with n individuals tested. Hair samples were contributed by self-identified omnivores and ovo-lacto-vegetarians in Germany (ref. 155); blood serum was contributed by 101 male and 105 female anonymous patients at the Johns Hopkins Medical Institutions (ref. 125). | ||
Nash et al.'s166 assessment of traditional versus market food intake within a Native Alaskan population revealed a moderate association between the δ15N value of RBCs and intake of aquatic animals (r = 0.52). Based upon this association, this group sought to increase the validity of RBC δ13C value as a biomarker of SSB intake through the use of RBC δ15N value to control for marine food intake.145 This dual isotope model notably improved the amount of variation in AS consumption that was explained by δ13C value (R2 = 0.33), when compared to using δ13C value alone (R2 = 0.03). Using this dual isotope model to estimate total added sugar intake in a larger Yup'ik population, this group found positive correlations between AS intake and several markers of metabolic syndrome, demonstrating the potential utility of a stable-isotope biomarker in clinical trials aimed at assessing the effects of AS intake on long-term health.205 We note, however, that δ15N values were not associated with commercial meat intake in the original model. This was likely due to the proportionally large intake of marine animals relative to commercial meats in the study population, as marine animals are more enriched in δ15N value than their terrestrial counterparts.206 In addition, the δ15N value of terrestrial meat animals is variable: Huelsemann et al.207 reported that beef, pork and chicken varied by more than 3.0‰ across a dataset of twenty-two samples. Furthermore, tissue δ15N values may be affected by other physiological conditions, including caloric availability, total protein content of the diet, and pathological conditions such as liver disease.180 Thus, further testing in the general U.S. population is warranted to determine the relationship between tissue δ15N and commercial meat intake and validate the dual isotope model as a strategy for increasing the sensitivity of δ13C-based biomarkers.
9. Special considerations: institutional review board approval
Developing solutions to many of today's societal challenges, particularly those in the realm of public health,208 requires the collaboration of scientists from different disciplines who may not have worked together historically. The research area addressed by this review encompasses fields of geochemistry, nutritional science, food science, physiology, metabolism and biochemistry; collaborators with expertise in epidemiology and statistics may also be needed. Interdisciplinary research teams have the potential to achieve scientific innovations and advances which are not possible to achieve working as a lone investigator in a single discipline,208,209 although the challenges facing interdisciplinary research teams can be significant. One critical example is the Institutional Review Board (IRB) approval process required before any study involving interventions or interactions with living human subjects can be performed. Although only about half of all English-language biomedical journals require proof of IRB-approval prior to publication,210 articles may be formally retracted if IRB-approval cannot be verified. For example, the British Journal of Anaesthesia states categorically that “Lack of IRB approval means that the research was unethical” within its retraction policy.211 This requirement exists for any sampling of human tissue for analysis within a research or teaching setting, no matter how informal. Most research institutions exert punitive measures against researchers found to be in violation of IRB, including a prohibition of supervising or advising research. Of particular concern are informal experiments associated with curriculum: if students feel that their grade in a course is contingent upon providing a tissue sample for analysis, this constitutes “undue pressure to enroll” which most institutions view as a serious ethics violation (e.g., Johns Hopkins IRB Student Recruitment Policy).212 Each major research institution has its own IRB comprised of a committee of volunteers including scientists, non-scientists, community members, and health care professionals. The Board's mission is to ensure research protocols involving human subjects are ethical and that the rights of participants are protected. Prior to initiating any human research studies, the IRB will review all study documents, including the protocol, informed consent document, forms or questionnaires used for data collection, and recruitment advertisements. The IRB insures that human subjects are fully informed of all risks and benefits of participating in the study, and provides significant protection to the researcher once the results of the study come under scrutiny for publication. In addition, the study investigators and research staff performing the types of isotope experiments described above are likely required to have certified training in the protection of human subjects and in the handling of biohazards. For studies involving blood this might be obvious, but to a scientist unfamiliar with human subject research this requirement could pose a significant barrier to initiating research with human subjects. Prior to the initiation of any work, investigators are urged to contact their IRB office, and learn the specifics of what their institution requires.10. Conclusions
There is an urgent need for new techniques to directly evaluate the effects of added sugars on human health. Global sugar consumption is increasing rapidly, particularly with respect to fructose (e.g., as high fructose corn syrup), which now comprises more than one-third of all sugar in the American diet.43 Adverse outcomes ranging from major depression213 to breast cancer214,215 to antisocial behavior216 have been postulated to be related to added sugar consumption. At present, there are no definitive objective biomarkers of medium- or long-term added sugar intake in clinical use. Because of this urgency, even moderate correlations between the δ13C value of a given tissue and dietary added sugar intake make the tissue in question a valid substrate for further exploration. Despite the myriad of metabolic transformations that preclude a simple relationship between the isotope composition of carbohydrates that enter the digestive system and the isotope composition of human tissues available for assay, early clinical data exploiting the conspicuous δ13C value associated with corn- and cane-derived added sugar describes a highly promising potential biomarker of added sugar intake. Continued research into alternative tissue substrates and analytical processes aimed at mitigating interference by confounding variables is warranted to increase the applicability of a carbon stable isotope biomarker in large clinical and epidemiological trials.Acknowledgements
This work is dedicated to the late Christopher Dyer Saudek, M.D., founder and director of the Johns Hopkins Comprehensive Diabetes Center. We are grateful to have benefitted from his encouragement, and continue to be inspired by his memory.Notes and references
- J. Frazer, Mikrochim. Acta, 1962, 50, 993–999 CrossRef.
- J. T. Brenna, T. N. Corso, H. J. Tobias and R. J. Caimi, Mass Spectrom. Rev., 1997, 16, 227–258 CrossRef CAS.
- L. A. Cernusak, N. Ubierna, K. Winter, J. A. Holtum, J. D. Marshall and G. D. Farquhar, New Phytol., 2013, 950–965 CrossRef CAS PubMed.
- K. A. Hobson, Oecologia, 1999, 120, 314–326 CrossRef.
- P. Högberg, A. H. Plamboeck, A. F. S. Taylor and P. M. A. Fransson, Proc. Natl. Acad. Sci. U. S. A., 1999, 96, 8534–8539 CrossRef.
- B. A. Schubert and A. H. Jahren, Geochim. Cosmochim. Acta, 2012, 96, 29–43 CrossRef CAS PubMed.
- E. Brugnoli, K. T. Hubick, S. von Caemmerer, S. C. Wong and G. D. Farquhar, Plant Physiol., 1988, 88, 1418–1424 CrossRef CAS PubMed.
- M. R. Henn, G. Gleixner and I. H. Chapela, Appl. Environ. Microbiol., 2002, 68, 4956–4964 CrossRef CAS.
- J. H. McCutchan, W. M. Lewis, C. Kendall and C. C. McGrath, Oikos, 2003, 102, 378–390 CrossRef CAS.
- J. F. Kelly, Can. J. Zool., 2000, 78, 1–27 CrossRef PubMed.
- S. D. Newsome, P. L. Koch, M. A. Etnier and D. Aurioles-Gamboa, Mar. Mammal Sci., 2006, 22, 556–572 CrossRef.
- G. Tcherkez and G. D. Farquhar, Funct. Plant Biol., 2005, 32, 277–291 CrossRef CAS.
- D. E. Butz, S. L. Casperson and L. D. Whigham, J. Anal. At. Spectrom., 2014, Advance article Search PubMed.
- L. D. Whigham, D. E. Butz, L. K. Johnson, D. A. Schoeller, D. H. Abbott, W. P. Porter and M. E. Cook, Int. J. Obes., 2014, Epub ahead of print Search PubMed.
- J. P. Boriosi, D. G. Maki, R. A. Yngsdal-Krenz, E. R. Wald, W. P. Porter, M. E. Cook and D. E. Butz, J. Anal. At. Spectrom., 2014, Advance article Search PubMed.
- D. E. Butz, S. L. Morello, J. Sand, G. N. Holland and M. E. Cook, J. Anal. At. Spectrom., 2014, Advance article Search PubMed.
- J.-P. Godin, A. B. Ross, M. Cléroux, E. Pouteau, I. Montoliu, M. Moser and S. Kochhar, PLoS One, 2013, 8, e74866 CAS.
- N. C. Arens, A. Hope Jahren and R. Amundson, Paleobiology, 2000, 26, 137–164 CrossRef.
- M. J. DeNiro and S. Epstein, Geochim. Cosmochim. Acta, 1978, 42, 495–506 CrossRef CAS.
- O. Schmidt, J. P. Curry, J. Dyckmans, E. Rota and C. M. Scrimgeour, Pedobiologia, 2004, 48, 171–180 CrossRef PubMed.
- B. Gu, C. L. Schelske and M. V. Hoyer, J. Fish Biol., 1996, 49, 1233–1243 CrossRef CAS.
- U. Struck, A. V. Altenbach, M. Gaulke and F. Glaw, Naturwissenschaften, 2002, 89, 470–473 CrossRef CAS PubMed.
- K. A. Hobson and R. G. Clark, Condor, 1992, 94, 189–197 CrossRef.
- M. Ben-David, R. W. Flynn and D. M. Schell, Oecologia, 1997, 111, 280–291 CrossRef.
- M. J. Schoeninger, J. Moore and J. M. Sept, Am. J. Primatol., 1999, 49, 297–314 CrossRef CAS.
- J. Lee-Thorp, J. F. Thackeray and N. van der Merwe, J. Hum. Evol., 2000, 39, 565–576 CrossRef CAS PubMed.
- R. G. Klein, Proc. Natl. Acad. Sci. U. S. A., 2013, 110, 10470–10472 CrossRef CAS PubMed.
- M. Sponheimer, Z. Alemseged, T. E. Cerling, F. E. Grine, W. H. Kimbel, M. G. Leakey, J. A. Lee-Thorp, F. K. Manthi, K. E. Reed, B. A. Wood and J. G. Wynn, Proc. Natl. Acad. Sci. U. S. A., 2013, 110, 10513–10518 CrossRef CAS.
- H. Bocherens, M. Mashkour, D. G. Drucker, I. Moussa and D. Billiou, J. Archaeol. Sci., 2006, 33, 253–264 CrossRef PubMed.
- H. P. Schwarcz and M. J. Schoeninger, Am. J. Phys. Anthropol., 1991, 34, 283–321 CrossRef.
- S. H. Ambrose, J. Archaeol. Sci., 1990, 17, 431–451 CrossRef.
- A. M. Katzenberg, Advances in stable isotope analysis of prehistoric bones, Wiley-Liss, New York, 1992 Search PubMed.
- M. Balasse, International Journal of Osteoarchaeology, 2002, 12, 155–165 CrossRef.
- Y. Wang, T. E. Cerling and B. J. MacFadden, Palaeogeogr., Palaeoclimatol., Palaeoecol., 1994, 107, 269–279 CrossRef.
- S. Jim, S. H. Ambrose and R. P. Evershed, Geochim. Cosmochim. Acta, 2004, 68, 61–72 CrossRef CAS.
- A. H. Jahren, C. Saudek, E. H. Yeung, W. H. Kao, R. A. Kraft and B. Caballero, Am. J. Clin. Nutr., 2006, 84, 1380–1384 CAS.
- S. N. Heller and L. R. Hackler, Am. J. Clin. Nutr., 1978, 31, 1510–1514 CAS.
- F. Stellaard and H. Elzinga, Isot. Environ. Health Stud., 2005, 41, 345–361 CrossRef CAS PubMed.
- B. Fry, W. Brand, F. J. Mersch, K. Tholke and R. Garritt, Anal. Chem., 1992, 64, 288–291 CrossRef CAS.
- L. M. Hanover and J. S. White, Am. J. Clin. Nutr., 1993, 58, 724S–732S CAS.
- S. Chiba, Biosci., Biotechnol., Biochem., 1997, 61, 1233–1239 CrossRef CAS.
- S. H. Bhosale, M. B. Rao and V. V. Deshpande, Microbiol. Rev., 1996, 60, 280–300 CAS.
- J. P. Bantle, S. K. Raatz, W. Thomas and A. Georgopoulos, Am. J. Clin. Nutr., 2000, 72, 1128–1134 CAS.
- G. F. Cahill, Jr, Annu. Rev. Nutr., 2006, 26, 1–22 CrossRef PubMed.
- O. E. Owen, A. P. Morgan, H. G. Kemp, J. M. Sullivan, M. G. Herrera and G. F. Cahill, Jr, J. Clin. Invest., 1967, 46, 1589–1595 CrossRef CAS PubMed.
- R. G. Spiro, Glycobiology, 2002, 12, 43R–56R CrossRef CAS PubMed.
- Dietary Reference Intakes for Energy, Carbohydrate, Fiber, Fat, Fatty Acids, Cholesterol, Protein, and Amino Acids (Macronutrients), The National Academies Press, 2005 Search PubMed.
- A. Sparti, H. Milon, V. Di Vetta, P. Schneiter, L. Tappy, E. Jequier and Y. Schutz, Am. J. Clin. Nutr., 2000, 72, 1461–1468 CAS.
- A. K. Kant, Am. J. Clin. Nutr., 2000, 72, 929–936 CAS.
- R. K. Johnson and B. A. Yon, J. Am. Diet. Assoc., 2010, 110, 1296–1299 CrossRef PubMed.
- B. P. Marriott, L. Olsho, L. Hadden and P. Connor, Crit. Rev. Food Sci. Nutr., 2010, 50, 228–258 CrossRef CAS PubMed.
- P. J. Huth, V. L. Fulgoni, 3rd, D. R. Keast, K. Park and N. Auestad, Nutr. J., 2013, 12, 116 CrossRef CAS PubMed.
- S. M. Krebs-Smith, P. M. Guenther, A. F. Subar, S. I. Kirkpatrick and K. W. Dodd, J. Nutr., 2010, 140, 1832–1838 CrossRef CAS PubMed.
- R. K. Johnson, L. J. Appel, M. Brands, B. V. Howard, M. Lefevre, R. H. Lustig, F. Sacks, L. M. Steffen and J. Wylie-Rosett, P. A. American Heart Association Nutrition Committee of the Council on Nutrition, Metabolism, E. the Council on and Prevention, Circulation, 2009, 120, 1011–1020 CrossRef CAS PubMed.
- I. J. Brown, J. Stamler, L. Van Horn, C. E. Robertson, Q. Chan, A. R. Dyer, C. C. Huang, B. L. Rodriguez, L. Zhao, M. L. Daviglus, H. Ueshima and P. Elliott, M. M. International Study of and G. Blood Pressure Research, Hypertension, 2011, 57, 695–701 CrossRef CAS PubMed.
- K. L. Stanhope, J. M. Schwarz, N. L. Keim, S. C. Griffen, A. A. Bremer, J. L. Graham, B. Hatcher, C. L. Cox, A. Dyachenko, W. Zhang, J. P. McGahan, A. Seibert, R. M. Krauss, S. Chiu, E. J. Schaefer, M. Ai, S. Otokozawa, K. Nakajima, T. Nakano, C. Beysen, M. K. Hellerstein, L. Berglund and P. J. Havel, J. Clin. Invest., 2009, 119, 1322–1334 CAS.
- K. L. Teff, J. Grudziak, R. R. Townsend, T. N. Dunn, R. W. Grant, S. H. Adams, N. L. Keim, B. P. Cummings, K. L. Stanhope and P. J. Havel, J. Clin. Endocrinol. Metab., 2009, 94, 1562–1569 CrossRef CAS PubMed.
- K. L. Stanhope, A. A. Bremer, V. Medici, K. Nakajima, Y. Ito, T. Nakano, G. Chen, T. H. Fong, V. Lee, R. I. Menorca, N. L. Keim and P. J. Havel, J. Clin. Endocrinol. Metab., 2011, 96, E1596–E1605 CrossRef CAS PubMed.
- M. Maersk, A. Belza, H. Stodkilde-Jorgensen, S. Ringgaard, E. Chabanova, H. Thomsen, S. B. Pedersen, A. Astrup and B. Richelsen, Am. J. Clin. Nutr., 2012, 95, 283–289 CrossRef CAS PubMed.
- I. Aeberli, P. A. Gerber, M. Hochuli, S. Kohler, S. R. Haile, I. Gouni-Berthold, H. K. Berthold, G. A. Spinas and K. Berneis, Am. J. Clin. Nutr., 2011, 94, 479–485 CrossRef CAS PubMed.
- C. L. Cox, K. L. Stanhope, J. M. Schwarz, J. L. Graham, B. Hatcher, S. C. Griffen, A. A. Bremer, L. Berglund, J. P. McGahan, N. L. Keim and P. J. Havel, J. Clin. Endocrinol. Metab., 2011, 96, E2034–E2038 CrossRef CAS PubMed.
- F. B. Hu and V. S. Malik, Physiol. Behav., 2010, 100, 47–54 CrossRef CAS PubMed.
- V. S. Malik, B. M. Popkin, G. A. Bray, J. P. Despres and F. B. Hu, Circulation, 2010, 121, 1356–1364 CrossRef PubMed.
- L. de Koning, V. S. Malik, M. D. Kellogg, E. B. Rimm, W. C. Willett and F. B. Hu, Circulation, 2012, 125, 1735–1741 CrossRef CAS PubMed.
- V. S. Malik, B. M. Popkin, G. A. Bray, J. P. Despres, W. C. Willett and F. B. Hu, Diabetes Care, 2010, 33, 2477–2483 CrossRef PubMed.
- D. B. Allison and R. D. Mattes, JAMA, J. Am. Med. Assoc., 2009, 301, 318–320 CrossRef CAS PubMed.
- K. D. Brownell, T. Farley, W. C. Willett, B. M. Popkin, F. J. Chaloupka, J. W. Thompson and D. S. Ludwig, N. Engl. J. Med., 2009, 361, 1599–1605 CrossRef CAS PubMed.
- V. S. Malik and F. B. Hu, Am. J. Clin. Nutr., 2011, 94, 1161–1162 CrossRef CAS PubMed.
- D. L. Weed, M. D. Althuis and P. J. Mink, Am. J. Clin. Nutr., 2011, 94, 1340–1347 CrossRef CAS PubMed.
- M. D. Huffman, Circulation, 2012, 125, 1718–1720 CrossRef PubMed.
- J. Slavin, Nutr. Rev., 2012, 70(suppl. 2), S111–S120 CrossRef PubMed.
- R. C. Cottrell, BMJ, 2013, 346 Search PubMed.
- W. C. Willett and D. S. Ludwig, BMJ, 2013, 346, e8077 CrossRef PubMed.
- L. J. Schieb, S. A. Greer, M. D. Ritchey, M. G. George and M. L. Casper, Morbidity and Mortality Weekly Report, 2013, 62, p. 721–727 Search PubMed.
- S. L. Murphy, L. Xu and K. D. Kochanek, Deaths: Final Data for 2010, CDC National Vital Statistics Reports, 2013 Search PubMed.
- F. E. Thompson, A. F. Subar, C. M. Loria, J. L. Reedy and T. Baranowski, J. Am. Diet. Assoc., 2010, 110, 48–51 CrossRef PubMed.
- E. C. Kosova, P. Auinger and A. A. Bremer, J. Acad. Nutr. Diet., 2013, 113, 219–227 CrossRef PubMed.
- G. G. Kuhnle, J. Sci. Food Agric., 2012, 92, 1145–1149 CrossRef CAS PubMed.
- S. Bingham, R. Luben, A. Welch, N. Tasevska, N. Wareham and K. T. Khaw, Cancer Epidemiol., Biomarkers Prev., 2007, 16, 1651–1654 CAS.
- C. W. Suitor and L. D. Meyers, Dietary Reference Intakes Research Synthesis: Workshop Summary, The National Academies Press, 2006 Search PubMed.
- D. S. Hardin, J. Am. Diet. Assoc., 2009, 109, 1698–1699 CrossRef PubMed.
- B. McCabe-Sellers, J. Am. Diet. Assoc., 2010, 110, 52–54 CrossRef PubMed.
- F. E. Thompson and A. F. Subar, in Nutrition in the Prevention and Treatment of Disease, Academic Press, 3rd edn, 2013, pp. 5–46 Search PubMed.
- W. C. Willett and E. Lenart, in Nutritional Epidemiology, O.U. Press, New York, 2nd edn, 1998, pp. 101–147 Search PubMed.
- V. E. Hedrick, J. Savla, D. L. Comber, K. D. Flack, P. A. Estabrooks, P. A. Nsiah-Kumi, S. Ortmeier and B. M. Davy, J. Acad. Nutr. Diet., 2012, 112, 840–849 CrossRef PubMed.
- R. K. Johnson, B. A. Yon and J. H. Hankin, in Research: Successful Approaches, ed. E. R. Monsen and L. Van Horn, American Dietetic Association, 3rd edn, pp. 187–204 Search PubMed.
- N. Tasevska, S. A. Runswick, A. McTaggart and S. A. Bingham, Cancer Epidemiol., Biomarkers Prev., 2005, 14, 1287–1294 CAS.
- A. M. Joosen, G. G. Kuhnle, S. A. Runswick and S. A. Bingham, Int. J. Obes., 2008, 32, 1736–1740 CrossRef CAS PubMed.
- N. Tasevska, S. A. Runswick, A. A. Welch, A. McTaggart and S. A. Bingham, Eur. J. Clin. Nutr., 2009, 63, 653–659 CrossRef CAS PubMed.
- H. Kawabata, J. B. Meddings, Y. Uchida, K. Matsuda, K. Sasahara and M. Nishioka, J. Gastroenterol. Hepatol., 1998, 13, 1002–1006 CrossRef CAS.
- C. W. Hamm, J. Ravkilde, W. Gerhardt, P. Jorgensen, E. Peheim, L. Ljungdahl, B. Goldmann and H. A. Katus, N. Engl. J. Med., 1992, 327, 146–150 CrossRef CAS PubMed.
- E. K. Bajwa, P. D. Boyce, J. L. Januzzi, M. N. Gong, B. T. Thompson and D. C. Christiani, Crit. Care Med., 2007, 35, 2484–2490 CrossRef.
- A. J. Cross and J. W. Lampe, in Nutrition in the prevention and treatment of disease, ed. A. Coulston, C. Boushey and M. Ferruzzi, Academic Press, Waltham, MA, 3rd edn, 2013 Search PubMed.
- V. E. Hedrick, A. M. Dietrich, P. A. Estabrooks, J. Savla, E. Serrano and B. M. Davy, Nutr. J., 2012, 11, 109 CrossRef PubMed.
- S. A. Bingham, J. Nutr., 2003, 133(suppl. 3), 921S–924S CAS.
- A. R. Mangels, J. M. Holden, G. R. Beecher, M. R. Forman and E. Lanza, J. Am. Diet. Assoc., 1993, 93, 284–296 CrossRef CAS.
- K. J. Yeum, S. L. Booth, J. A. Sadowski, C. Liu, G. Tang, N. I. Krinsky and R. M. Russell, Am. J. Clin. Nutr., 1996, 64, 594–602 CAS.
- Z. Wang and R. N. Pierson, Jr, Phys. Med. Biol., 2010, 55, 5953–5963 CrossRef CAS PubMed.
- H. C. W. Skinner and A. H. Jahren, in Biogeochemistry, ed. W. H. Schlesinger, Elsevier Science, 2003, vol. 8, pp. 117–184 Search PubMed.
- D. J. Reid and M. C. Dean, J. Hum. Evol., 2006, 50, 329–346 CrossRef CAS PubMed.
- B. T. Fuller, M. P. Richards and S. A. Mays, J. Archaeol. Sci., 2003, 30, 1673–1684 CrossRef.
- K. Pye, Geol. Soc. Spec. Publ., 2004, 232, 215–236 CrossRef CAS.
- S. Ambrose and L. Norr, in Prehistoric Human Bone, ed. J. Lambert and G. Grupe, Springer, Berlin Heidelberg, 1993, pp. 1–37 Search PubMed.
- H. C. Hopps, Sci. Total Environ., 1977, 7, 71–89 CrossRef CAS.
- G. E. Mathison, Ann. Soc. Belg. Med. Trop. Parasitol. Mycol., 1964, 44, 767–791 CAS.
- K. J. Petzke, B. T. Fuller and C. C. Metges, Curr. Opin. Clin. Nutr. Metab. Care, 2010, 13, 532–540 CrossRef CAS PubMed.
- K. J. Petzke, H. Boeing, S. Klaus and C. C. Metges, J. Nutr., 2005, 135, 1515–1520 CAS.
- S. A. Macko, M. H. Engel, V. Andrusevich, G. Lubec, T. C. O'Connell and R. E. Hedges, Philos. Trans. R. Soc., B, 1999, 354, 65–75 CrossRef CAS PubMed , discussion 75–66.
- G. B. Nardoto, S. Silva, C. Kendall, J. R. Ehleringer, L. A. Chesson, E. S. Ferraz, M. Z. Moreira, J. P. Ometto and L. A. Martinelli, Am. J. Phys. Anthropol., 2006, 131, 137–146 CrossRef PubMed.
- J. S. McCullagh, J. A. Tripp and R. E. Hedges, Rapid Commun. Mass Spectrom., 2005, 19, 3227–3231 CrossRef CAS PubMed.
- F. Huelsemann, U. Flenker, K. Koehler and W. Schaenzer, Rapid Commun. Mass Spectrom., 2009, 23, 2448–2454 CrossRef CAS PubMed.
- A. T. Cawley and U. Flenker, J. Mass Spectrom., 2008, 43, 854–864 CrossRef CAS PubMed.
- G. G. Kuhnle, A. M. Joosen, C. J. Kneale and T. C. O'Connell, Eur. J. Nutr., 2013, 52, 389–395 CrossRef CAS PubMed.
- L. A. Liotta, M. Ferrari and E. Petricoin, Nature, 2003, 425, 905 CrossRef CAS PubMed.
- Atherosclerosis Risk in Communities Study Description, ed. UNC Department of Biostatistics, 2013, vol. 2013 Search PubMed.
- C. M. Cook, A. L. Alvig, Y. Q. Liu and D. A. Schoeller, J. Nutr., 2010, 140, 333–337 CrossRef CAS PubMed.
- K. Choy, S. H. Nash, A. R. Kristal, S. Hopkins, B. B. Boyer and D. M. O'Brien, J. Nutr., 2013, 878–884 CrossRef CAS PubMed.
- B. M. Davy, A. H. Jahren, V. E. Hedrick and D. L. Comber, J. Am. Diet. Assoc., 2011, 111, 874–878 CrossRef CAS PubMed.
- B. Sterling, T. Kiang, K. Subramanian, M. Saltman, W. Smart, M. Tsay, J. Sugarman, D. Patel, D. Monger and D. Martin, et al. , Clin. Chem., 1992, 38, 1658–1664 CAS.
- E. H. Robison, T. S. Mondala, A. R. Williams, S. R. Head, D. R. Salomon and S. M. Kurian, BMC Genomics, 2009, 10, 617 CrossRef PubMed.
- R. Park and S. Epstein, Geochim. Cosmochim. Acta, 1960, 21, 110–126 CrossRef CAS.
- G. D. Farquhar, J. R. Ehleringer and K. T. Hubick, Annu. Rev. Plant Physiol. Plant Mol. Biol., 1989, 40, 503–537 CrossRef CAS.
- A. Hope Jahren, Review of Palaeobotany and Palynology, 2004, 132, 291–313 CrossRef PubMed.
- R. Amundson, R. R. Evett, A. H. Jahren and J. Bartolome, Review of Palaeobotany and Palynology, 1997, 99, 17–24 CrossRef.
- R. A. Kraft, A. H. Jahren and C. D. Saudek, Rapid Commun. Mass Spectrom., 2008, 22, 3683–3692 CrossRef CAS PubMed.
- E. H. Yeung, C. D. Saudek, A. H. Jahren, W. H. Kao, M. Islas, R. Kraft, J. Coresh and C. A. Anderson, Am. J. Epidemiol., 2010, 172, 1045–1052 CrossRef PubMed.
- T. W. D. Edwards and D. A. Walker, C3, C4: Mechanisms, and Cellular and Environmental Regulation, of Photosynthesis, Blackwell Scientific Publications, Oxford, 1983 Search PubMed.
- T. Whelan and W. M. Sackett, Plant Physiol., 1973, 51, 1051–1054 CrossRef CAS PubMed.
- P. H. Raven, R. F. Evert and S. E. Eichhorn, Biology of Plants, Worth Publishers, New York, NY, 5th edn, 1992 Search PubMed.
- J. S. Ruff, A. K. Suchy, S. A. Hugentobler, M. M. Sosa, B. L. Schwartz, L. C. Morrison, S. H. Gieng, M. K. Shigenaga and W. K. Potts, Nat. Commun., 2013, 4, 2245 Search PubMed.
- M. Heasman, Br. Food J., 1989, 91, 9–16 CrossRef.
- R. B. O. Ervin and C. L. Ogden, NCHS Data Brief, 2013, article no. 122 Search PubMed.
- in Economic Research Service Yearbook Tables, USDA, 2013 Search PubMed.
- V. S. Malik, A. Pan, W. C. Willett and F. B. Hu, Am. J. Clin. Nutr., 2013, 98, 1084–1102 CrossRef CAS PubMed.
- L. Chen, L. J. Appel, C. Loria, P. H. Lin, C. M. Champagne, P. J. Elmer, J. D. Ard, D. Mitchell, B. C. Batch, L. P. Svetkey and B. Caballero, Am. J. Clin. Nutr., 2009, 89, 1299–1306 CrossRef CAS PubMed.
- E. A. Dennis, K. D. Flack and B. M. Davy, Eat. Behav., 2009, 10, 237–246 CrossRef PubMed.
- B. M. Popkin, L. E. Armstrong, G. M. Bray, B. Caballero, B. Frei and W. C. Willett, Am. J. Clin. Nutr., 2006, 83, 529–542 CAS.
- K. D. Brownell and T. R. Frieden, N. Engl. J. Med., 2009, 360, 1805–1808 CrossRef CAS PubMed.
- R. R. Briefel and C. L. Johnson, Annu. Rev. Nutr., 2004, 24, 401–431 CrossRef CAS PubMed.
- G. A. Bray, S. J. Nielsen and B. M. Popkin, Am. J. Clin. Nutr., 2004, 79, 537–543 CAS.
- R. S. Strauss and H. A. Pollack, JAMA, J. Am. Med. Assoc., 2001, 286, 2845–2848 CrossRef CAS.
- C. L. Ogden, M. D. Carroll, B. K. Kit and K. M. Flegal, NCHS Data Brief, 2012, 1–8 Search PubMed.
- D. A. Schoeller, J. Archaeol. Sci., 1999, 26, 667–673 CrossRef.
- L. L. Tieszen, T. W. Boutton, K. G. Tesdahl and N. A. Slade, Oecologia, 1983, 57, 32–37 CrossRef.
- S. H. Nash, A. R. Kristal, A. Bersamin, S. E. Hopkins, B. B. Boyer and D. M. O'Brien, J. Nutr., 2013, 143, 161–165 CrossRef CAS PubMed.
- W. C. Willett, Nutritional epidemiology, Oxford University Press, New York, NY, 2nd edn, 1998 Search PubMed.
- C. P. Dancey and J. Reidy, Statistics without maths for psychology, Pearson Education Limited, Essex, England, 4th edn, 2007 Search PubMed.
- K. Nakamura, D. A. Schoeller, F. J. Winkler and H. L. Schmidt, Biomed. Mass Spectrom., 1982, 9, 390–394 CrossRef CAS PubMed.
- D. A. Schoeller, M. Minagawa, R. Slater and I. R. Kaplan, Ecol. Food Nutr., 1986, 18, 159–170 CrossRef CAS.
- L. Tieszen and T. Fagre, in Prehistoric Human Bone, ed. J. Lambert and G. Grupe, Springer, Berlin Heidelberg, 1993, pp. 121–155 Search PubMed.
- J. Yoshinaga, M. Minagawa, T. Suzuki, R. Ohtsuka, T. Kawabe, T. Inaoka and T. Akimichi, Am. J. Phys. Anthropol., 1996, 100, 23–34 CrossRef CAS.
- T. C. O'Connell and R. E. Hedges, Am. J. Phys. Anthropol., 1999, 108, 409–425 CrossRef CAS.
- T. C. O'Connell, R. E. M. Hedges, M. A. Healey and A. H. R. W. Simpson, J. Archaeol. Sci., 2001, 28, 1247–1255 CrossRef.
- R. Bol and C. Pflieger, Rapid Commun. Mass Spectrom., 2002, 16, 2195–2200 CrossRef CAS PubMed.
- K. J. Petzke, H. Boeing and C. C. Metges, Rapid Commun. Mass Spectrom., 2005, 19, 1392–1400 CrossRef CAS PubMed.
- K. A. Hatch, M. A. Crawford, A. W. Kunz, S. R. Thomsen, D. L. Eggett, S. T. Nelson and B. L. Roeder, Rapid Commun. Mass Spectrom., 2006, 20, 3367–3373 CrossRef CAS PubMed.
- A. M. Mekota, G. Grupe, S. Ufer and U. Cuntz, Rapid Commun. Mass Spectrom., 2006, 20, 1604–1610 CrossRef CAS PubMed.
- A. H. Thompson, L. A. Chesson, D. W. Podlesak, G. J. Bowen, T. E. Cerling and J. R. Ehleringer, Am. J. Phys. Anthropol., 2010, 141, 440–451 CAS.
- T. C. O'Connell, C. J. Kneale, N. Tasevska and G. G. Kuhnle, Am. J. Phys. Anthropol., 2012, 149, 426–434 CrossRef CAS PubMed.
- L. O. Valenzuela, L. A. Chesson, G. J. Bowen, T. E. Cerling and J. R. Ehleringer, PLoS One, 2012, 7, e34234 CAS.
- J. G. Gragnani, M. E. P. E. Garavello, R. J. Silva, G. B. Nardoto and L. A. Martinelli, J Hum Nutr Diet, 2013, Epub ahead of print Search PubMed.
- M. J. Babcock, J. Nutr., 1955, 55, 323–336 CAS.
- D. Hewitt and R. W. Hillman, Am. J. Clin. Nutr., 1966, 19, 436–439 CAS.
- A. BØYum, Scand. J. Immunol., 1976, 5, 9–15 CrossRef.
- D. Shemin and D. Rittenberg, J. Biol. Chem., 1946, 166, 627–636 CAS.
- S. H. Nash, A. Bersamin, A. R. Kristal, S. E. Hopkins, R. S. Church, R. L. Pasker, B. R. Luick, G. V. Mohatt, B. B. Boyer and D. M. O'Brien, J. Nutr., 2012, 142, 84–90 CrossRef CAS PubMed.
- M. T. Sullivan, R. Cotten, E. J. Read and E. L. Wallace, Transfusion, 2007, 47, 385–394 CrossRef PubMed.
- V. E. Hedrick, D. L. Comber, P. A. Estabrooks, J. Savla and B. M. Davy, J. Am. Diet. Assoc., 2010, 110, 1227–1232 CrossRef PubMed.
- W. L. Clarke, D. Cox, L. A. Gonder-Frederick, W. Carter and S. L. Pohl, Diabetes Care, 1987, 10, 622–628 CAS.
- H. Elrick, L. Stimmler, C. J. Hlad, Jr and Y. Arai, J. Clin. Endocrinol. Metab., 1964, 24, 1076–1082 CrossRef CAS PubMed.
- C. Fromentin, D. Tomé, F. Nau, L. Flet, C. Luengo, D. Azzout-Marniche, P. Sanders, G. Fromentin and C. Gaudichon, Diabetes, 2013, 62, 1435–1442 CrossRef CAS PubMed.
- E. A. Dennis, A. L. Dengo, D. L. Comber, K. D. Flack, J. Savla, K. P. Davy and B. M. Davy, Obesity, 2010, 18, 300–307 CrossRef PubMed.
- M. Konig, S. Bulik and H. G. Holzhutter, PLoS Comput. Biol., 2012, 8, e1002577 Search PubMed.
- F. Q. Nuttall, A. Ngo and M. C. Gannon, Diabetes/Metab. Res. Rev., 2008, 24, 438–458 CrossRef CAS PubMed.
- M. A. Permutt, J. Wasson and N. Cox, J. Clin. Invest., 2005, 115, 1431–1439 CrossRef CAS PubMed.
- P. Felig, T. Pozefsk, E. Marlis and G. F. Cahill, Science, 1970, 167, 1003–1004 CAS.
- G. Perriello, R. Jorde, N. Nurjhan, M. Stumvoll, G. Dailey, T. Jenssen, D. M. Bier and J. E. Gerich, Am. J. Physiol., 1995, 269, E443–E450 CAS.
- C. Waterhouse and J. Keilson, J. Lab. Clin. Med., 1978, 92, 803–812 CAS.
- R. D. Yang, D. E. Matthews, D. M. Bier, Z. M. Wen and V. R. Young, Am. J. Physiol., 1986, 250, E39–E46 CAS.
- L. J. Reitsema, Am. J. Hum. Biol., 2013, 25, 445–456 CrossRef PubMed.
- V. L. Fulgoni, 3rd, Am. J. Clin. Nutr., 2008, 87, 1554S–1557S Search PubMed.
- L. A. Trivelli, H. M. Ranney and H. T. Lai, N. Engl. J. Med., 1971, 284, 353–357 CrossRef CAS PubMed.
- H. F. Bunn, D. N. Haney, S. Kamin, K. H. Gabbay and P. M. Gallop, J. Clin. Invest., 1976, 57, 1652–1659 CrossRef CAS PubMed.
- C. Weykamp, W. G. John and A. Mosca, J. Diabetes Sci. Technol., 2009, 3, 439–445 CrossRef PubMed.
- R. Hanas, G. John and A. C. C. International Hb, Clin. Chem., 2010, 56, 1362–1364 CAS.
- S. Ferri, S. Kim, W. Tsugawa and K. Sode, J. Diabetes Sci. Technol., 2009, 3, 585–592 CrossRef PubMed.
- L. Liu, S. Hood, Y. Wang, R. Bezverkov, C. Dou, A. Datta and C. Yuan, Clin. Biochem., 2008, 41, 576–583 CrossRef CAS PubMed.
- J. Lee, M. Kim, H. Chae, Y. Kim, H. I. Park, Y. Kim, H. Chi and H. J. Kwon, Clin. Chem. Lab. Med., 2013, 1–8 CrossRef PubMed.
- in National Agriculture Statistics Service: Crop Production, USDA, 2013 Search PubMed.
- M. Schwertl, K. Auerswald, R. Schäufele and H. Schnyder, Agric., Ecosyst. Environ., 2005, 109, 153–165 CrossRef CAS PubMed.
- C. Gillam, Sweet times for cows as gummy worms replace costly corn feed, ed. L. Gevirtz, Reuters, Reuters U.S. Edition, 2012, vol. 2013 Search PubMed.
- O. Schmidt, J. M. Quilter, B. Bahar, A. P. Moloney, C. M. Scrimgeour, I. S. Begley and F. J. Monahan, Food Chem., 2005, 91, 545–549 CrossRef CAS PubMed.
- B. Bahar, F. J. Monahan, A. P. Moloney, P. O'Kiely, C. M. Scrimgeour and O. Schmidt, Rapid Commun. Mass Spectrom., 2005, 19, 1937–1942 CrossRef CAS PubMed.
- M. Boner and H. Forstel, Anal. Bioanal. Chem., 2004, 378, 301–310 CrossRef CAS PubMed.
- E. Piasentier, R. Valusso, F. Camin and G. Versini, Meat Sci., 2003, 64, 239–247 CrossRef CAS.
- A. H. Jahren and R. A. Kraft, Proc. Natl. Acad. Sci. U. S. A., 2008, 105, 17855–17860 CrossRef CAS PubMed.
- A. H. Jahren and B. A. Schubert, Proc. Natl. Acad. Sci. U. S. A., 2010, 107, 2099–2101 CrossRef CAS PubMed.
- R. J. Panetta and A. H. Jahren, Rapid Commun. Mass Spectrom., 2011, 25, 1373–1381 CrossRef CAS PubMed.
- A. Barrie, S. T. Brookes, S. J. Prosser and S. Debney, Fert. Res., 1995, 42, 43–59 CrossRef CAS.
- N. J. P. Owens and A. P. Rees, Analyst, 1989, 114, 1655–1657 RSC.
- M. Minagawa and E. Wada, Geochim. Cosmochim. Acta, 1984, 48, 1135–1140 CrossRef CAS.
- T. S. Adams and R. W. Sterner, Limnol. Oceanogr., 2000, 45, 601–607 CrossRef CAS.
- S. Ambrose and M. DeNiro, Oecologia, 1986, 69, 395–406 CrossRef.
- M. P. Richards and R. E. M. Hedges, J. Archaeol. Sci., 1999, 26, 717–722 CrossRef.
- S. H. Nash, A. R. Kristal, A. Bersamin, K. Choy, S. E. Hopkins, K. L. Stanhope, P. J. Havel, B. B. Boyer and D. M. O'Brien, Eur. J. Clin. Nutr., 2014, 68, 91–96 CrossRef CAS PubMed.
- D. M. O'Brien, A. R. Kristal, M. A. Jeannet, M. J. Wilkinson, A. Bersamin and B. Luick, Am. J. Clin. Nutr., 2009, 89, 913–919 CrossRef CAS PubMed.
- F. Huelsemann, K. Koehler, H. Braun, W. Schaenzer and U. Flenker, Am. J. Phys. Anthropol., 2013, 152, 58–66 CrossRef CAS PubMed.
- M. L. Disis and J. T. Slattery, Sci. Transl. Med., 2010, 2, 22cm29 Search PubMed.
- L. M. Bennett and H. Gadlin, J. Invest. Med., 2012, 60, 768–775 Search PubMed.
- R. J. Amdur and C. Biddle, JAMA, J. Am. Med. Assoc., 1997, 277, 909–914 CrossRef CAS.
- Br. J. Anaesth., ed. C. Reilly, 2011, 107, 116–117 Search PubMed.
- in 111.4b, ed. J. H. S. o. Medicine, JMS Office of Human Subjects Research-Institutional Review Boards, 2006.
- A. N. Westover and L. B. Marangell, Depression Anxiety, 2002, 16, 118–120 CrossRef PubMed.
- S. Seely and D. F. Horrobin, Med. Hypotheses, 1983, 11, 319–327 CrossRef CAS.
- G. Hems, Br. J. Cancer, 1978, 37, 974–982 CrossRef CAS.
- M. Virkkunen, Nutr. Rev., 1986, 44, 94–103 CrossRef.
| This journal is © The Royal Society of Chemistry 2014 |